Biology of Humans
24. Human Population, Limited Resources, and Pollution
In the previous chapter, we learned about the functioning of ecosystems and how it is affected by human activities. In this chapter, we consider problems stemming from human population growth. We start by reviewing general principles governing population size. Then we consider how the rapid growth of the human population has led to pollution, depletion of Earth’s resources, and global climate change. Last, we discuss how the choices we make today can affect the quality of life on Earth in the future.
Population Changes
There is no way to discuss human populations without arousing concern. The worries arise from two kinds of information. First, the increase in human numbers is startling, and we just do not know how long population growth can continue. Second, humans are using the world's natural resources much faster than they can be replaced (if they can be replaced). Although some resources are renewable, many are finite. We review the evidence for each of these trends and discuss possible consequences—and consider some solutions.
Population Growth Rate
Population dynamics describe how populations change in size. The human population, we can say, consists of all individuals alive at any time. This enormous population can be broken down into smaller groups. Thus we can speak of the population of the United States or Colombia or China. We can break it down further and consider, say, urban American populations versus rural ones.
· Hydroponic gardening can produce fruits and vegetables more quickly than conventional gardening and uses less space.
Population size changes when individuals are added and removed at different rates. Usually, the rate is reported as the number of births or deaths per 1000 persons per year. Expressing a population's growth as a rate keeps the change in population size in perspective. For example, we would consider the addition of 1000 individuals to a population differently if it took place overnight than if it took place over a year. Furthermore, the addition of 1000 individuals would be more important if the initial population size were 100 than if it were 1000.
A population grows when more individuals are added than are subtracted. Growth rate, the difference between the birth rates and death rates of a population, is a measure of this event. Some individuals join a population or leave it by immigration or emigration, but most of a population's members are added by birth and removed by death. Most likely, your own family has added to the population growth over the last few generations. How many living descendants do your grandparents have (Figure 24.1)?

FIGURE 24.1. Gladys Davis is surrounded by her six greatgrandchildren. She and her husband had four children, two of whom had children of their own, producing three grandchildren. The three grandchildren produced these six great-grandchildren. By mid-2010, two of the children shown here had started their own families, producing six great-great-grandchildren. Although the size of each individual family was small, there are currently 15 living descendants of Jack and Gladys Davis. How much has your family grown in the last few generations?
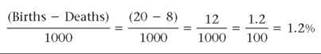
In 2009, the estimated birth rate of the world's population was 20 births per 1000 individuals per year, and the death rate was 8 deaths per 1000 individuals per year. Thus the growth rate of the world's population, an increase of 12 individuals per 1000, was 1.2%.
However, knowing the growth rate is not enough to predict how quickly new individuals will be added to the population. We must also know the number of individuals in the starting population. Since added individuals also reproduce, population growth occurs much like compound interest accumulates in the bank—the more you start with, the more you end up with. At the same growth rate, then, the larger the size of the starting population, the more individuals are produced.
The age at which females have their first offspring dramatically affects the birth rate of a population. The younger women are when they begin to reproduce, the faster the population grows. In fact, the age when reproduction begins is the most important factor influencing a female's overall reproductive potential. For example, the increasing proportion of women who are postponing childbirth until their later reproductive years has been helping to slow the population growth rate of the United States. The birth rate in the United States is declining for women of all ages, but the largest drop in birth rate has occurred among women in their twenties. One reason may be that increasing numbers of women want to establish careers before beginning motherhood. Regardless of the reasons, this trend is contributing to slower U.S. population growth than in the past.
Besides birth rate, death rate is an important part of the equation that determines growth rate. Although the world birth rate has been steadily declining since 1970, the human population has continued to grow partly because the drop in death rate has been greater than the drop in birth rate. The discovery of antibiotics was certainly instrumental in the decline of death rates. However, even more important were improvements in sanitation, hygiene, and nutrition.
Although a growth rate of a few percent a year may not seem startling, its importance becomes clearer when it is expressed as doubling time—that is, the number of years it will take for a population to double at that rate of growth. To give you an idea of how important this measure is, if this page is 1/250 inch thick and were doubled (exponentially) only eight times, it would be an inch thick. At 12 more doublings, it would be as thick as a football field is long. At 42 times, it would reach to the moon; and at only 50 times, it would reach the 93 million miles to the sun. Obviously, knowing the doubling time of a population can yield some interesting predictions.
The simplest way to arrive at a doubling time is to divide the population's growth rate into 70 (a demographic constant value). Thus, if the world population continues to grow at the rate it did in 2009 (1.2%), the world population will double in just a little more than 58.8 years! This is how long it will be before we need two schools where there is now one and two roads, two dams, two telephone poles, two hospitals, two doctors, and two power plants where there is now one. With everything doubled, what happens to our quality of life in general? Doubling times vary widely in different countries, but in general, less developed countries (LDCs; poorer countries) have a much smaller doubling time than do more developed countries (MDCs; usually richer countries).
Stop and think
A pair of cockroaches is placed on a small island. Assume that the doubling time for a population of cockroaches is 1 month. After 20 years the island contains half of the total number of roaches it could possibly hold. How much longer would it take until the island was completely filled with roaches? (Hint: What is the doubling time for the population?)
Age Structure
When we want to predict future growth, a population's age structure—the relative number of individuals of each age—can be helpful. The age structure of the population is important because only individuals within a certain age range reproduce. Among humans, for instance, toddlers and octogenarians are counted as members of the population, but they do not reproduce. The ages are often grouped into prereproductive, reproductive, and postreproductive categories. Generally, only individuals of reproductive age add to the population size. However, the prereproductive group (those who are currently too young to reproduce) usually get older; and when they enter the reproductive class, they have children, thus adding more members to the population. Even if the birth rate remains the same, the overall population size will grow more rapidly if the size of the reproductive class increases.
Stop and think
Health care has improved greatly in the last century and has increased population growth. Why would measures that decrease child mortality (death) contribute more to population growth than would measures that increase life expectancy?
We see, then, that the relative size of the base of a population's age structure (the prereproductive age category) determines how quickly numbers will be added to the population in the future. A wide base to any age structure diagram reflects a growing population, whereas a narrow base characterizes a population that is getting smaller (Figure 24.2). A large base to any such diagram, as exists in India, spells trouble regarding future demands on the country's commodities. Moderately stable nations, such as the United States, show a more consistent age distribution—with some fluctuation, but a small prereproductive population. The prereproductive base of Canada's age structure is smaller than the reproductive base. Canada's population will probably decline in the future.
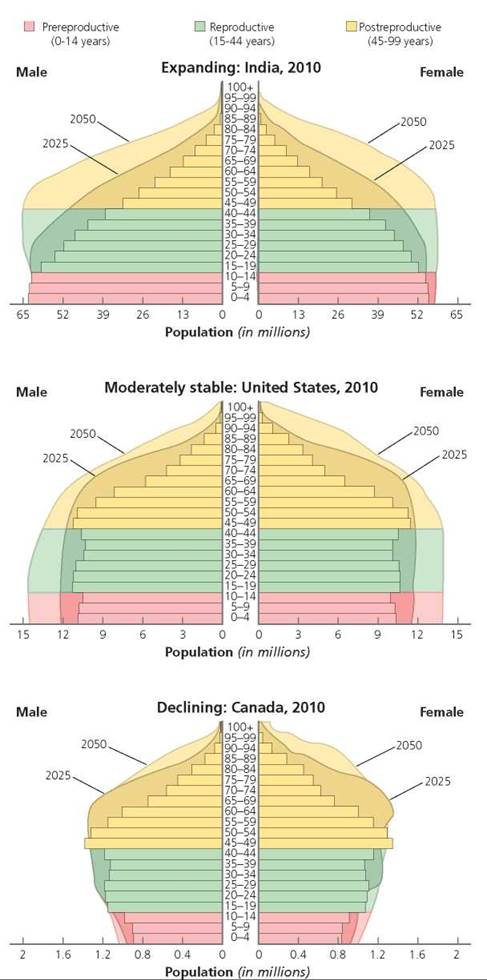
FIGURE 24.2. Age structures of India, the United States, and Canada. The age structures shown are estimates for 2010, 2025, and 2050.
Source: U.S. Census Bureau, International Data Base.
Immigration and Emigration
If we consider the human population of the world as a whole, the effects of immigration and emigration on population size are eliminated. However, immigration and emigration can dramatically affect the population size of countries, cities, and regions. People tend to migrate out of LDCs; the migration rate is -0.4/1000. On the other hand, people tend to migrate into MDCs, where the average migration rate is 1.6/1000.
Patterns of Population Growth
Let's return to an idea we introduced earlier in this chapter— the importance of population size to the rate at which new individuals are added to a population. Recall that when the growth rate remains constant, the number of individuals added to the population increases more rapidly as the size of the population increases. This unrestricted growth at a constant rate is called exponential growth. When the size of a population growing in this fashion is shown graphically, we see a J-shaped growth curve.
Unrestrained growth occurs in environments that have plenty of resources and adequate waste removal. In the real world, however, these conditions rarely exist for long. What happens when the food supply begins to become depleted, when space runs out, or when wastes begin to accumulate? The answer to this question is more than theoretically interesting to humans.
The number of individuals of a given species that a particular environment can support for a prolonged period is called its carrying capacity (Figure 24.3). It is determined by such factors as availability of resources, including food, water, and space; the means of cleaning away wastes; disease; and predation pressure.
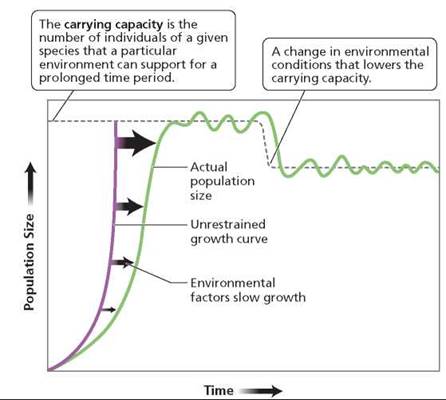
FIGURE 24.3. Population growth is often restrained by environmental factors, including the availability of food, water, and space and the accumulation of wastes. Environmental factors such as these determine the environment’s carrying capacity. Eventually, growth levels off, and the population size fluctuates around the carrying capacity. If a change in the environment lowers the carrying capacity, the population will stabilize at a smaller size.
If environmental limits are placed on population growth, we may wonder what might happen if a population overshoots the carrying capacity of the environment. One possibility is that environmental resources may become critically depleted, and the population may decline precipitously. More commonly, however, population growth is rapid while resources are plentiful. But as the population size approaches the carrying capacity of its environment, growth becomes slower and slower due to environmental pressures such as limited resources or accumulating wastes. Eventually, growth levels off and the population size fluctuates slightly around the carrying capacity—a pattern that forms an S-shaped growth curve. This pattern is called logistic growth.
How do these growth patterns apply to human population growth? For most of the period following the Stone Age, the human population grew steadily but relatively slowly. Around the time of the industrial revolution, the human population size began to increase rapidly, its growth pattern resembling a J-shaped curve. Now, however, the rapidity of its growth is disturbing (Figure 24.4). Human population size did not reach 1 billion until 1804, but since then additional billions are being born at a much faster rate. In mid-2010, the world population was approximately 6.8 billion people. It is expected that, by 2020, our numbers will reach 7.6 billion people.
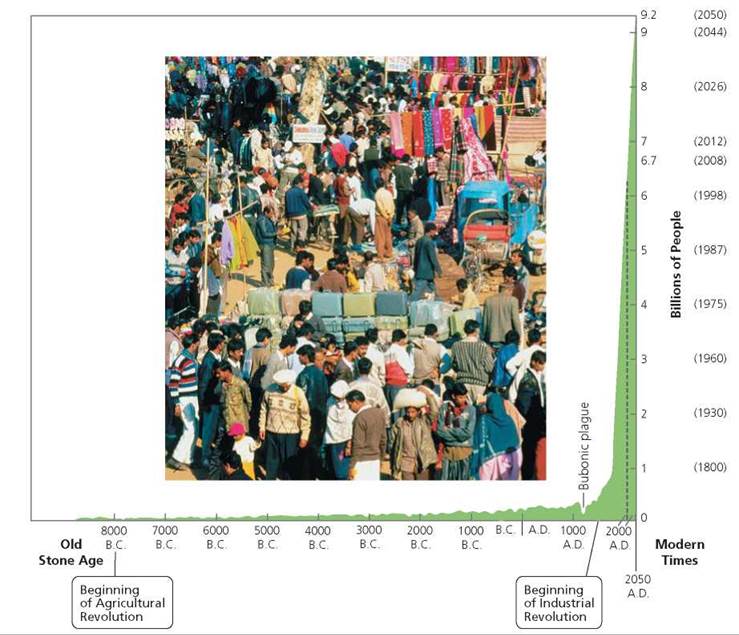
FIGURE 24.4. The human population has grown steadily throughout most of human history. It skyrocketed after the industrial revolution. The growth rate is now showing signs of slowing.
The growth rate for human populations in some parts of the world is greater than in other parts. The growth rate in LDCs—where most people live in poverty—greatly exceeds the growth rate in MDCs, where people are usually wealthier. During the next 40 years, 97% of the world's population growth is expected to be in LDCs. The growth rate of the world population has been slowing steadily over the past decade, suggesting that we may be reaching Earth's carrying capacity.
Environmental Factors and Population Size
The factors that reduce the size of populations can be described as density-dependent or density-independent. Density-independent regulating factors are causes of death that are not related to the density of individuals in a population (the number of individuals in a given area of habitat). These events include such natural disasters as floods, mudslides, earthquakes, hurricanes, and fires. For example, the earthquake that shook Haiti in 2010 killed more than 300,000 people. Such events are density independent because adding or removing people from the population would not alter the mortality rate of the event itself.
Density-dependent regulating factors are events that have a greater impact on the population as conditions become more crowded. For example, famine can be a density-dependent factor. If only so much food is available, an increasing population would mean there was less food for each person until, finally, some people would begin to starve (Figure 24.5). The greater the population density, the greater the effects of food scarcity on the population. Because disease-causing organisms and parasites spread more easily in crowded conditions than in uncrowded conditions, these too are density-dependent factors that regulate population sizes.
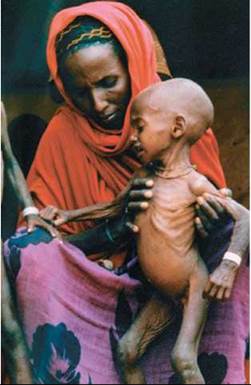
FIGURE 24.5. Food shortages may reflect density-dependent population controls, because they have a greater impact as population density increases.
Earth’s Carrying Capacity
Whatever your personal predictions for the future of humankind, one thing should be clear: the world is becoming an increasingly crowded place. You may recall from Chapter 23 that there is no input of new resources on Earth. Therefore, with our growing population, we run the risk of using up our resources and making our world unlivable because of our waste. In fact, human population size contributes to most of the problems we face today.
Earth's ability to support people depends on natural constraints, such as limited resource availability, as well as on human activities and choices. These, in turn, are influenced by economics, politics, technology, and values. Thus, Earth's carrying capacity for humans is uncertain and constantly changing. For instance, technological advances in agriculture and pollution control act to increase Earth's carrying capacity. At the same time, however, we have lowered the carrying capacity by consuming Earth's resources faster than they can be replaced—and, of course, some nonrenewable resources (such as fossil fuels) cannot be replaced.
Not surprisingly, estimates of Earth's carrying capacity vary widely, ranging from 5 billion to 20 billion people. Those who accept the lower values point to resource depletion and pollution as evidence that we have already exceeded Earth's carrying capacity with a world population of more than 6.8 billion.
Human Impacts on Earth’s Carrying Capacity
An ecological footprint is a measure of the amount of productive land and water required to support a person or population based on its consumption levels. Everything a person uses— food, energy, water, housing space—comes from somewhere. Calculation of an ecological footprint includes everything that is consumed and the corresponding waste removal. Thus, ecological footprints describe the burden placed on Earth's carrying capacity.
Ecological footprints reflect lifestyle choices. Generally, more affluent people or populations have larger ecological footprints. Since wealth is not equally distributed around the globe, ecological footprint sizes vary among countries, with LDCs having smaller footprints than MDCs do (Figure 24.6).
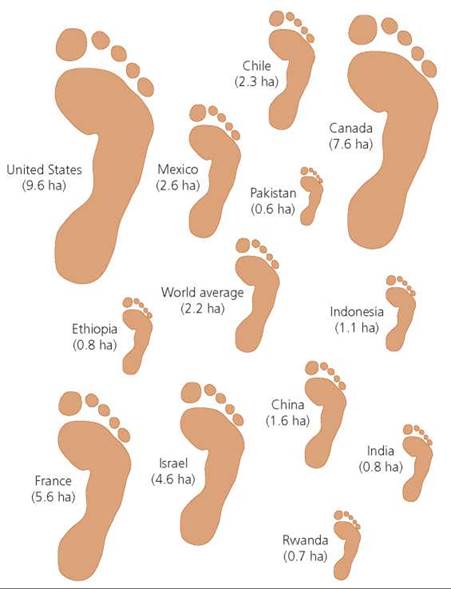
FIGURE 24.6. An ecological footprint is a measurement that includes all the direct and indirect impacts of the use of resources by a person or population and is expressed as the amount of Earth’s surface required for maintenance. It is usually expressed in hectares (ha). The citizens of some nations have much larger footprints than others.
Global Footprint Network, 2006
What might account for the differences in the size of the ecological footprints of the nations shown here?
More industrialized and affluent nations consume more of Earth's resources than poorer, less industrialized nations do.
Agricultural Advances
Agricultural production has increased in many countries, largely due to the so-called green revolution of the 1970s and 1980s—the development of high-yield varieties of crops and the use of modern cultivation methods, including the use of farm machinery, fertilizers, pesticides, and irrigation. For example, Indonesia at one time imported more rice than any other country, but now it grows enough rice to feed its people, as well as some to export.
Nonetheless, the green revolution has a big price tag: high energy costs and environmental damage. Although crop yields may be four times greater than with more traditional methods, modern farming practices use up to 100 times more energy and mineral resources. It takes energy—usually obtained from fossil fuels—to produce fertilizers, power tractors and combines, and install and operate irrigation systems.
Depletion of Resources
An intact natural ecosystem usually retains soil and remains fertile. However, overuse and misuse of resources can decrease Earth's carrying capacity.
Soil erosion. As the human population grows, land is cultivated, grazed, and stripped of vegetation faster than it can recover. Wind and rain then carry away the topsoil, and the area's productivity declines. In this way, overfarming and overgrazing transform marginal farmland to desert, in a process called desertification (Figure 24.7). According to the United Nations, a fifth of the world's population lives in areas currently threatened by desertification.
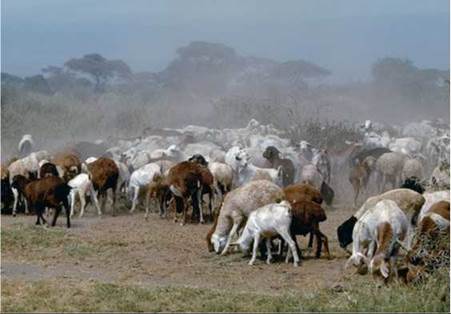
FIGURE 24.7. Desertification is the conversion of farmland, or in this case rangeland, to desert through overuse or other harmful practices.
Deforestation. People often do not value what they have until it is gone. This may be true for forests. Some of us live in areas where trees are so common that we take them for granted. However, trees, especially when they are grouped together to form forests, are essential to global ecosystems. As we learned in Chapter 23, forests play an important role in water, carbon, and nitrogen cycles. Tree roots also reduce erosion by holding soil in place. If trees are cut down, rainwater runs off the land, carrying away soil and causing floods. In addition, ecosystems containing trees support an incredible variety of life. Trees also influence local and global climate, including temperature and rainfall.
Why are forests disappearing? The answer is simple: the human population is expanding. People need space in which to live, and they need wood for homes and furniture. Livestock cannot graze in forests, and crops cannot grow in forests, so trees are cut for pasture and farmland. Most trees are not replanted.
Deforestation is the removal of trees from an area without replacing them (Figure 24.8). Deforestation is taking place in many regions of the world, including the United States. Before the colonization of North America, forests covered most of the eastern seacoast. Cities have now replaced many of those forests. In the U.S. Pacific Northwest, 80% of the forests are slated for logging.
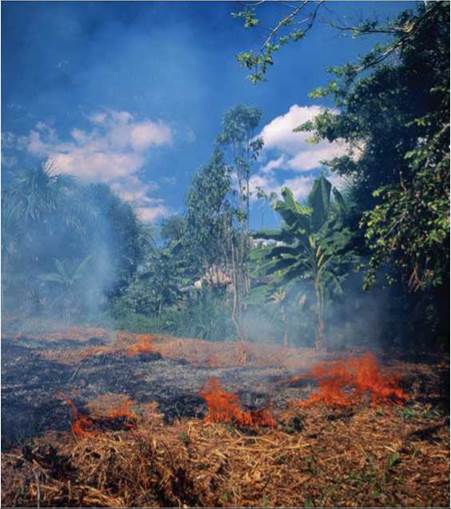
FIGURE 24.8. Deforestation damages soil quality.
Nonetheless, tropical forests—most of them located in less developed nations—are falling the fastest. Why? The first reason (based on impact) the land is being cleared is so that native families can feed themselves. The second reason is commercial logging. The third reason is cattle ranching. Cattle can graze for about 6 to 10 years after trees have been cleared from a tropical forest before shrubs take over and make the area unsuitable for rangeland. Foreign companies own most of these cattle ranches, and the beef is often exported to fast-food restaurant chains in other countries. Thus the decisions we make about what to eat for lunch may indirectly influence the rate of tropical deforestation. Other reasons include mining and the development of hydroelectric dams.
Whatever the reason for tropical deforestation, soil fertility declines rapidly when these forests are cut. As a result, native people who depend on the soil for their living become poorer.
Overfishing. Overfishing is another practice that is lowering Earth's carrying capacity. Fishing has long provided humans with an abundant food supply, but now many fish populations are being depleted to such levels that some fish can no longer be caught in certain areas. Recent examples include Atlantic cod in New England and salmon in the northwestern United States. Worldwide, 70% of the fisheries are overexploited. The problem is that we have not given the fish enough time to replace their numbers at their reduced population size. As numbers of fish have dwindled, the human response has been to fish harder, using more boats and new techniques, including electronic searches. Some species, the Atlantic bluefin tuna for instance, may already be so overfished that they will become extinct. Overfishing is causing the loss of species and entire ecosystems, as well as a valuable food source.
Water shortage. Earth has been called the Water Planet because water is so plentiful here. Still, relatively little is available for human use because 97% of Earth's water is in the oceans. You might think that at least all the freshwater would be available, but much of it is tied up in ice or clouds, hidden in underground rivers, or otherwise inaccessible for immediate human use. Indeed, freshwater scarcity is an emerging crisis.
In most regions, however, the underlying cause of water shortage is too many people drawing from a limited supply. Humans use water from two main sources: surface water, such as rivers and lakes, and groundwater, which is water found under Earth's surface in porous layers of rock, such as sand or gravel. When too much surface water is used in an area, ecosystems are affected. As much as 30% of a river's flow can usually be removed without affecting the natural ecosystem. However, in some parts of the southwestern United States, as much as 70% of the surface water has been removed.
Human use of groundwater is also depleting the aquifers (porous layers of underground rock where groundwater is found). Water is added to aquifers by rainfall or melting snow that filters through the topsoil. In some areas, however, water is being removed from aquifers faster than it can be replenished. The Ogallala Aquifer underlies eight states in the Great Plains region of the United States. Much of the water pumped up from the Ogallala Aquifer is used for irrigation and has made this region some of the most productive farmland in the country. However, the water level in the aquifer is dropping by 6 feet a year. The water tables beneath the highly populated northeastern United States are also dwindling dangerously.
What would you do?
A proposed crude oil pipeline from the tar sand hills of western Canada is expected to deliver 700,000 barrels of oil a day. The pipeline crosses 254 miles of Nebraska. The oil spill in the Gulf of Mexico in 2010 has some people worried that the pipeline might leak and endanger the Ogallala Aquifer. If you or someone you love lived in the region that gets its water from this aquifer, would you favor or oppose this pipeline? What factors would you consider in making your decision?
In some places drought, or lack of rain, has compounded the problem of water scarcity caused by the growing human population. A drought has affected the western United States for more than a decade. In some regions, farming and ranching have been severely affected. For example, some ranchers in the West have sold off parts of their herds because there is no grass to feed them. Drought also increases the risk of wildfires that kill plants, wildlife, and humans as well as destroy property. (Climate change, discussed later in the chapter, can also be blamed for the increased numbers of wildfires in recent years—and for the extended average fire season in the western United States, which is now 2 months longer than it was in 1970.)
A water footprint is an indicator of direct and indirect water use by a person, locality, or nation. Direct use refers to water use at home; indirect use refers to water used to produce goods and services. Since not all goods used in a country are produced there, a nation's water footprint includes the water needed to produce that product inside and outside that country's border. North Americans have an exceptionally large water footprint. The global average yearly use of water per person is 1240 cubic meters. In the United States, each person uses about 2500 cubic meters of water a year; in China, each person uses about 700 cubic meters of water a year.
These numbers are shocking, and you might be tempted to claim that you certainly do not use that much water. In one sense, you would be right. Personal use accounts for only a small percentage of total U.S. water use. Most of the water is used in agriculture. To feed its growing human population, our country increasingly relies on irrigation to make arid areas fruitful. The rest of the water is used primarily in industry for steam generation or the cooling of power plants.
Irrigation has pros and cons. It allows crops to grow in areas that would otherwise be barren. But it can also, in the long run, make the land unfit for agriculture. Irrigation water contains dissolved minerals. Whereas runoff from natural rainfall would carry these salts away, irrigation water soaks into the soil. Then, when the water evaporates from the soil, the salts are left behind. The resulting accumulation of salts in the soil is called salinization. Worldwide, salinization destroys the fertility of 5000 km2 (1930 mi2) of irrigated land each year.
Stop and think
Conservationists sometimes buy wetlands, hoping to preserve the habitats of endangered plants and wildlife. Despite this conservation strategy, the wetlands sometimes dry up. Why is it also important to buy the rights to the water that feeds the wetland?
What steps can be taken to reduce water shortages?
1. Reduce water use. Each of us could help by individual efforts. However, because most water is used in agriculture, the biggest benefit would come from improved irrigation methods. Between 1950 and 1980, for example, Israel reduced its water wastage from 83% to a mere 5%, primarily by changing from spray irrigation to drip irrigation. In contrast, more than half the water diverted for irrigation in California's Imperial Valley is wasted due to poorly designed irrigation systems.
2. Raise the price of water. The cost of water in the United States is substantially below its cost in European countries. Experience has shown that the consumer's interest in conserving water is directly related to its cost. Clearly, economic and legal incentives for conserving water are needed. Some experts suggest that water will be the most precious commodity in the twenty-first century, as oil was in the twentieth century.
Pollution
Another way we lower Earth's carrying capacity is by polluting resources, making the resource unfit for human use or damaging the environment in other ways.
Water pollution. Factories, refineries, and waste treatment plants release fluids of varying quality directly into our water supplies. Several contaminants responsible for surface water pollution are discussed in Chapter 23. For example, mercury and PCBs in water are examined as materials that become concentrated in organisms as these chemicals are passed up the food chain. We also considered how fertilizer runoff can lead to an overgrowth of algae and plants in bodies of water, which can deplete the oxygen content of the water so much that it no longer supports life. Although oil spills from oil rigs or tankers have become less common since the passage of the U.S. Oil Pollution Act of 1990, they can still occur with devastating consequences (see the Environmental Issue essay, The Deepwater Horizon Oil Spill.)
The same materials that contaminate surface water can contaminate groundwater. Above- or belowground storage tanks can corrode and leak their contents, which may be oil, gasoline, or other hazardous liquids. Septic systems, which are designed to allow wastewater to slowly drain away from their sources, may leak bacteria, viruses, and household chemicals to groundwater. Hazardous waste sites and landfills can also leak harmful materials into groundwater.
Environmental Issue
The Deepwater Horizon Oil Spill
In April of 2010 an explosion on the oil rig Deepwater Horizon began the worst oil spill in U.S. history. We don't know how long this oil spill will affect the ecosystem in the Gulf of Mexico. The floating oil damaged the ecosystem from the bottom up. Plankton at the base of the food web, along with fish eggs and the larvae of various invertebrates, became contaminated with oil. Fish eating these contaminated organisms also become contaminated, as did predators on the fish. The surface oil slick killed hundreds of birds. The population of brown pelicans, which had recovered from endangerment from the use of the pesticide DDT during the 1960s, was especially threatened. Pelican chicks of parents who were oil - covered, rescued, and taken to sanctuaries for recovery starved to death. Many ibis and terns were also covered in oil. The oil spill endangered 35 wildlife refuges. The damage to wildlife, marshes, and estuaries was painfully clear.
The danger to wildlife also lurked beneath the surface. Dispersants were used to break the oil into smaller droplets that can be broken down more easily than a layer of oil. The dispersants did indeed cause the oil to form droplets that mixed with methane gas, which was also gushing from the well. The plumes of oil mixed with methane drifted below the surface of the ocean, affecting life in their paths. The oil then settled to the sea floor, where it continues to affect the ecosystem. Phytoplankton, the primary producers in the oceanic ecosystem, were killed, and the effects rippled up the food chain to the seafood we like on our dinner plates.
The economic consequence of the Deepwater Horizon will linger for many years. Recreational beaches are damaged. The cost of seafood has risen. Many people living in the region worked on the oil rigs and lost their jobs.
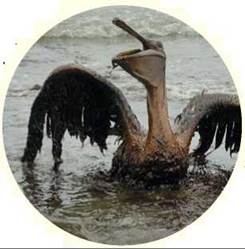
This pelican was covered in oil following the Deepwater Horizon oil spill.
Questions to Consider
• How do we balance our need for oil with the risks of drilling in deepwater?
• Who should pay for lingering damage to the environment and wildlife?
Ozone pollution and depletion. Ozone, a gas whose molecules are composed of three atoms of oxygen (O3), can be a good thing or a bad thing. At Earth's surface—say, anywhere in the first few miles of atmosphere—it is generally a bad thing. As an air pollutant, ozone is the primary component of photochemical smog, the noxious gas produced largely by sunlight interacting with air pollutants, such as hydrocarbons and nitrogen dioxide. Ozone irritates the eyes, skin, lungs, nose, and throat. (Effects of photochemical smog on the respiratory system are discussed in the Environmental Issue essay, Air Pollution and Human Health.) Ozone can also damage forests and crops and dissolve rubber.
In contrast, naturally produced ozone is an essential part of the stratosphere, a layer of the lower atmosphere that encircles the Earth about 10 to 45 km (6 to 28 mi) above its surface. The concentration of ozone in the stratosphere reaches levels of only about 1 molecule in 100,000. If all this ozone were compressed from top to bottom, its depth would equal only the diameter of a pencil lead. Still, the ozone is able to shield Earth from excessive ultraviolet (UV) radiation from the sun; without it, most terrestrial life-forms could not exist. UV radiation causes cataracts, aging of the skin, sunburn, and snow blindness; and it is the primary cause of skin cancer that kills nearly 11,000 Americans each year. In addition, UV radiation inhibits the immune systems of animals and can interfere with plant growth.
In 1985, British scientists reported a sharp drop in the concentration of ozone over the Antarctic. This "hole" appears on a yearly cycle—at the beginning of the Antarctic spring (early September through mid-October; Figure 24.9). The primary cause was discovered to be the action of chlorofluorocarbons (CFCs)— chemicals once important in cooling systems, as aerosol propellants, in the manufacture of plastic foam such as Styrofoam, and as solvents in the electronic industry. As pollutants, the CFCs drift up to the stratosphere, where UV radiation breaks them down into chlorine, fluorine, and carbon. Then, under the conditions found in the stratosphere, chlorine can react with ozone, converting it to oxygen. Because chlorine is not altered in this reaction, a single chlorine molecule can destroy thousands of ozone molecules.
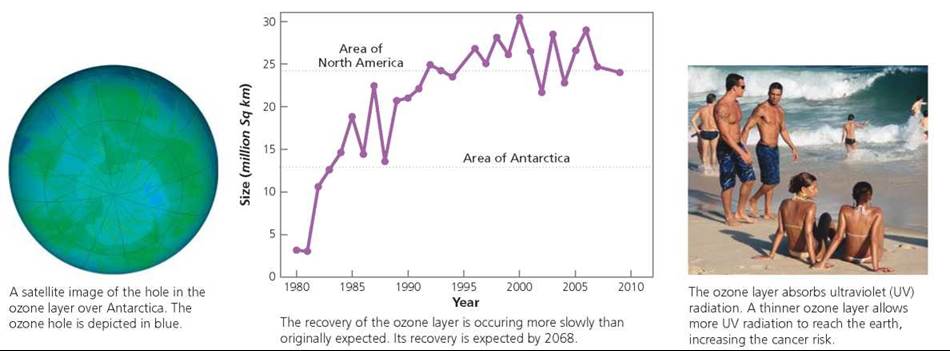
FIGURE 24.9. The thinning of the ozone layer
Several laws are now in place to prevent the production or release of CFCs. In 1990 and 1992, industrialized countries signed agreements to reduce CFC production and have now phased out CFC production. Substitutes for CFCs have been found for aerosol cans, refrigerators, and air conditioners. There is evidence that the reduction in CFC production is paying off. In 1996, two years after CFC use peaked, chlorine levels in the lower atmosphere were slightly lower than before. By 1999, chlorine levels in the stratosphere were reduced. Scientists predict that the ozone hole will recover by 2050-2070.
Global Climate Change
The word climate describes a region's average temperature, precipitation, humidity, barometric pressure, solar radiation, and other weather characteristics considered over a relatively long period of time. Global climate change, then, refers to changes in Earth's climate patterns—trends and variations. Although Earth's climate changes naturally over time, the rate of change today is extremely rapid.
The Intergovernmental Panel on Climate Change (IPCC), an international panel consisting of hundreds of scientists, was established by the United Nations Environmental Programme and the World Meteorological Organization to assess technical and scientific information regarding climate change as well as its social and economical implications. These groups scrutinized thousands of scientific papers and measurements of physical conditions on Earth. Here are two key conclusions of the IPCC's Fourth Assessment Report (2007).
1. The global climate is unquestionably getting warmer. The global temperature has increased 0.74°C in the last 100 years. Eleven out of 12 of the hottest years on record occurred between 1995 and 2006.1 During the last decades, the number of really hot days and heat waves increased, and the number of cold days decreased.
2. Most of the increase in global temperatures is due to human activity that releases greenhouse gases (carbon dioxide, methane, and nitrous oxide) into the atmosphere. The IPCC indicates that the "assessed likelihood, using expert judgment" that human activity is responsible for global warming is over 90%.
Nearly everyone agrees that the global climate is getting warmer, and most people agree that the elevated temperatures are due to human activities, primarily the burning of fossil fuels. We will look at the evidence supporting the link between greenhouse gases and climate change and then at the predicted consequences of global climate change.
Global Warming and Greenhouse Gases
Recall from Chapter 23 that humans are disrupting the natural carbon cycle by burning fossil fuels, which increases atmospheric carbon dioxide (CO2), and by clear-cutting forests, which reduces the removal of CO2 from the atmosphere. Because of these activities, the level of atmospheric carbon dioxide is rising. Carbon dioxide along with methane, nitrous oxides, and CFCs are considered greenhouse gases. Like the glass on a greenhouse, these gases allow the sunlight to pass through to Earth's surface, where it is absorbed and radiated back to the atmosphere as heat—long-wave infrared radiation. Greenhouse gases then absorb the infrared radiation, thus trapping the heat. (Figure 24.10). Because of this effect, a growing concern is that the increase in atmospheric CO2 due to human activities is leading to a rise in temperatures throughout the world—a situation popularly known as global warming.
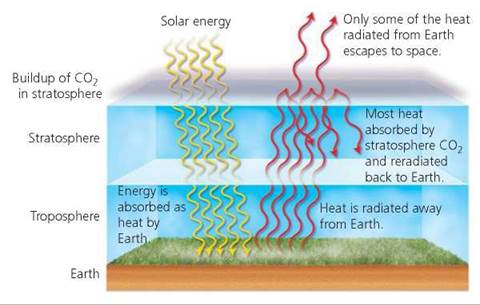
FIGURE 24.10. Carbon dioxide and other greenhouse gases promote global warming by trapping heat (infrared radiation) in the atmosphere, much like greenhouse glass traps heat. Thus, the global warming that is believed to be occurring due to the accumulation of these gases is known as the greenhouse effect.
Scientists rely on direct and indirect evidence of the link between global warming and greenhouse gases. Direct evidence comes from present-day measurement. Since 1958, atmospheric CO2 has been measured at Mauna Loa Observatory in Hawaii. Indirect evidence comes from ice cores, long columns of ice taken from ice sheets, ice caps, or glaciers. The most recent ice is at the top of the core; the oldest is at the bottom. Scientists can examine these ice cores and determine greenhouse gas concentrations, environmental temperature, and snowfall to understand the region's climate history. Notice the correlation between rising atmospheric CO2 and global temperature in Figure 24.11.
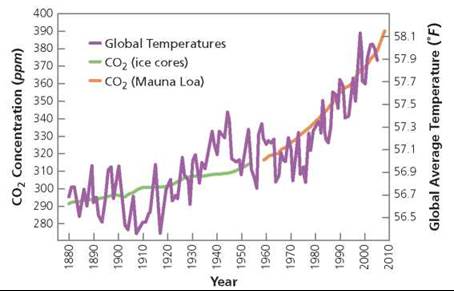
FIGURE 24.11. The concentration of CO2 in the atmosphere has been increasing for many years. Two major causes are the burning of fossil fuels, which releases CO2, and deforestation, which leaves fewer trees to remove CO2 from the atmosphere. Global temperatures have also risen during this period.
National Oceanic and Atmospheric Administration
Some people do not believe that rising atmospheric CO2 from human impacts is the cause of increasing global temperature. Some point out that rising temperatures could be the result of a natural climate cycle. Others suggest that domesticated animals, such as cattle, sheep, and goats, are to blame. Bacteria in the guts of these animals produce methane, a greenhouse gas whose heat-trapping ability is 20 times greater than that of carbon dioxide. The collective belches and flatulence of all the grazing animals on Earth accounts for 20% of the methane gas released into the atmosphere.
In 2007, the IPCC predicted that Earth's surface temperatures will rise 1.8°C to 4.0°C (3.2°F to 7.2°F) during the twenty- first century. The range of the prediction for temperature increase is large due to uncertainties concerning the effects of many of the interacting factors, such as cloud cover due to evaporation, cooling effects of atmospheric particulates such as sulfates, possible increased primary productivity due to the increase in CO2, and ability of the ocean to absorb CO2.
Why is there such commotion over global warming? Why should anyone care whether the atmosphere becomes a few degrees warmer? The answer is that global warming is closely related to global climate change, which has many social and economic consequences. Let's look at the current extent of global warming and possible consequences suggested in the 2007 IPCC report.
• Melting ice caps, rising sea level, and warmer oceans. Mountain glaciers and snow cover at both poles has declined. Land-based ice sheets in Greenland and Antarctica have been melting. When ice on land melts, sea level rises. In addition, the resulting reduction of white covering on Earth means less of the sun's energy is reflected back to space. Less reflection further increases warming, which leads to increased glacier melting. During the decade from 1993 to 2003, sea level rose about 31 mm (1.22 in.), and the temperature of the oceans increased. Ocean water expands as it warms, contributing further to the rise in sea level.
The temperature change, and therefore the melting of ice sheets, is greatest in the Arctic, where it has adversely affected the food web. Because of the melted ice sheets, polar bears must swim long distances (instead of walking on the ice) to capture the seals they rely on for food. Swimming requires more energy than walking does, so polar bears are starving. As a result, polar bears are becoming an endangered species. The melting ice sheets also affect human populations. The Inuit, a native people of the North American coast, also rely on seals for food, and sea ice is dangerous to hunt on.
• Coastal cities could flood. The rising sea level would have the greatest effect on low-lying coastal countries such as Bangladesh, Egypt, Vietnam, and Mozambique. Seawater could cover significant areas in these densely populated lands. In the United States, major cities such as New York, Miami, Jacksonville, Boston, San Francisco, and Los Angeles could someday be largely underwater. Do you live near a coastline?
• Changing weather patterns. Global warming is causing changes in both temperature and rainfall patterns. This climate change is responsible for the drought-causing water shortage in the southwest United States. Most scientists agree that warmer oceans can fuel hurricanes. Hurricanes in the North Atlantic have intensified and will continue to intensify during the twenty-first century.
Recall from Chapter 23 that the distribution of climax communities, each with its characteristic plant and animal life, is largely determined by temperature and rainfall. Because of global warming, some species will thrive and others may become extinct. There will be a shift in the location of agricultural regions, meaning food production in the central plains of the United States and Canada could drop. Areas that now produce enough food for export may not be able to produce enough for the local population. Meanwhile, other regions—parts of India and Russia, for instance—might receive increased rainfall that would benefit agriculture. These changes will alter the distribution of "haves" and "have-nots." How will the world community deal with the shifts in economic and political power?
• Human health. The IPCC predicts that global warming will have various negative effects on human health. The change in climate is likely to increase the number of deaths due to heat waves, flooding, and droughts leading to starvation. Climate change could also increase air pollution. In addition, because mosquitoes and ticks, as well as other vectors of disease, would thrive in a warmer climate, we may see increases in malaria, West Nile virus encephalitis (inflammation of the brain), Lyme disease, and the like.
Stop and think
Scientists are working on a low-nitrogen diet for cattle and sheep to reduce the amount of methane these animals produce. How might such a diet affect global warming? On what factors might the outcome depend?
Carbon Footprint
A person's—or a nation's—carbon footprint is a measure of the amount of CO2 entering the atmosphere due to that person's— or nation's—daily activities. It includes the carbon emissions directly from our activities as well as those from the whole life cycle—production through waste disposal—of the products we use.
Environmental Issue
Air Pollution and Human Health
Caution: The air you breathe may be hazardous to your health. It may even kill you—especially if you have heart or respiratory problems. Two major human sources of air pollution are motor vehicle exhaust and industrial emissions. The exhaust pipes on our cars and the smokestacks on factories spew oxides of sulfur, nitrogen, and carbon; a mixture of hydrocarbons; and many particulates (such as soot and smoke) into the air. In the atmosphere, sulfur dioxide and nitrogen dioxide dissolve in water vapor and form an aerosol of strong acids—sulfuric acid and nitric acid, respectively. Some of this aerosol may drift upward, forming acidic clouds that can be blown hundreds of miles by the winds and then fall as acid rain. On the other hand, the acidic aerosol may remain close to its source as a component of the haze created by air pollution. In addition, sunlight can cause hydrocarbons and nitrogen dioxide to react with one another and form a mix of hundreds of substances called photochemical smog. The most harmful component of photochemical smog is ozone, which attacks cells and tissues, irritates the respiratory system, damages plants, and even erodes rubber. Paradoxically, the ozone that is so damaging when it is found at ground level in photochemical smog is the same compound that is beneficial in the upper layers of the atmosphere, where it prevents much of the sun's ultraviolet radiation from reaching Earth's surface. Unfortunately, the ozone found in smog does not make its way to the ozone layer of the upper atmosphere, because it is converted to oxygen within a few days.
When we breathe polluted air, the respiratory system is, not surprisingly, the first to be affected. As air containing toxic substances fills the lungs, cells lining the airways and those within the lungs are injured. Damaged cells release histamine, which causes nearby capillaries to widen and become more permeable to fluid. As a result, fluid leaks from the capillaries and accumulates within the tissues. Even a brief exposure to oxides of sulfur (5 parts per million, or ppm, for a few minutes), the oxides of nitrogen (2 ppm for 10 minutes), or ozone leads to fluid accumulation, increased mucus production, and muscle spasms (intense involuntary contractions) in the bronchioles. These effects obstruct air flow and reduce gas exchange. Long-term irritation of bronchi by pollutants is a cause of chronic bronchitis and emphysema. The process begins when irritation causes fluid accumulation that, in turn, stimulates mucus production and coughing.
The cough and mucus, signs of chronic bronchitis, irritate the lungs even more. As the bronchitis continues, the air passageways become narrower, trapping air in the lungs. When the increased pressure accompanying a cough causes the overinflated alveoli to rupture, emphysema begins.
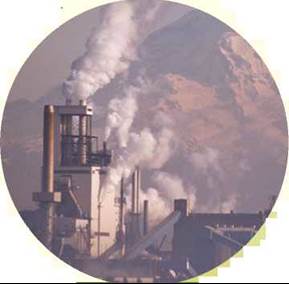
Air pollution has health, social, economic, and political consequences.
With so many documented health consequences of air pollution, you may wonder why the world's great minds haven't developed the technology to solve the problem. In fact, they have. But unfortunately, air pollution is not just a scientific problem; it is also a social, political, and economic problem. The technology to prevent air pollution is available. For example, scrubbers can remove 90% of the particulate matter and sulfur dioxide from industrial smokestacks. However, the technology is costly.
Questions to Consider
• Are you willing to pay more for goods and services, such as food, clothing, and transportation, to offset the cost of air pollution- reducing technology? How much more are you willing to pay for low-sulfur fuels, for instance?
• Some of the strategies for improving air quality are likely to impose a certain amount of inconvenience. Are you willing to carpool, take a bus, or better yet, walk instead of drive to improve the air quality in your community?
Reduction of direct carbon footprint. We have the most control over carbon emissions from our own activities. How can you reduce the size of your carbon footprint? One way is to walk, ride a bicycle, or take public transportation instead of driving. When driving is necessary, carpool with others whenever possible. When you purchase appliances, choose energy-efficient ones. Minimize the use of heating or cooling systems in your home by programming your thermostat and wearing clothing suited to the season. Turn off the lights when you leave a room, and shut down your computer after using it. In short, conserve energy. The environment will benefit; the exercise will improve your health; and you will save money.
Reduction of global carbon footprint. To reduce future climate change, the leaders of 182 nations signed an agreement, the Kyoto Protocol, to reduce CO2 emissions to pre-1990 levels through technology and reduced energy use. The Kyoto Protocol was ratified in early 2005. The United States has refused to ratify the agreement because it requires industrialized countries to reduce their emissions of greenhouse gases but does not require rapidly industrializing countries to reduce their emissions. Believing that technology can solve the problem of global warming, the United States and the European Union agreed to share information on technological advances. A United Nations conference on climate change was held in 2009 in Copenhagen, Denmark. The talks were unsuccessful, primarily for political reasons.
Whether or not you believe energy usage and the burning of fossil fuels is affecting the global climate, one thing is certain: the supply of fossil fuels is limited. Oil, coal, and natural gas are not renewable resources. When they are gone, they are gone forever. Even if you are among the skeptics about the role of greenhouse gases in climate change, you should consider some of the possible social, political, economic, and environmental consequences of continued reliance on fossil fuels (Figure 24.12). We will have to think through our choices carefully. For example, some experts tout biofuels—fuels made from recently dead biological material— as the way to reduce our dependence on oil. Other experts argue that growing crops to make biofuel is driving up the cost of food. Sugarcane is sometimes used to make biofuel. Will increased use of biofuel speed deforestation of the Amazon rain forest to make room for growing sugarcane? How much stress will irrigating plants for biofuel place on our water supplies? Residents of several states in the Midwest are going to court to challenge the development of biofuel projects in their region.
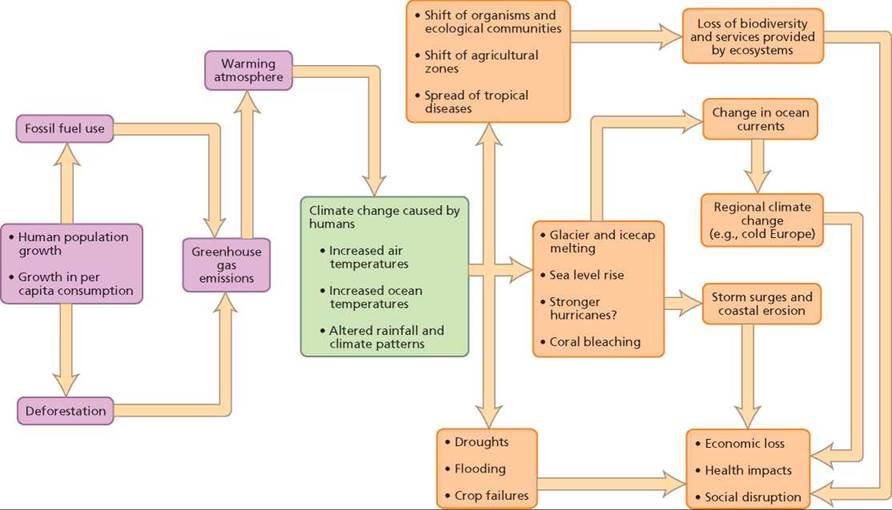
FIGURE 24.12. Global climate change (shown In the green box) Is related to human use of fossil fuels, as shown in the boxes on the left. The social and economic consequences of global climate change are shown in the boxes on the right.
Besides biofuel, what are our energy options to reduce reliance on fossil fuel? We have several choices, each best suited for different environments, each with costs and benefits.
Nuclear energy is the energy that holds protons and neutrons together in the nucleus of an atom. In nuclear power plants, we split atomic nuclei and convert the energy released to thermal energy, which we then use to create electricity. The process, called nuclear fission, does not produce greenhouse gases, and in that respect is good for environment. Mining uranium damages the environment less than mining for coal does. However, nuclear fission must be carefully controlled, and accidents have happened. In 1986, a nuclear disaster occurred at the Chernobyl Nuclear Power Plant in the Soviet Union. Approximately 600,000 people were exposed to radioactive fallout, and 57 people died as a direct result of the disaster. Another 9000 additional cancer deaths later occurred in people living within a wide radius. Accidents at nuclear power plants are extremely rare, but the results are disastrous. Another drawback to using nuclear power is the creation of radioactive waste and the problem of its disposal. Even so, today more than 400 nuclear power plants are operating in more than 30 countries.
Hydroelectric power plants use the energy of falling water to produce electricity. Hydroelectric power does not produce greenhouse gases, it is efficient, and it is renewable (as long as it rains and snows). However, damming rivers damages affected habitats—both aquatic and terrestrial.
Other renewable energy technologies are not yet able to meet our electricity needs, but they show great promise. Solar power involves harnessing the sun's energy. In windy areas, giant windmills can convert wind power to electricity. Ocean currents can also be converted to electricity. Geothermal energy deep within the Earth can be used to heat water that can, in turn, be used to generate electricity.
Looking to the Future
In many ways, our grandparents were right: older ideas were better—at least, some were. Today's economy is wasteful. Many of us behave as if the world exists for humans alone.
In Chapter 23 and this chapter, we have seen that humans are a small part of the biosphere and that it must remain healthy if we are to remain healthy. We must realize that we are subject to the same principles that govern all other life— indeed, all of Earth. Instead of trying to conquer nature, we must work with natural laws. Above all, we must recognize that Earth's resources are limited and must be shared with all living organisms as well as preserved for future generations.
This dramatic turnabout in thinking and behavior will not be easy to accomplish. It will require changing the way governments and businesses operate as well as modifying the ingrained habits of individuals. However, humans are by nature problem solvers. We now have the opportunity to approach with intelligence one of the greatest problems ever to confront humankind.
Jane Goodall, famed animal behavior researcher and founder of the Jane Goodall Institute, a center for environmental studies, is optimistic about our future. In her words, "My reasons for hope are fourfold: (1) the human brain; (2) the resilience of nature; (3) the energy and enthusiasm that is found or can be kindled among young people worldwide; and (4) the indomitable human spirit."2 We have to be optimistic that a solution is possible and then work together to achieve it.
Looking ahead
In this book, we have explored many concepts and issues. You now have the background and learning skills to make wise decisions in the future about your health and societal issues.
Highlighting the Concepts
Population Changes (pp. 508-511)
• Population dynamics describes how populations change in size. Population size changes when the number of individuals added differs from the number of individuals removed. Individuals are added through births and immigration. Individuals are removed through death and emigration.
• The change in population is usually expressed as a rate: the number of births or deaths for a certain number of individuals during a certain period (usually per 1000 individuals per year). If we rule out immigration and emigration, we can say a population's growth rate equals the birth rate minus the death rate.
• The age at which females have their first offspring is an important factor in determining a population's growth rate.
• The age structure of a population is an important determinant of future changes in population size. The age structure of a population consists of the relative numbers of individuals in each age category: prereproductive, reproductive, and postreproductive. A growing population has a large base of prereproductive individuals. A stable population has approximately equal numbers of individuals in each age category. A population that is getting smaller has a large proportion of individuals who are past reproductive age.
Patterns of Population Growth (p. 511)
• When it is not limited by finite resources, a population grows without restraint. This pattern is called exponential growth.
• The carrying capacity of the environment is the number of individuals (of a particular species) it can support over a long period of time. Carrying capacity is determined by the amount of available resources.
• Generally, as a population grows and its size approaches the carrying capacity of the environment, the growth rate slows and the population size levels off, fluctuating around the carrying capacity. This pattern is called logistic growth.
Environmental Factors and Population Size (pp. 511-512)
• Population size can be regulated by density-independent regulating factors, events such as natural disasters, whose effects are not influenced by the size of the population, and by density-dependent regulating factors, which are factors that have a greater impact as the population becomes more crowded. Density-dependent factors include food availability and disease.
Earth's Carrying Capacity (pp. 512-513)
• Humans have raised Earth's carrying capacity through technological advances, but they have also decreased it through resource depletion and pollution. The size of the human population contributes to many of the problems we face today.
Human Impacts on Earth's Carrying Capacity (pp. 513-517)
• An ecological footprint is a measure of the impact a person or population makes on the environment. It is expressed as the total amount of biological productive land and water needed to produce and dispose of the products that are consumed.
• Soil erosion due to overgrazing and overfarming is converting marginal farmlands to deserts, by a process called desertification.
• Deforestation—removing trees from an area without replacing them—is a growing problem throughout the world, especially in tropical rain forests.
• Overfishing is causing fish populations to fall below replacement levels.
• We are withdrawing more freshwater from available sources than can be replaced by precipitation.
• Pollution is making some freshwater sources unfit for human use.
• Air pollution in the form of chlorofluorocarbons (CFCs) has depleted the ozone layer in the lower atmosphere (the stratosphere). The ozone layer traps ultraviolet (UV) light, protecting life on Earth from the harmful effects of UV radiation.
Global Climate Change (pp. 517-520)
• Earth's surface temperature is getting warmer. This increase is more than 90% likely due to an increase in greenhouse gases resulting from human activities such as burning fossil fuels.
• Greenhouse gases (CO2, methane, nitrous oxides, and CFCs) trap heat in Earth's atmosphere.
• As Earth's atmosphere gets warmer, we can expect continued melting of ice caps and glaciers, rising oceans that may flood coastal cities, climate change, and human health problems related to heat and vector-borne diseases.
• A carbon footprint is the amount of CO2 entering the atmosphere due to the daily activities of an individual or group of people. We can reduce our carbon footprint by reducing our reliance on fossil fuels. Alternative fuels each have their own costs and benefits.
Looking to the Future (pp. 520-521)
• Humans are a small part of a large ecosystem. We must find ways to work within natural laws to preserve ecosystem Earth and its biodiversity.
Reviewing the Concepts
1. Define the growth rate of a population. p. 509
2. What is meant by the age structure of a population? How is a population's age structure related to predictions of its future growth? p. 510
3. Differentiate between density-independent and density- dependent regulating factors. Give examples of each. pp. 511-512
4. What is an ecological footprint? p. 513
5. What causes desertification? p. 513
6. What is the carrying capacity of the environment? pp. 513-517
7. Define deforestation. Where is it occurring most rapidly? What are the primary reasons for deforestation? p. 514
8. What determines whether ozone is helpful or harmful? What is causing the destruction of the ozone layer? pp. 516-517
9. What is meant by the term greenhouse gas? Explain why there is concern that the rising level of atmospheric carbon dioxide could lead to global warming. pp. 517-518
10. Which of the following is an example of a density-dependent regulating factor?
a. Earthquake
b. Starvation
c. Flood
d. Drought
11. If a population reaches the carrying capacity of the environment,
a. unrestrained growth will occur.
b. the population will decline rapidly.
c. food and other resources will increase.
d. the population size will fluctuate around this level.
12. The ozone layer of the atmosphere absorbs
a. carbon dioxide.
b. chlorine.
c. nitrogen dioxide.
d. ultraviolet radiation.
Applying the Concepts
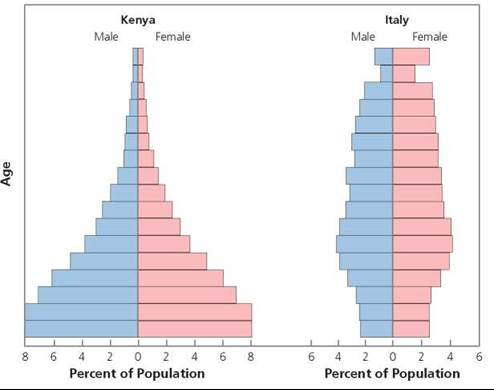
1. The populations of Kenya and Italy (shown in the figure) have approximately the same number of people, and the growth rate of the two populations is the same. Assuming that the growth rate stays the same, will the populations have the same number of people in 50 years? Explain.
2. Asian carp were introduced in 1963 to control underwater vegetation on fish farms, initially in Arkansas. A flood in 1993 allowed Asian carp to escape from the fish farms into rivers and eventually into the Mississippi River system. By 2010, Asian carp had expanded their range and were threatening to invade the Great Lakes. Asian carp are very large fish that eat plankton, which many other fresh-water fish also consume.
a. Explain why the Asian carp population was able to increase extremely rapidly in a new environment.
b. Explain why scientists are concerned that Asian carp will reduce the population size of other freshwater fish, even though the carp do not eat these other fish.
3. When soldiers returned home after World War II, many of them began having children who came to be called the baby boomers, the largest generation in United States history. Born between 1946 and 1964, the baby boomers began to turn 60 in 2006. Many will soon reach retirement age. How would you expect this change in population structure to affect how tax money will be spent?
4. Explain why population growth is usually expressed as a rate.
Becoming Information Literate
Use at least three reliable sources (journals, newspapers, books, websites) to answer the following questions. List each source you considered, and explain why you chose the three sources used.
1. Choose a body of water (river, lake, pond, or ocean) near your home. Is it polluted? If so, what are the main pollutants and their sources? If not, how has it been protected?
2. Use an online calculator to determine the size of your water footprint. Keeping your lifestyle in mind, what three steps could you take to reduce the size of your water footprint?
3. Use an online calculator to determine the size of your carbon footprint. Keeping your lifestyle in mind, what three steps could you take to reduce the size of your carbon footprint?
4. Some government leaders in the United States are advocating drilling for oil in the Arctic National Wildlife Refuge in Alaska. Some of the native people are in favor of this project. List the costs and benefits of this endeavor from economic, environmental, and social points of view.
__________________________________________________________
1 By mid-year, 2010 was on its way to becoming the hottest year on record. It also ended the hottest decade on record.
2 Jane Goodall (with Phillip Berman), Reasons for Hope: A Spiritual Journey (New York: Warner Books, 1999), 233.