THE LIVING WORLD
Unit Three. The Continuity of Life
10. Foundations of Genetics
10.3. Mendel Proposes a Theory
To explain his results, Mendel proposed a simple set of hypotheses that would faithfully predict the results he had observed. Now called Mendel’s theory of heredity, it has become one of the most famous theories in the history of science. Mendel’s theory is composed of five simple hypotheses:
Hypothesis 1: Parents do not transmit traits directly to their offspring. Rather, they transmit information about the traits, what Mendel called merkmal (the German word for “factor”). These factors act later, in the offspring, to produce the trait. In modern terminology, we call Mendel’s factors genes.
Hypothesis 2: Each parent contains two copies of the factor governing each trait. The two copies may or may not be the same. If the two copies of the factor are the same (both encoding purple or both white flowers, for example), the individual is said to be homozygous. If the two copies of the factor are different (one encoding purple, the other white, for example), the individual is said to be heterozygous.
Hypothesis 3: Alternative forms of a factor lead to alternative traits. Alternative forms of a factor are called alleles. Mendel used lowercase letters to represent recessive alleles and uppercase letters to represent dominant ones. Thus, in the case of purple flowers, the dominant purple flower allele is represented as P and the recessive white flower allele is represented as p. In modern terms, we call the appearance of an individual, such as possessing white flowers, its phenotype. Appearance is determined by which alleles of the flower-color gene the plant receives from its parents, and we call those particular alleles the individual’s genotype. Thus a pea plant might have the phenotype “white flower” and the genotype pp.
Hypothesis 4: The two alleles that an individual possesses do not affect each other, any more than two letters in a mailbox alter each other’s contents. Each allele is passed on unchanged when the individual matures and produces its own gametes (egg and sperm). At the time, Mendel did not know that his factors were carried from parent to offspring on chromosomes. Figure 10.6 shows a modern view of how genes are carried on chromosomes, with homologous chromosome carrying the same genes but not necessarily the same alleles. The location of a gene on a chromosome is called its locus (plural, loci).
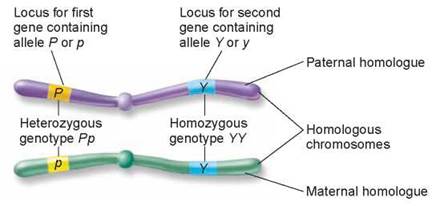
Figure 10.6. Alternative alleles of genes are located on homologous chromosomes.
Hypothesis 5: The presence of an allele does not ensure that a trait will be expressed in the individual that carries it. In heterozygous individuals, only the dominant allele achieves expression; the recessive allele is present but unexpressed.
These five hypotheses, taken together, constitute Mendel’s model of the hereditary process. Many traits in humans exhibit dominant or recessive inheritance similar to the traits Mendel studied in peas (table 10.2).
TABLE 10.2. SOME DOMINANT AND RECESSIVE TRAITS IN HUMANS
|
Recessive Traits |
Phenotypes |
Dominant Traits |
Phenotypes |
|
Common baldness |
M-shaped hairline receding with age |
Mid-digital hair |
Presence of hair on middle segment of fingers |
|
Albinism |
Lack of melanin pigmentation |
Brachydactyly |
Short fingers |
|
Alkaptonuria |
Inability to metabolize homogentisic acid |
Phenylthiocarbamide (PTC) sensitivity |
Ability to taste PTC as bitter |
|
Red-green color blindness |
Inability to distinguish red and green wavelengths of light |
Camptodactyly |
Inability to straighten the little finger |
|
Polydactyly |
Extra fingers and toes |
To analyze Mendel’s results, it is important to remember that each trait is determined by the inheritance of alleles from the parents, one allele from the mother and the other from the father. These alleles, present on chromosomes, are distributed to gametes during meiosis. Each gamete receives one copy of each chromosome, and therefore one of the alleles.
Consider again Mendel’s cross of purple-flowered with white-flowered plants. Like Mendel, we will assign the symbol P to the dominant allele, associated with the production of purple flowers, and the symbol p to the recessive allele, associated with the production of white flowers. As described earlier, by convention, genetic traits are usually assigned a letter symbol referring to their more common forms, in this case “P” for purple flower color. The dominant allele is written in uppercase, as P; the recessive allele (white flower color) is assigned the same symbol in lowercase, p.
In this system, the genotype of an individual true-breeding for the recessive white-flowered trait would be designated pp. In such an individual, both copies of the allele specify the white-flowered phenotype. Similarly, the genotype of a true-breeding purple-flowered individual would be designated PP and a heterozygote would be designated Pp (dominant allele first). Using these conventions, and denoting a cross between two strains with x, we can symbolize Mendel’s original cross as pp x PP.
Punnett Squares
The possible results from a cross between a true-breeding, white-flowered plant (pp) and a true-breeding, purple-flowered plant (PP) can be visualized with a Punnett square. In a Punnett square, the possible gametes of one individual are listed along the horizontal side of the square, while the possible gametes of the other individual are listed along the vertical side. The genotypes of potential offspring are represented by the cells within the square. Figure 10.7 walks you through the set-up of a Punnett square crossing two individual plants that are heterozygous for flower color (Pp x Pp). The genotypes of the parents are placed along the top and side and the genotypes of potential offspring appear in the cells.
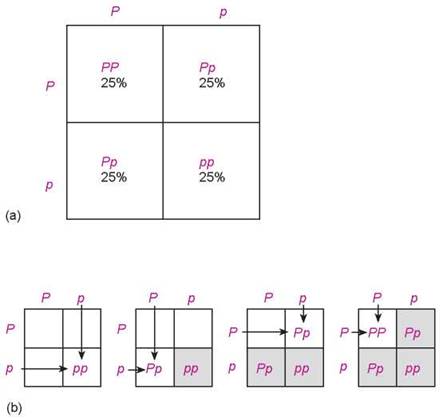
Figure 10.7. A Punnett square analysis.
(a) Each square represents 1/4 or 25% of the offspring from the cross. The squares in (b) show how the square is used to predict the genotypes of all potential offspring.
The frequency that these genotypes occur in the offspring is usually expressed by a probability. For example, in a cross between a homozygous white-flowered plant (pp) and a homozygous purple-flowered plant (PP), Pp is the only possible genotype for all individuals in the F1 generation as shown by the Punnett square on the left of figure 10.8. Because P is dominant to p, all individuals in the F1generation have purple flowers. When individuals from the F1 generation are crossed, as shown by the Punnett square on the right, the probability of obtaining a homozygous dominant (PP) individual in the F2 is 25% because one-fourth of the possible genotypes are PP Similarly, the probability of an individual in the F2 generation being homozygous recessive (pp) is 25%. Because the heterozygous genotype has two possible ways of occurring (Pp and pP), it occurs in half of the cells within the square; the probability of obtaining a heterozygous (Pp) individual in the F2 is 50% (25% + 25%).
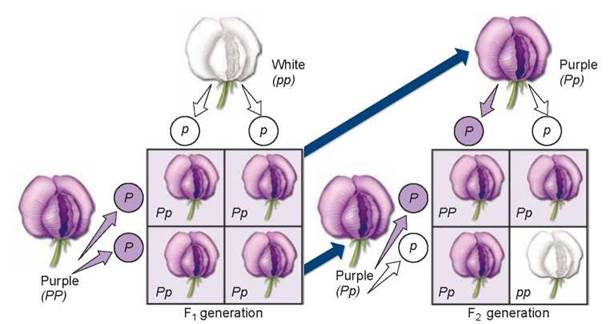
Figure 10.8. How Mendel analyzed flower color.
The only possible offspring of the first cross are Pp heterozygotes, purple in color. These individuals are known as the F1 generation. When two heterozygous F1 individuals cross, three kinds of offspring are possible: PP homozygotes (purple flowers); Pp heterozygotes (also purple flowers), which may form two ways; and pp homozygotes (white flowers). Among these individuals, known as the F2 generation, the ratio of dominant phenotype to recessive phenotype is 3:1.
The Testcross
How did Mendel know which of the purple-flowered individuals in the F2 generation (or the P generation) were homozygous (PP) and which were heterozygous (Pp)? It is not possible to tell simply by looking at them. For this reason, Mendel devised a simple and powerful procedure called the testcross to determine an individual’s actual genetic composition. Consider a purple-flowered plant. It is impossible to tell whether such a plant is homozygous or heterozygous simply by looking at its phenotype. To learn its genotype, you must cross it with some other plant. What kind of cross would provide the answer? If you cross it with a homozygous dominant individual, all of the progeny will show the dominant phenotype whether the test plant is homozygous or heterozygous. It is also difficult (but not impossible) to distinguish between the two possible test plant genotypes by crossing with a heterozygous individual. However, if you cross the test plant with a homozygous recessive individual, the two possible test plant genotypes will give totally different results. To see how this works, step through a testcross of a purple-flowered plant with a white-flowered plant. Figure 10.9 shows you the two possible alternatives:
Alternative 1 (on left): Unknown plant is homozygous (PP). PP x pp: All offspring have purple flowers (Pp) as shown by the four purple squares.
Alternative 2 (on right): Unknown plant is heterozygous (Pp). Pp x pp: One-half of offspring have white flowers (pp) and one-half have purple flowers (Pp) as shown by the two white and two purple squares.
To perform his testcross, Mendel crossed heterozygous individuals exhibiting the dominant trait back to the parent homozygous for the recessive trait. He predicted that the dominant and recessive traits would appear in a 1:1 ratio, and that is what he observed, as you can see illustrated in alternative 2 above.
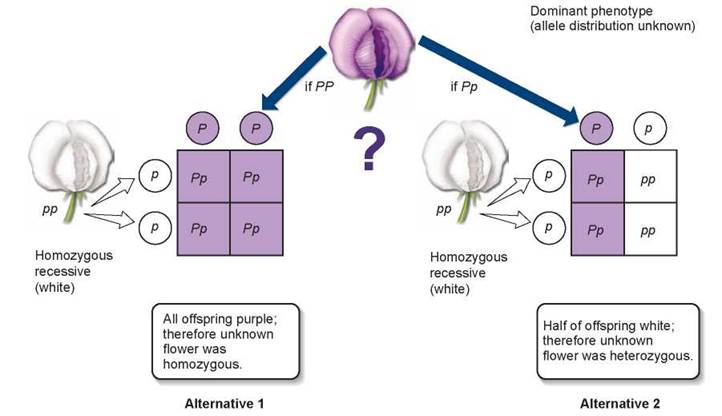
Figure 10.9. How Mendel used the testcross to detect heterozygotes.
To determine whether an individual exhibiting a dominant phenotype, such as purple flowers, was homozygous (PP) or heterozygous (Pp), Mendel devised the testcross. He crossed the individual with a known homozygous recessive (pp)—in this case, a plant with white flowers.
For each pair of alleles he investigated, Mendel observed phenotypic F2 ratios of 3:1 (see table 10.1) and testcross ratios very close to 1:1, just as his model predicted.
Testcrosses can also be used to determine the genotype of an individual when two genes are involved. Mendel carried out many two-gene crosses, some of which we will soon discuss. He often used testcrosses to verify the genotypes of particular dominant-appearing F2 individuals. Thus an F2 individual showing both dominant traits (A_ B_) might have any of the following genotypes: AABB, AaBB, AABb, or AaBb. By crossing dominant-appearing F2 individuals with homozygous recessive individuals (that is, A_ B_ x aabb), Mendel was able to determine if either or both of the traits bred true among the progeny and so determine the genotype of the F2 parent.
AABB trait A breeds true trait B breeds true
AaBB trait B breeds true
AABb trait A breeds true
AaBb
Key Learning Outcome 10.3. The genes that an individual has are referred to as its genotype; the outward appearance of the individual is referred to as its phenotype. The phenotype is determined by the alleles inherited from the parents. Analyses using Punnett squares determine all possible genotypes of a particular cross. A test cross determines the genotype of a dominant trait.