Medical Microbiology
Section 5 Diagnosis and control
32 Epidemiology and control of infectious diseases
Introduction
Epidemiology is defined as ‘The study of the distribution and determinants of health-related states or events in specified populations and the application of this study to control of health problems’ (Last, Dictionary of Epidemiology).
In epidemiology, we are concerned with populations rather than individuals. What we want to know of a disease in a population is: who, where and when. Hepatitis A outbreaks are often associated with institutions, restaurants and specific food. It is therefore important to determine who – which individuals ate potato salad, where – in a nursing home, when – 1 February 2010 – developed hepatitis A.
The field of epidemiology is divided into observational and interventional epidemiology.
Observational studies are either descriptive, describing the frequency of a disease in the population, or analytical, investigating associations between risk factors and disease. Disease surveillance describing the number of notifiable disease cases such as measles, meningitis, or cholera is an example of observational descriptive epidemiology. Studies showing an association between human papillomavirus infection and cervical cancer are examples of analytical epidemiological studies.
Interventional or experimental epidemiological studies are designed to test a hypothesis by allocating an exposure or intervention to one group of people but not the other and measuring the disease outcome. Examples of intervention studies are randomized–controlled trials investigating vaccine efficacy.
Epidemiologists talk about outcomes and exposures. The outcome is usually a disease or event such as death, infection or onset of new symptoms. Sometimes outcomes are laboratory markers, for example C-reactive protein (an acute-phase protein) or HIV viral load. These outcomes are called intermediate outcomes as they do not represent a definite endpoint. Exposures are either risk factors, for example a specific behaviour or harmful substance, or interventions such as drugs, vaccines or health education.
Outcome measurements
It is important to clearly define health-related outcomes. A definition should include the methods used to identify a case, the boundaries of a case and the unit of analysis.
Eye disease secondary to Chlamydia trachomatis (Chapter 25) is an important public health issue globally. The trachomatous inflammation is graded clinically into whether it involves follicular inflammation of the eyelid, abnormally positioned eyelashes or corneal scarring. When defining a case of trachomatous inflammation, it is important to describe (1) the methods and procedures used to determine a case: clinical examination versus direct immunofluorescence microscopy of conjunctival smear, (2) the boundaries of a case: follicular inflammation only versus all 3 grades, and (3) the unit of analysis: one or two eyes.
Disease prevalence and incidence are the two main types of measure of occurrence used in epidemiology. Prevalence is the number of existing cases in a population at a given point in time. Incidence is the number of new cases occurring in a population during a specified period of time.
Prevalence is influenced by occurrence of new cases (incidence) and the duration of each case. Prevalence of diseases with short durations such as viral gastroenteritis is mainly influenced by incidence. Prevalence of chronic diseases with relatively low mortality is likely to be high even if incidence is low. An example of the interaction between prevalence, incidence and mortality is shown in Box 32.1.
![]()
Box 32.1  Lessons in Microbiology
The interaction between prevalence, incidence, mortality and treatment
When HIV is introduced into an HIV-negative population HIV prevalence and incidence grow exponentially (Fig 32.1). As more people become infected the proportion of individuals not infected decreases. With fewer individuals susceptible to infection the likelihood that an infectious HIV-positive individual will be in contact with an HIV-uninfected individual is reduced. This in turn reduces incidence, but prevalence continues to rise. The median time of survival in the natural course of HIV disease is 6–8 years. Thus, after a time-lag, HIV mortality grows, which reduces HIV prevalence. However, if HIV treatment becomes available, survival is prolonged and prevalence grows.
![]()
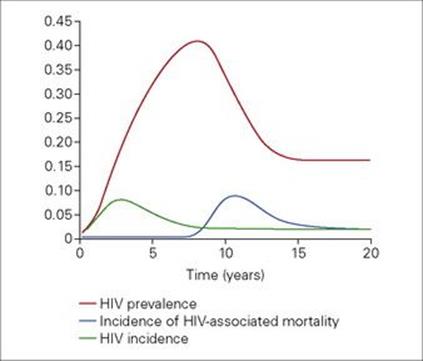
Figure 32.1 HIV prevalence, incidence and mortality in a hypothetical population. (Based on data from: Trends in HIV incidence and prevalence: natural course of the epidemic or results of behavioural change? unaids in collaboration with Wellcome Trust Centre for the Epidemiology of Infectious Disease, 1999.)
Types of epidemiological studies
Cross-sectional study
Cross-sectional studies measure the frequency of an outcome and/or exposure(s) in a defined population at a particular point in time (Fig. 32.2A). These studies can be either descriptive, measuring the burden of disease, or analytical, comparing the frequency of disease in people exposed and unexposed to a risk factor.
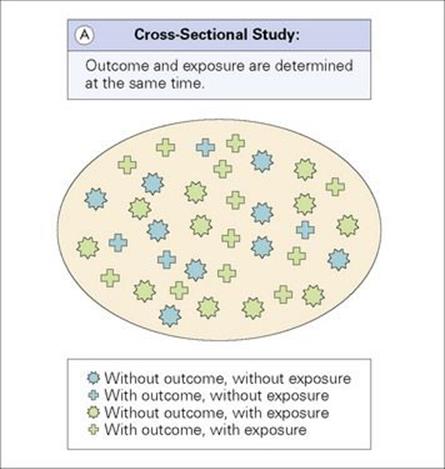
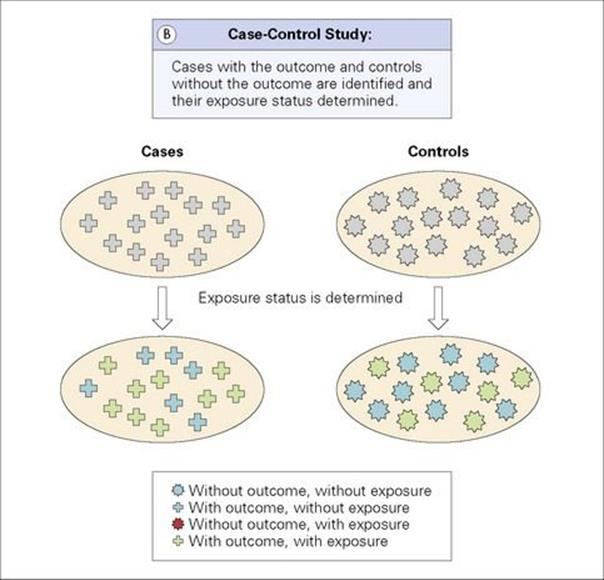
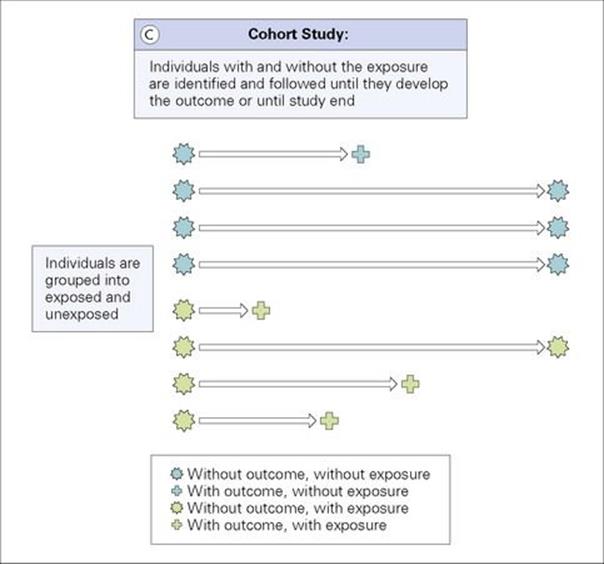
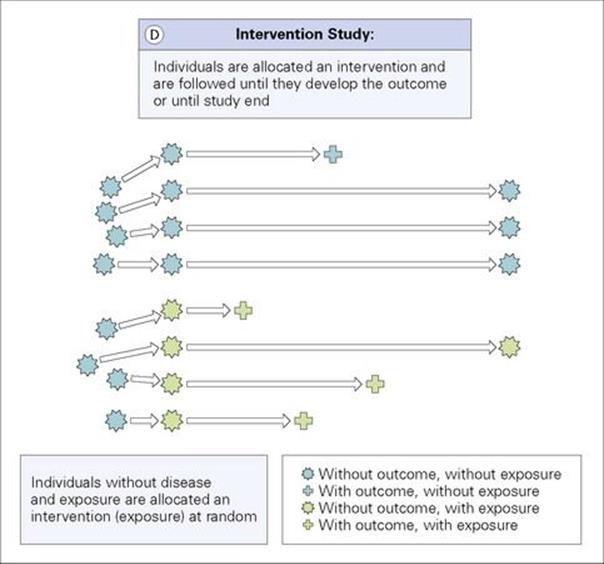
Figure 32.2 (A) Cross-sectional study: Outcome and exposure are determined at the same time. (B) Case–control study: Cases with the outcome and controls without the outcome are identified and their exposure status determined. (C) Cohort study: Individuals with and without the exposure are identified and followed until they develop the outcome or until study end. (D) Intervention study: Individuals are allocated an intervention (exposure) and are followed until they develop the outcome or until study end.
Examples of study questions addressed by cross-sectional studies are:
• What proportion of the population has evidence of a past infection with Lyme disease?
• Is hepatitis B associated with hepatocellular carcinoma?
Cross-sectional studies are relatively cheap and quick to do. They are particularly useful to determine the scale of a problem, to generate hypotheses for possibly causal associations and to evaluate diagnostic tests (Box 32.2). Cross-sectional studies measure disease prevalence. It is therefore difficult to differentiate between exposures causing the disease and improving the survival. With outcome and exposure determined at the same time, there remains uncertainty if the exposure preceded the outcome, which is a crucial requirement for causality. Sometimes it is difficult to exclude reverse causality (the outcome caused the exposure).
![]()
Box 32.2 Lessons in Microbiology
Sensitivity, specificity, positive and negative predictive value
New diagnostic tests are usually evaluated using a cross-sectional study design. The new test is compared against a gold standard test and sensitivity and specificity are determined.
Sensitivity is the proportion of true positives correctly identified by the new test and specificity is the proportion of true negatives correctly identified by the new test. Both sensitivity and specificity are intrinsic to the test and do not vary according to disease prevalence. However, they can be influenced by operators and environmental conditions.
From the patient’s and physician’s point of view, the more interesting question is, ‘What are the chances for me having the disease if I have a positive test result?’ This question is answered by the positive predictive value (PPV) which is the proportion of individuals with a positive test result who actually have the disease. The negative predictive value (NPV) is the proportion of individuals with a negative test result who are free of disease. Both PPV and NPV are related to sensitivity and specificity of a test but also to the prevalence of disease in a population.
The Xpert MTB-RIF is a new automated molecular test for diagnosis of Mycobacterium tuberculosis (Chapter 19). Diagnosis of tuberculosis (TB) relies on smear microscopy in most resource-limited settings and liquid culture in resource-rich settings. Smear microscopy has a low sensitivity and detects only patients with relatively advanced disease. Liquid culture is the gold standard of TB diagnosis, but takes days to weeks to become positive. A hypothetical evaluation study in 7000 TB suspects in a high TB prevalence setting revealed a sensitivity of the Xpert MTB-RIF of 92% and a specificity of 98% (Table 32.1A). The prevalence of TB among these 7000 TB suspects was 10%. PPV was 93% and NPV 99%.
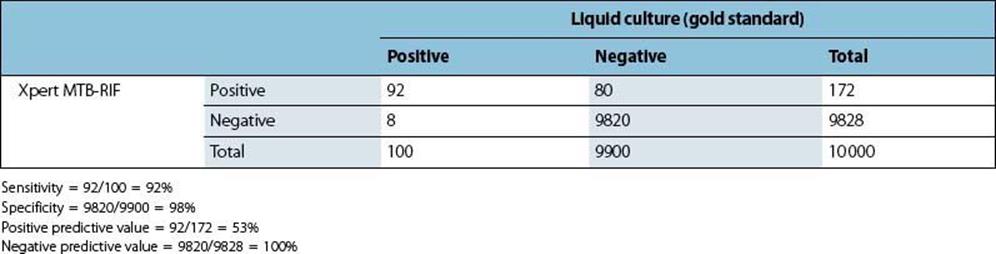
The evaluation study was repeated in a population survey with 10 000 participants, among whom TB prevalence was 1%, sensitivity and specificity remained the same, but PPV was 53% and NPV 100% (Table 32.1B).
![]()
Table 32.1A Results of the Xpert MTB-RIF evaluation among tuberculosis suspects
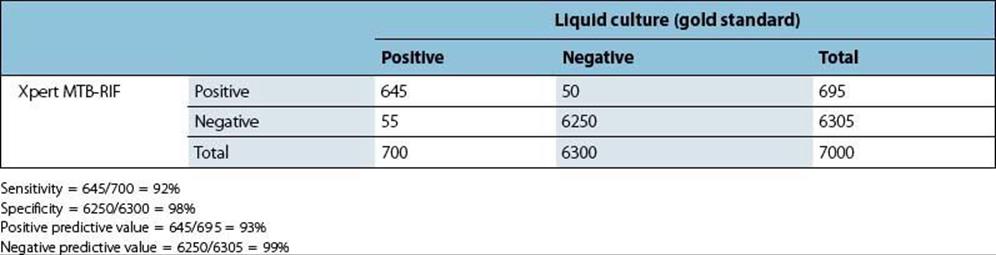
Table 32.1B Results of the Xpert MTB-RIF evaluation in a population survey
Case–control study
Case–control studies identify people with the outcome (cases) and a representative group of people without the outcome (controls). Cases and controls are then compared with regards to differences in their past exposure (Fig. 32.2B). These studies are always analytical studies, as they ask the question, ‘Does exposure A cause disease B?’
Examples of study questions addressed by case–control studies are:
• Are women with cervical cancer more likely to be infected with human papillomavirus than women without cervical cancer?
• Is injecting drug use associated with hepatitis C?
Case–control studies are usually less expensive and time-consuming than cohort or intervention studies. Rare diseases and diseases with long duration between exposure and outcome are best investigated using a case–control design, as case–control studies start with diseased and non-diseased individuals. However, when the exposure is rare, case–control studies are impractical. Unbiased ascertainment of exposure is often difficult, especially when it relies on the participant to self-report. Neither disease prevalence nor incidence is measured in a case–control study. Exposure is determined when the outcome has occurred and thus reverse causality might be the reason for an association between an exposure and disease.
Cohort study
Cohort studies follow a group of people who do not initially have the outcome of interest and determine whether they develop the disease (descriptive cohort study). Analytic cohort studies classify people at the start of the study as exposed or unexposed to a certain risk factor. Both groups are followed over time and the occurrence of disease is compared between the exposed and unexposed group (Fig. 32.2C).
Examples of study questions addressed by cohort studies are:
• How high is the mortality among patients with methicillin-resistant Staphylococcus aureus septicaemia?
• Does infection with human herpesvirus-8 cause Kaposi sarcoma in HIV-infected individuals?
Cohort studies measure disease incidence and ascertain risk factors before the outcome occurred. Thus they provide more robust evidence that an association between disease and exposure is causal. As cohort studies select disease-free exposed and unexposed individuals they are particularly useful to investigate associations between rare exposures and disease, but are inefficient when investigating rare diseases. Minimizing loss to follow-up is sometimes challenging, but important to ensure comparability between exposure groups and generalizability of study results. Cohort studies are often expensive in terms of the costs and manpower needed, as well as time consuming.
Intervention study
In an intervention study, disease-free and exposure-free individuals are actively allocated an exposure (intervention) or no exposure (no intervention). The two groups are then followed over a period of time and the frequency of the outcome is compared between the two groups (Fig. 32.2D). Randomized–controlled studies are a subtype of intervention studies and are considered the ‘gold standard’ type of study because, when rigorously designed and conducted, they provide very strong evidence of causal associations. The intervention is allocated at random which means that every participant has the same chance of receiving the intervention. This ensures that the group receiving the intervention and the group not receiving the intervention are equally balanced and comparable. The control group often receives a placebo, which is a tablet or injection containing no active compounds. Some intervention studies are double-blinded which means that neither investigator nor participant knows who receives the active intervention and who receives the placebo.
Examples of study questions addressed by intervention studies are:
• Is a new vaccine effective in preventing pneumococcal disease in children?
• Do steroids improve the outcome in children with meningococcal disease?
Randomised, placebo-controlled, double-blinded studies potentially deal with most problems experienced in observational studies: confounding, recall and observer bias. Confounding occurs when there is unequal distribution of a risk factor between exposed and unexposed individuals and thus the observed association between exposure and disease is due to a third factor. Recall bias is a systematic error which occurs when the way a participant answers a question is affected by either the disease status (in case–control or cross-sectional studies) or the exposure status (cohort studies). Observer bias arises when the accuracy of exposure (in case–control or cross-sectional studies) or outcome (cohort studies) data recorded by the investigator differs systematically between subjects in different outcome or exposure groups. Outcome data are determined prospectively in intervention studies and thus standard case definitions can be applied. Intervention studies may be expensive and time consuming and loss to follow-up can be challenging. Large sample sizes or long follow-up may be needed if disease incidence is low or duration between exposure and disease is long. Allocation of a harmful exposure or withholding of a beneficial intervention is unethical and thus intervention studies cannot be conducted under these circumstances.
Transmission of infectious disease
An infectious disease is transmitted from one person to another either directly or indirectly. Indirect transmission occurs when the infectious agent is transferred from one person to another via an intermediary (e.g. vector or vehicle). The occurrence of a case depends on the occurrence of at least one previous case (source) and each case can itself lead to another case. Disease events in infectious diseases are dependent. We therefore need to investigate the spread of infectious diseases through a population over time (Fig. 32.3).
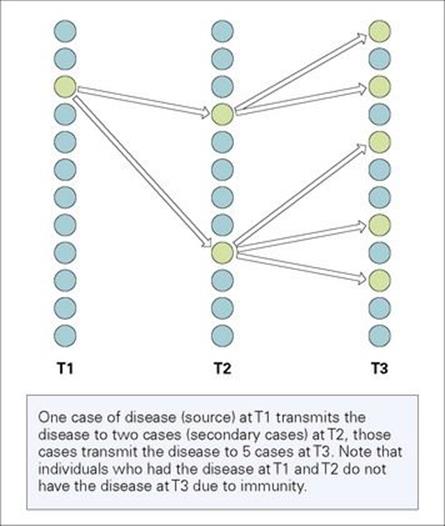
Figure 32.3 Transmission of an infectious disease in a population. One case of disease (source) at T1 transmits the disease to two cases (secondary cases) at T2; those cases transmit the disease to 5 cases at T3. Note that individuals who had the disease at T1 and T2 do not have the disease at T3 due to immunity.
Infectiousness (Box 32.3)
The infectiousness of a disease in a population depends on several factors:
• the infectious agent:
• time between infection of a person and becoming infectious
• duration of infectiousness
• the probability of transmission given a contact between an infectious person and a susceptible person
• the environment:
• the type of contacts between infectious and susceptible individuals
• the number of contacts
• the characteristics of the individuals in the population:
• susceptibility of the population (number of susceptible individuals and degree of susceptibility)
• infectiousness of the infected person.
![]()
Box 32.3 Lessons in Microbiology
Infectiousness – example syphilis
An individual infected with syphilis develops a painless very infectious sore (chancre) at the site of infection on average 3 weeks following infection. The lesion may persists for 3–6 weeks. The individual cannot transmit the infection before the chancre develops. Thus the duration between infection and becoming infectious is important for transmission. The likelihood of transmitting the infection is increased the more frequent the individual has sexual intercourse and the longer the lesion persists (if the frequency of intercourse remains constant). Therefore the duration of infectiousness and the number of contacts influence transmission. The probability of transmission is reduced if the individual uses condoms.
![]()
Time periods of infections
When a susceptible individual becomes infected, he or she enters the latent period (Fig 32.4, Box 32.4). The latent period is the period between infection and becoming infectious (able to transmit the infection). This period is followed by the infectious period during which the infected individual is able to transmit the infectious agent. This is followed by the non-infectious period due to death or recovery. If the individual survives, he or she might be immune or remain susceptible to reinfection.
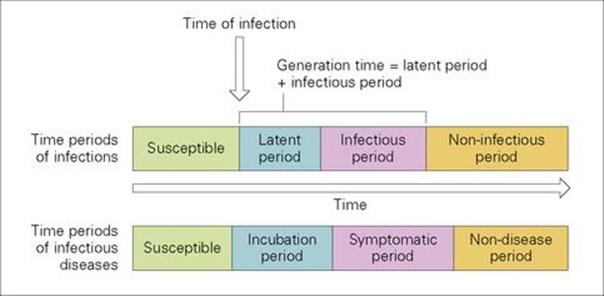
Figure 32.4 Time periods of infections and infectious diseases.
![]()
Box 32.4 Lessons in Microbiology
Terminology: latency
In general, latency is a time delay. The term is frequently used in infectious disease terminology. Strictly speaking, the latent period is the time from infection until the infected individual is able to transmit the disease. However, sometimes the incubation period is called the latent period even though the two periods are differently defined and might differ in duration. A child infected with measles becomes infectious before symptoms occur. Thus the latent period is shorter than the incubation period. In contrast, an individual infected with falciparum malaria will experience symptoms 7–14 days following infection, but will only be infectious after 24 days. Sometimes, disease stages are called latent, such as latent tuberculosis or syphilis. Latent disease in that context describes periods of inactivity of the disease with regards to signs and symptoms.
![]()
The sum of the average latent and infectious periods is called the average generation time of the infection.
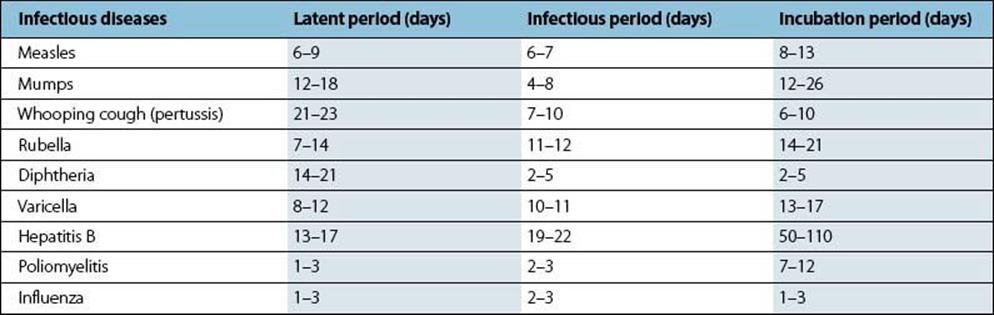
Latent and infectious periods are different for different diseases (Table 32.2). For measles the latent period is 6–9 days followed by an infectious period of 6–7 days. In contrast the latent period of hepatitis B is 13–17 days and the infectious period 19–22 days.
Table 32.2 Latent, infectious and incubation periods for a variety of viral and bacterial infections
Time periods of infectious disease
Not all infected individuals will develop the disease. Disease and infection differ with regards to symptoms and clinical signs. Infected individuals without symptoms and signs have asymptomatic infections. For some infectious agents such as cytomegalovirus the majority of infections will be asymptomatic.
The incubation period starts with the time of infection and ends when the individual develops symptoms (Fig. 32.4). It is followed by the symptomatic period. The symptomatic period ends with death or recovery.
The incubation period is 8–13 days and 50–110 days for measles and hepatitis B, respectively. Thus an individual infected with measles is infectious before developing symptoms, as persons become infectious after 6–9 days. Therefore isolation at the time of symptoms will not prevent transmission.
Basic and net reproductive rate
The basic reproductive rate (R0) is the average number of infected secondary cases produced by each infectious case in a totally susceptible population.
Disease incidence:
• is static if each case leads to one new case (R0 = 1)
• increases if each case leads to more than one infective secondary case (R0 > 1)
• decreases if each case leads to less than one infective secondary case (R0 < 1), which will result in disease control and eradication.
The basic reproductive rate depends on the duration of infectiousness of the case (d), the number of contacts per unit time (c) and the transmission probability (p): R0 = c * p * d. This formula shows that the basic reproductive rate is not specific to an infectious agent only, but also to a specific host population at a particular point in time. R0 for HIV is different for women, men and commercial sex workers. Table 32.3 shows basic reproductive rates for different diseases. Measles has a very high basic reproductive rate of 15–17, whereas influenza has a basic reproductive rate of 2–3.
Table 32.3 Basic reproductive rate for a variety of infectious diseases
|
Infectious disease |
Basic reproductive rate (R0) |
|
Measles |
15–17 |
|
Mumps |
10–12 |
|
Whooping cough (pertussis) |
15–17 |
|
Rubella |
7–8 |
|
Diphtheria |
5–6 |
|
Poliomyelitis |
5–6 |
|
Influenza |
2–3 |
A completely susceptible population is unusual. More commonly, a population consists of susceptible and immune individuals. The net reproductive rate (R) is the average number of secondary cases in a population where not all individuals are susceptible. The net reproductive rate depends on the basic reproductive rate (R0) and the proportion of susceptible individuals (x): R = R0 * x. The lower the proportion of susceptible individuals in a population, the lower the probability that an infectious individual will be in contact with a susceptible individual. Thus, if the proportion of susceptibles (x) is small enough, R will be less than 1 and the disease will be eradicated. The proportion of the population immune to an infection is called herd immunity (HI): HI = 1-x. The herd immunity threshold is the proportion of the population that need to be immune in order for a disease to die out (R < 1): HIT = R0-1/R0. Susceptible individuals become immune once they are vaccinated with a highly effective vaccine. The basic reproductive rate allows us to estimate the vaccination coverage which needs to be achieved in order to control an infectious disease. The critical vaccination coverage needs to be very high (92–95%) for measles due to the high reproductive rate (15–17). Rubella has a lower reproductive number (7–8) and thus for disease control vaccination coverage needs to be only 85–87%.
Vaccine efficacy
Vaccines protect individuals directly by making them less susceptible (more immune) to the disease. They also protect individuals indirectly (even individuals who did not receive the vaccine) through increased herd immunity.
Vaccine efficacy is the most commonly used measure of effect when evaluating vaccines and is often determined in randomized, controlled trials. Vaccine efficacy is the reduction in the incidence of disease in vaccinated individuals compared to unvaccinated individuals:
Vaccine efficacy = (incidence of disease in unvaccinated individuals − incidence of disease in vaccinated individuals)/incidence of disease in unvaccinated individuals. Thus vaccine efficacy only measures the direct effect of the vaccine. Measurement of the indirect effect of vaccines requires more complex study designs.
![]()
 Key facts
• Epidemiological studies can be observational or interventional.
• Prevalence is the number of existing cases in a population at a given point in time. Incidence is the number of new cases occurring in a population during a specified period of time.
• Infectiousness depends on the infectious agent itself, the environment, and the characteristics of the individuals in the population, such as whether they are immune or susceptible.
• Infections can also be characterized by the latent period, the infectious period, the incubation period and the symptomatic period: individuals can become infectious before they develop symptoms.
• Vaccine efficacy is the reduction in the incidence of disease in vaccinated individuals compared to unvaccinated individuals. When a significant proportion of the community is protected by vaccination, unvaccinated individuals are also less likely to acquire disease; this is called herd immunity.
![]()