Cracking the AP Chemistry Exam
Part IV
Content Review for the AP Chemistry Exam
Chapter 5
Big Idea #3: Chemical Reactions, Energy Changes, and Redox Reactions
ENERGY DIAGRAMS
Exothermic and Endothermic Reactions
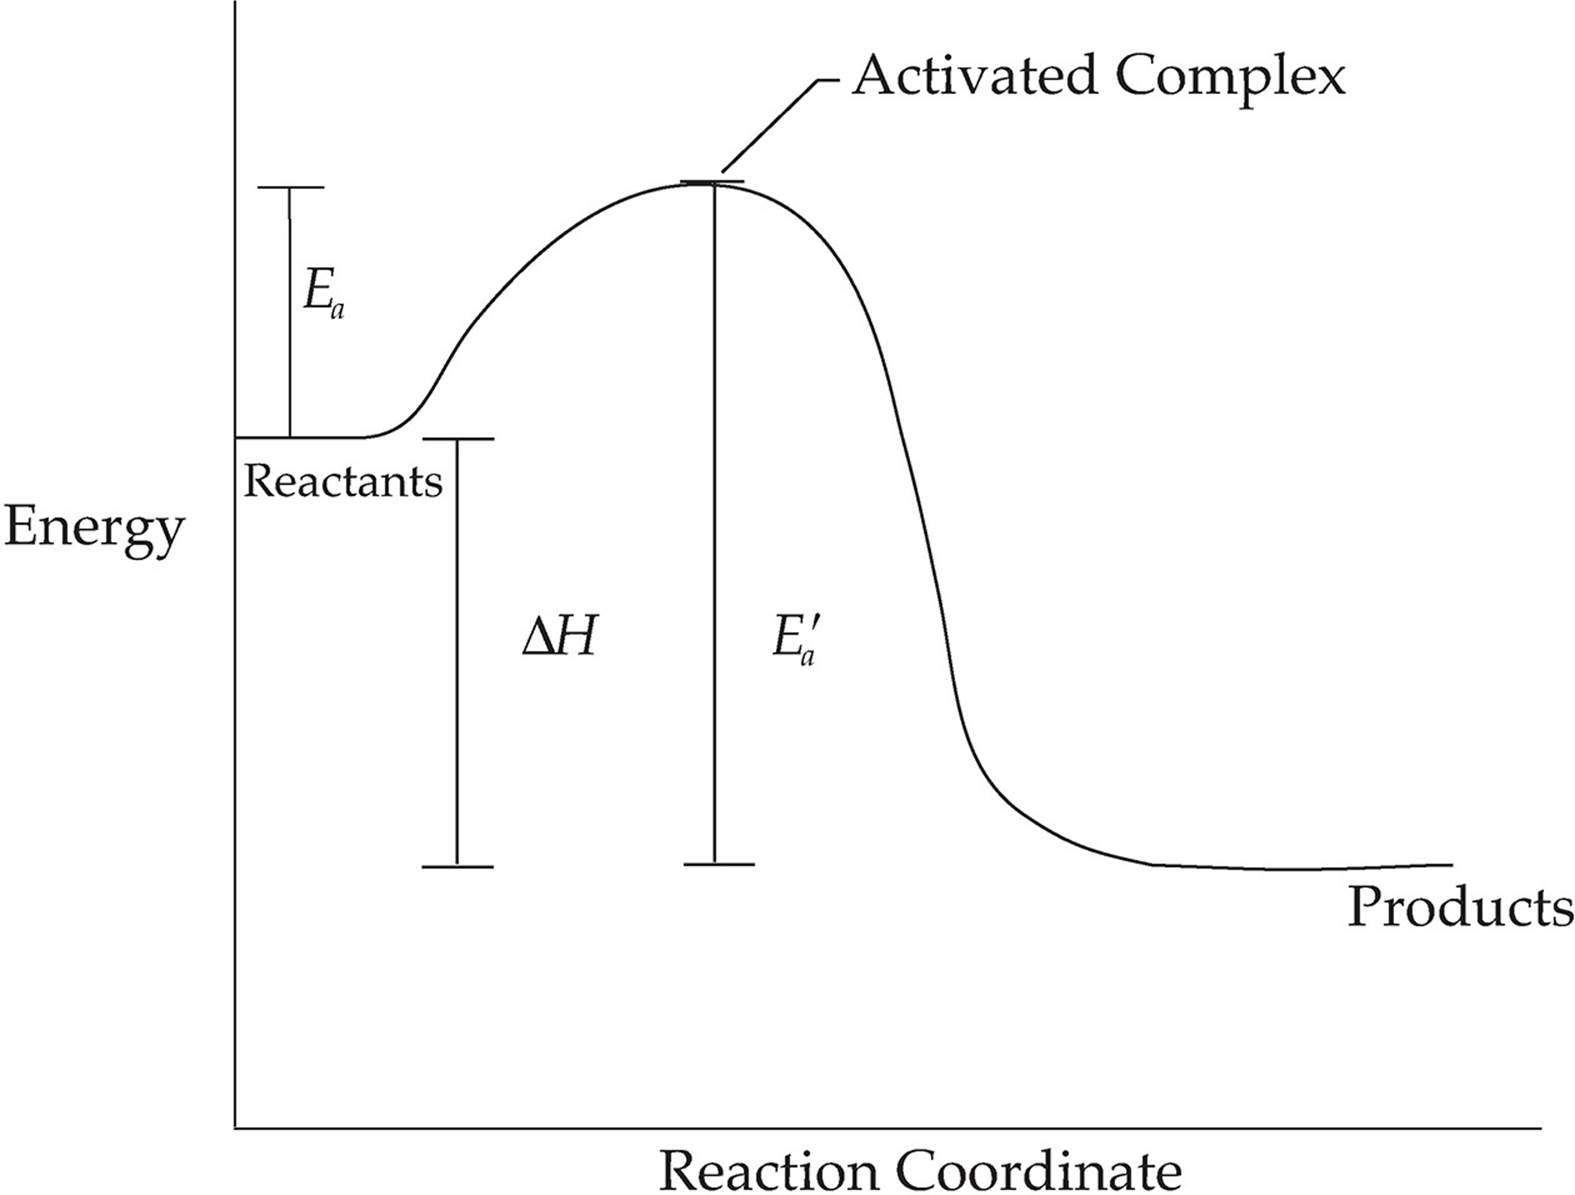
EXOTHERMIC REACTION
The diagram above shows the energy change that takes place during an exothermic reaction. The reactants start with a certain amount of energy (read the graph from left to right). For the reaction to proceed, the reactants must have enough energy to reach the transition state, where they are part of an activated complex. This is the highest point on the graph above. The amount of energy needed to reach this point is called the activation energy, Ea. At this point, all reactant bonds have been broken, but no product bonds have been formed, so this is the point in the reaction with the highest energy and lowest stability. The energy needed for the reverse reaction is shown as line Eaʹ.
Moving to the right past the activated complex, product bonds start to form, and we eventually reach the energy level of the products.
This diagram represents an exothermic reaction, so the products are at a lower energy level than the reactants and ∆H is negative.
The following diagram shows an endothermic reaction.
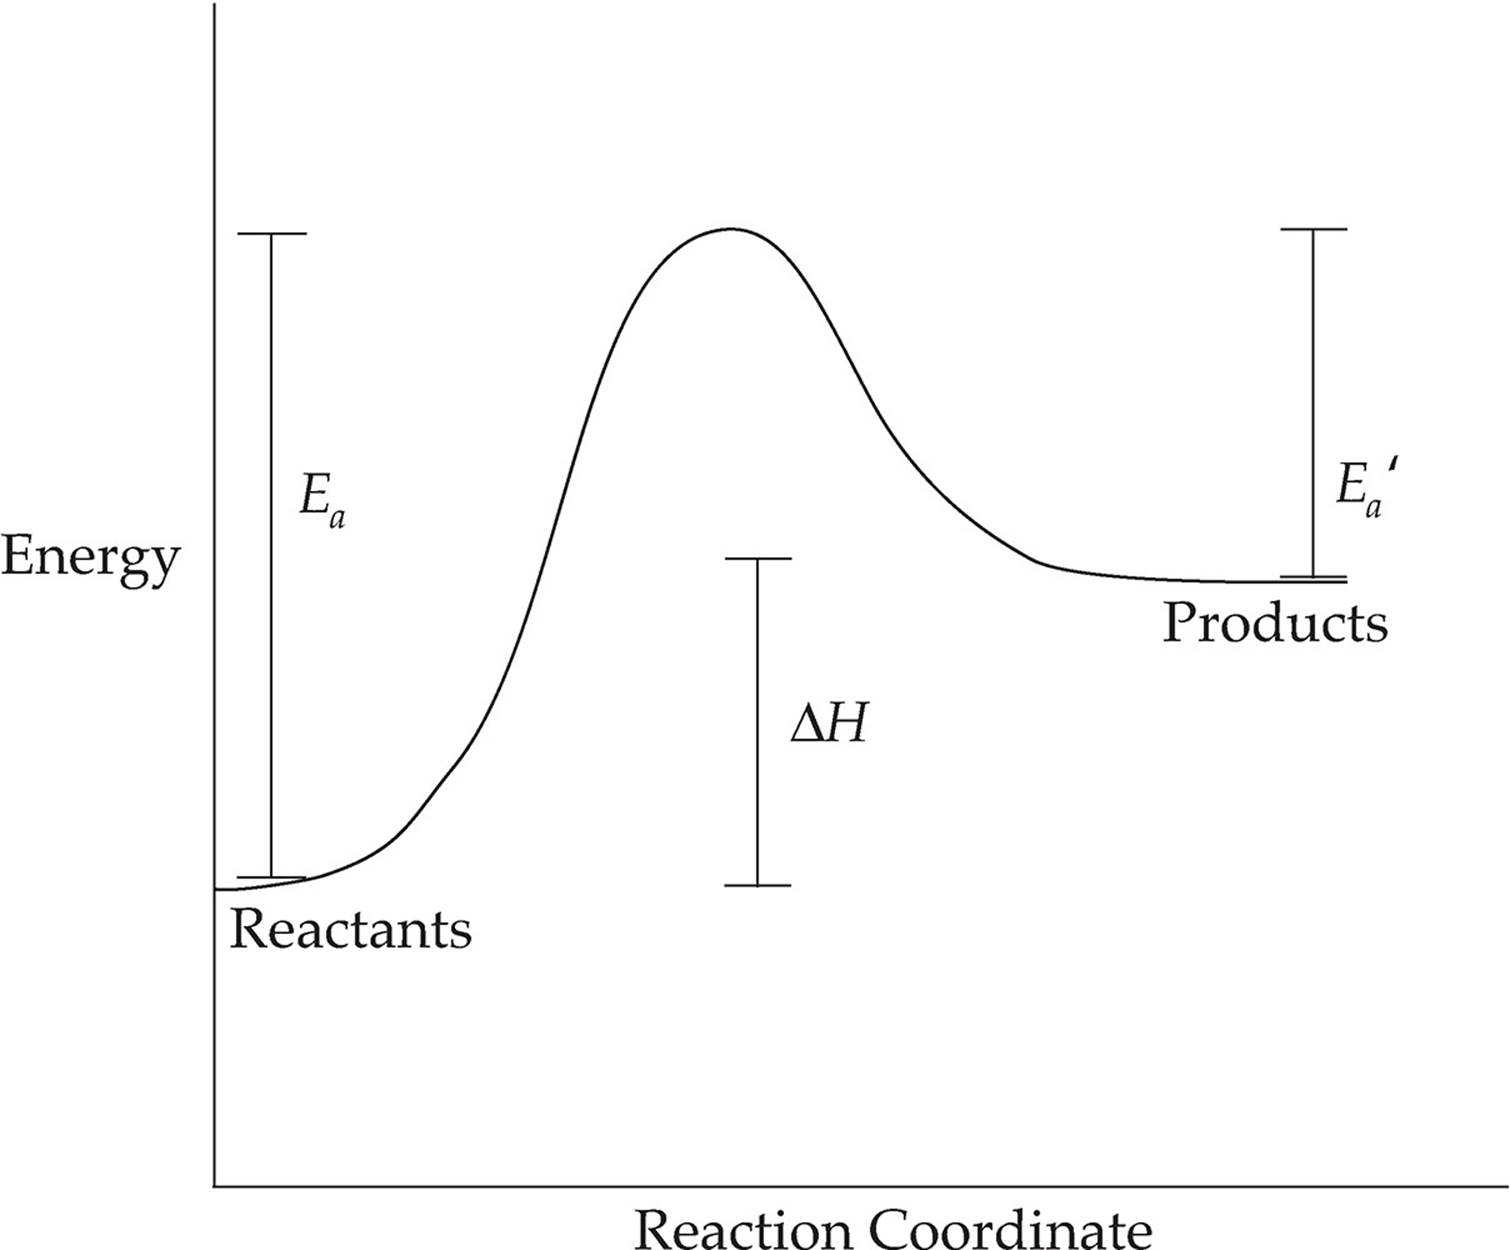
ENDOTHERMIC REACTION
In this diagram, the energy of the products is greater than the energy of the reactants, so ∆H is positive.
Reaction diagrams can be read in both directions, so the reverse reaction for an exothermic reaction is endothermic and vice versa.