Lippincott’s Illustrated Reviews: Biochemistr, Sixth Edition (2014)
UNIT V: Integration of Metabolism
Chapter 25. Diabetes Mellitus
I. OVERVIEW OF DIABETES MELLITUS
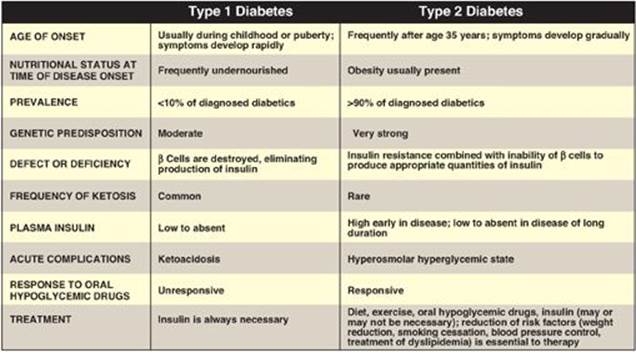
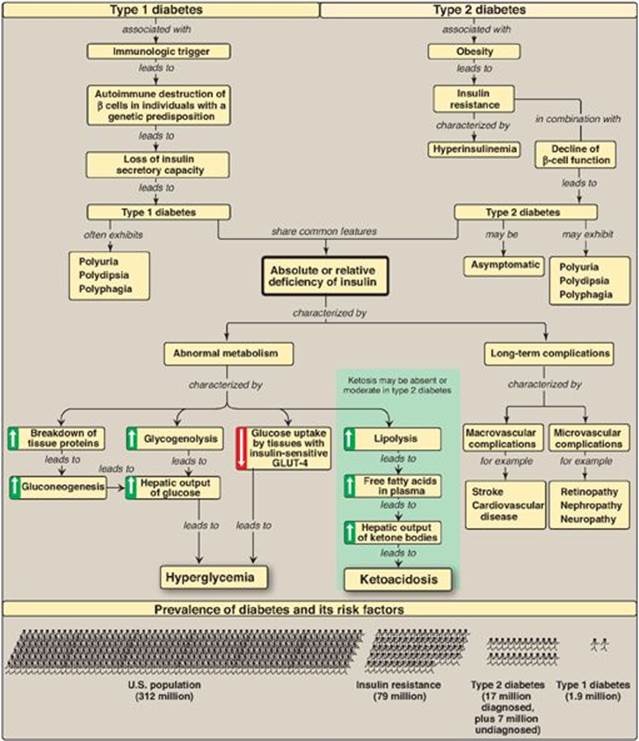
Diabetes mellitus (“diabetes”) is not one disease, but rather is a heterogeneous group of multifactorial, polygenic syndromes characterized by an elevated fasting blood glucose (FBG) caused by a relative or absolute deficiency in insulin. Nearly 26 million people in the United States (about 8% of the population) have diabetes. Of this number, approximately 7 million are as yet undiagnosed. Diabetes is the leading cause of adult blindness and amputation and a major cause of renal failure, nerve damage, heart attacks, and strokes. Most cases of diabetes mellitus can be separated into two groups (Figure 25.1), type 1 ([T1D] formerly called insulin-dependent diabetes mellitus) and type 2 ([T2D] formerly called noninsulin-dependent diabetes mellitus). The incidence and prevalence of T2D is increasing because of the aging of the U.S. population and the increasing prevalence of obesity and sedentary lifestyles (see p. 349). The increase in children with T2D is particularly disturbing.
Figure 25.1 Comparison of type 1 and type 2 diabetes mellitus. [Note: The name of the disease reflects the clinical presentation of copious amounts of glucose-containing urine and is derived from the Greek word for siphon (diabetes) and the Latin word for honey-sweet (mellitus).]
II. TYPE 1 DIABETES
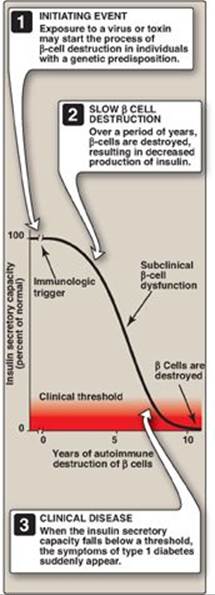
Persons with T1D constitute less than 10% of the nearly 20 million known diabetics in the United States. The disease is characterized by an absolute deficiency of insulin caused by an autoimmune attack on the β cells of the pancreas. In T1D, the islets of Langerhans become infiltrated with activated T lymphocytes, leading to a condition called insulitis. Over a period of years, this autoimmune attack on the β cells leads to gradual depletion of the β-cell population (Figure 25.2). However, symptoms appear abruptly when 80%–90% of the β cells have been destroyed. At this point, the pancreas fails to respond adequately to ingestion of glucose, and insulin therapy is required to restore metabolic control and prevent life-threatening ketoacidosis. β-Cell destruction requires both a stimulus from the environment (such as a viral infection) and a genetic determinant that allows the β cells to be recognized as “nonself.” [Note: Among monozygotic (identical) twins, if one sibling develops T1D, the other twin has only a 30%–50% chance of developing the disease. This contrasts with T2D (see p. 341), in which the genetic influence is stronger and, in virtually all monozygotic twinships, the disease eventually develops in both individuals.]
Figure 25.2 Insulin secretory capacity during onset of type 1 diabetes. [Note: Rate of autoimmune destruction of β cells may be faster or slower than shown.]
A. Diagnosis of type 1 diabetes
The onset of T1D is typically during childhood or puberty, and symptoms develop suddenly. Patients with T1D can usually be recognized by the abrupt appearance of polyuria (frequent urination), polydipsia (excessive thirst), and polyphagia (excessive hunger), often triggered by physiologic stress such as an illness. These symptoms are usually accompanied by fatigue and weight loss. The diagnosis is confirmed by a glycosylated hemoglobin (see p. 340) concentration ≥ 6.5 mg/dl (normal is less than 5.7), or a FBG ≥ 126 mg/dl (normal is 70–99). [Note: A FBG of 100–125 mg/dl is categorized as an impaired FBG. Individuals with impaired FBG are considered “prediabetic” and are at increased risk for developing T2D.] Fasting is defined as no caloric intake for at least 8 hours. Diagnosis can also be made on the basis of a nonfasting (random) blood glucose level greater than 200 mg/dl in an individual with symptoms of hyperglycemia. [Note: The oral glucose tolerance test, in which blood glucose is measured 2 hours after ingestion of a solution containing 75 g of glucose, also is used but is less convenient. It is most typically used to identify pregnant women with gestational diabetes (see p. 342).]
When blood glucose is greater than 180 mg/dl, the ability of the kidneys to reclaim glucose is impaired. This results in glucose “spilling” into the urine. The loss of glucose is accompanied by the loss of water, resulting in the characteristic polyuria (with dehydration) and polydipsia of diabetes.
B. Metabolic changes in type 1 diabetes
The metabolic abnormalities of T1D mellitus result from a deficiency of insulin that profoundly affects metabolism in three tissues: liver, muscle, and adipose (Figure 25.3).
Figure 25.3 Intertissue relationships in type 1 diabetes. TCA = tricarboxylic acid; CoA = coenzyme A; VLDLs = very-low-density lipoproteins; GLUT = glucose transporter.
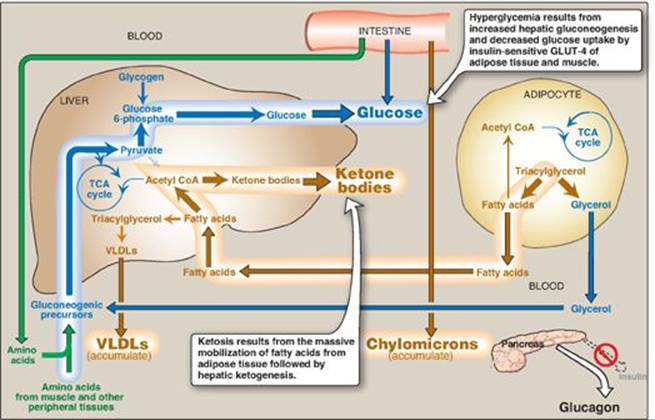
1. Hyperglycemia and ketoacidosis: Elevated levels of blood glucose and ketone bodies are the hallmarks of untreated T1D (see Figure 25.3). Hyperglycemia is caused by increased hepatic production of glucose via gluconeogenesis, combined with diminished peripheral utilization (muscle and adipose tissue have the insulin-sensitive glucose transporter GLUT-4; see p. 97). Ketosis results from increased mobilization of fatty acids (FAs) from adipose tissue, combined with accelerated hepatic FA β-oxidation and synthesis of 3-hydroxybutyrate and acetoacetate. [Note: Acetyl coenzyme A from β-oxidation is the substrate for ketogenesis and the allosteric activator of pyruvate carboxylase, a gluconeogenic enzyme.] Diabetic ketoacidosis (DKA), a type of metabolic acidosis, occurs in 25%–40% of those newly diagnosed with T1D and may recur if the patient becomes ill (most commonly with an infection) or does not comply with therapy. DKA is treated by replacing fluid and electrolytes and administering short-acting insulin to gradually correct hyperglycemia without precipitating hypoglycemia.
2. Hypertriacylglycerolemia: Not all of the FAs flooding the liver can be disposed of through oxidation or ketone body synthesis. These excess fatty acids are converted to triacylglycerol (TAG), which is packaged and secreted in very-low-density lipoproteins ([VLDLs] see p. 231). Chylomicrons are synthesized from dietary lipids by the intestinal mucosal cells following a meal (see p. 178). Because lipoprotein degradation catalyzed by lipoprotein lipase in the capillary beds of adipose tissue (see. p. 228) is low in diabetics (synthesis of the enzyme is decreased when insulin levels are low), the plasma chylomicron and VLDL levels are elevated, resulting in hypertriacylglycerolemia (see Figure 25.3).
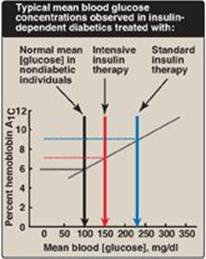
Figure 25.4 Correlation between mean blood glucose and hemoglobin A1C in patients with type 1 diabetes.
C. Treatment of type 1 diabetes
Individuals with T1D must rely on exogenous insulin delivered subcutaneously either by periodic injection or continuous pump-assisted infusion to control the hyperglycemia and ketoacidosis. Two therapeutic regimens are currently in use, standard and intensive insulin treatment.
1. Standard treatment versus intensive treatment: Standard treatment typically consists of one or two daily injections of recombinant human insulin. Mean blood glucose levels obtained are typically in the 225–275 mg/dl range, with a glycosylated hemoglobin (HbA1c) level (see p. 34) of 8%–9% of the total hemoglobin (blue arrow in Figure 25.4). [Note: The rate of formation of HbA1c is proportional to the average blood glucose concentration over the previous 3 months. Thus, HbA1c provides a measure of how well treatment has normalized blood glucose in the diabetic patient over that time.] In contrast to standard therapy, intensive treatment seeks to more closely normalize blood glucose through more frequent monitoring and subsequent injections of insulin, typically three or more times a day. Mean blood glucose levels of 150 mg/dl can be achieved, with HbA1c approximately 7% of the total hemoglobin (see red arrow in Figure 25.4). [Note: Normal mean blood glucose is approximately 100 mg/dl, and HbA1c is 6% or less (see black arrow in Figure 25.4).] Therefore, normalization of glucose values (euglycemia) is not achieved even in intensively treated patients. Nonetheless, patients on intensive therapy show a 50% or more reduction in the long-term microvascular complications of diabetes (that is, retinopathy, nephropathy, and neuropathy) compared with patients receiving standard care. This confirms that the complications of diabetes are related to an elevation of plasma glucose.
Figure 25.5 Effect of tight glucose control on hypoglycemic episodes in a population of patients on intensive therapy or conventional therapy.
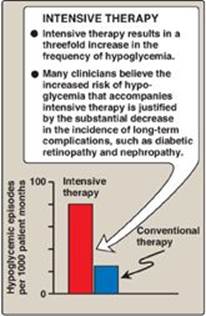
2. Hypoglycemia in type 1 diabetes: One of the therapeutic goals in cases of diabetes is to decrease blood glucose levels in an effort to minimize the development of long-term complications of the disease (see p. 344 for a discussion of the chronic complications of diabetes). However, appropriate dosage of insulin is difficult to achieve. Hypoglycemia caused by excess insulin is the most common complication of insulin therapy, occurring in over 90% of patients. The frequency of hypoglycemic episodes, coma, and seizures is particularly high with intensive treatment regimens designed to achieve tight control of blood glucose (Figure 25.5). Recall that in normal individuals, hypoglycemia triggers a compensatory secretion of counterregulatory hormones, most notably glucagon and epinephrine, which promote hepatic production of glucose. However, patients with T1D also develop a deficiency of glucagon secretion. This defect occurs early in the disease and is almost universally present 4 years after diagnosis. These patients, therefore, rely on epinephrine secretion to prevent severe hypoglycemia. However, as the disease progresses, T1D patients show diabetic autonomic neuropathy and impaired ability to secrete epinephrine in response to hypoglycemia. The combined deficiency of glucagon and epinephrine secretion creates a symptom-free condition sometimes called “hypoglycemia unawareness.” Thus, patients with long-standing T1D are particularly vulnerable to hypoglycemia. Hypoglycemia can also be caused by strenuous exercise. Exercise promotes glucose uptake into muscle and decreases the need for exogenous insulin. Patients are advised, therefore, to check blood glucose levels before or after intensive exercise to prevent or abort hypoglycemia.
3. Contraindications for tight control: Children are not put on a program of tight control of blood glucose before age 8 years because of the risk that episodes of hypoglycemia may adversely affect brain development. Elderly people typically do not go on tight control because hypoglycemia can cause strokes and heart attacks in this population. Also, the major goal of tight control is to prevent complications many years later. Tight control, then, is most worthwhile for otherwise healthy people who can expect to live at least 10 more years. [Note: For most nonpregnant adults with diabetes, the individual treatment strategies and goals are based on the duration of diabetes, age/life expectancy, and known comorbid conditions.]
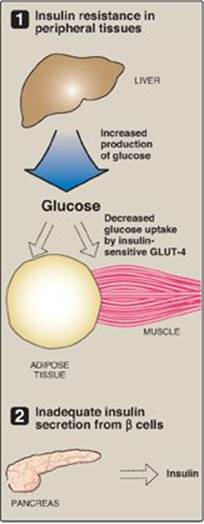
Figure 25.6 Major factors contributing to hyperglycemia observed in type 2 diabetes. GLUT = glucose transporter.
III. TYPE 2 DIABETES
T2D is the most common form of the disease, afflicting over 90% of the diabetic population in the United States. [Note: American Indians, Alaskan Natives, Hispanic and Latino Americans, African Americans, and Asian Americans have the highest prevalence.] Typically, T2D develops gradually without obvious symptoms. The disease is often detected by routine screening tests. However, many individuals with T2D have symptoms of polyuria and polydipsia of several weeks’ duration. Polyphagia may be present but is less common. Patients with T2D have a combination of insulin resistance and dysfunctional β cells (Figure 25.6) but do not require insulin to sustain life, although insulin eventually will be required to control hyperglycemia and keep HbA1c below 7% in over 90% of patients. The metabolic alterations observed in T2D are milder than those described for type 1, in part, because insulin secretion in T2D, although inadequate, does restrain ketogenesis and blunts the development of DKA. (Recall that insulin suppresses the release of glucagon.) Diagnosis is based on the presence of hyperglycemia as described above. The pathogenesis does not involve viruses or autoimmune antibodies and is not completely understood. [Note: An acute complication of T2D in the elderly is a hyperosmolar hyperglycemic state characterized by severe hyperglycemia and dehydration and altered mental status.]
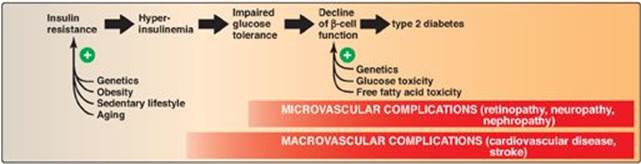
T2D is characterized by hyperglycemia; insulin resistance; impaired insulin secretion; and, ultimately, β-cell failure. The eventual need for insulin therapy has eliminated the designation of T2D as “noninsulin-dependent” diabetes.
A. Insulin resistance
Insulin resistance is the decreased ability of target tissues, such as liver, adipose, and muscle, to respond properly to normal (or elevated) circulating concentrations of insulin. For example, insulin resistance is characterized by increased hepatic glucose production, decreased glucose uptake by muscle and adipose tissue, and increased adipose lipolysis with production of free fatty acids ([FFAs] Figure 25.7).
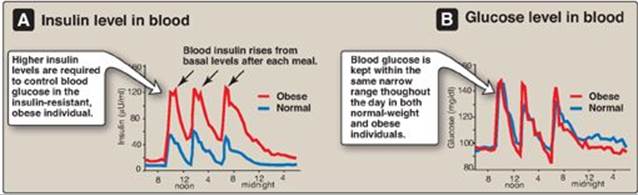
1. Insulin resistance and obesity: Although obesity is the most common cause of insulin resistance and T2D, most people with obesity and insulin resistance do not become diabetic. In the absence of a defect in β-cell function, nondiabetic, obese individuals can compensate for insulin resistance with elevated levels of insulin. For example, Figure 25.8A shows that insulin secretion is two to three times higher in obese subjects than it is in lean individuals. This higher insulin concentration compensates for the diminished effect of the hormone (as a result of insulin resistance) and produces blood glucose levels similar to those observed in lean individuals (Figure 25.8B).
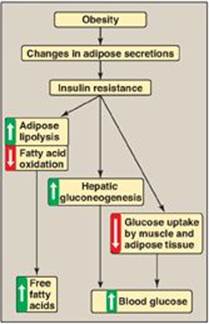
Figure 25.7 Obesity, insulin resistance, and hyperglycemia. [Note: Inflammation also is associated with insulin resistance.]
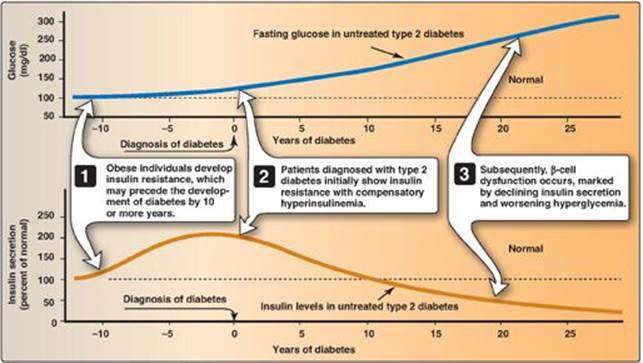
2. Insulin resistance and type 2 diabetes: Insulin resistance alone will not lead to T2D. Rather, T2D develops in insulin-resistant individuals who also show impaired β-cell function. Insulin resistance and subsequent risk for the development of T2D is commonly observed in individuals who are obese, physically inactive, or elderly and in the 3%–5% of pregnant women who develop gestational diabetes. These patients are unable to sufficiently compensate for insulin resistance with increased insulin release. Figure 25.9 shows the time course for the development of hyperglycemia and the loss of β-cell function.
Figure 25.8 Blood insulin and glucose levels in normal-weight and obese subjects.
3. Causes of insulin resistance: Insulin resistance increases with weight gain and decreases with weight loss, and excess adipose tissue is key in the development of insulin resistance (see Figure 25.7). Adipose tissue is not simply an energy storage organ, but also a secretory organ. With obesity, there are changes in adipose secretions that result in insulin resistance. These include secretion of proinflammatory cytokines such as interleukin 6 (inflammation is associated with insulin resistance); increased synthesis of leptin, a protein with proinflammatory effects (see p. 353 for additional effects of leptin); and decreased secretion of adiponectin, an adipocyte protein with anti-inflammatory effects. One effect of insulin resistance is increased lipolysis and production of FFAs. FFA availability decreases use of glucose, contributing to hyperglycemia, and increases deposition of TAG in liver (hepatic steatosis). FFAs also have a proinflammatory effect. In the long-term, FFAs suppress glucose-induced insulin release. [Note: Adiponectin increases FA β-oxidation (see p. 353). Consequently, a decrease in this adipocyte protein contributes to FFA availability.]
Figure 25.9 Progression of blood glucose and insulin levels in patients with type 2 diabetes.
B. Dysfunctional β cells
In T2D, the pancreas initially retains β-cell capacity, resulting in insulin levels that vary from above normal to below normal. However, with time, the β cell becomes increasingly dysfunctional and fails to secrete enough insulin to correct the prevailing hyperglycemia. For example, insulin levels are high in typical, obese, T2D patients but not as high as in similarly obese individuals who are nondiabetic. Thus, the natural progression of the disease results in a declining ability to control hyperglycemia with endogenous secretion of insulin (Figure 25.10). Deterioration of β-cell function may be accelerated by the toxic effects of sustained hyperglycemia and elevated FFAs and a proinflammatory environment.
Figure 25.10 Typical progression of type 2 diabetes.
C. Metabolic changes in type 2 diabetes
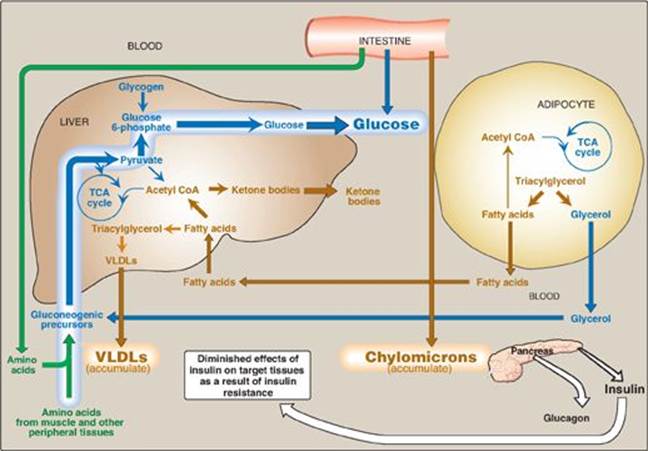
The metabolic abnormalities of T2D are the result of insulin resistance expressed primarily in liver, muscle, and adipose tissue (Figure 25.11).
1. Hyperglycemia: Hyperglycemia is caused by increased hepatic production of glucose, combined with diminished peripheral use. Ketosis is usually minimal or absent in patients with T2D because the presence of insulin, even in the presence of insulin resistance, restrains hepatic ketogenesis.
2. Dyslipidemia: In the liver, FAs are converted to TAGs, which are packaged and secreted in VLDL. Chylomicrons are synthesized from dietary lipids by the intestinal mucosal cells following a meal (see p. 177). Because lipoprotein degradation catalyzed by lipoprotein lipase in adipose tissue is low in diabetics, the plasma chylomicron and VLDL levels are elevated, resulting in hypertriacylglycerolemia (see Figure 25.10). Low levels of high-density lipoproteins are also associated with T2D, likely as a result of increased degradation.
D. Treatment of type 2 diabetes
The goal in treating T2D is to maintain blood glucose concentrations within normal limits and to prevent the development of long-term complications. Weight reduction, exercise, and medical nutrition therapy (dietary modifications) often correct the hyperglycemia of newly diagnosed T2D. Hypoglycemic agents (for example, metformin, which decreases hepatic output of glucose), sulfonylureas (increase insulin secretion; see p. 310), thiazolidinediones (increase peripheral insulin sensitivity), α-glucosidase inhibitors (decrease absorption of dietary carbohydrate) or insulin therapy may be required to achieve satisfactory plasma glucose levels. [Note: Bariatric surgery in morbidly obese individuals with T2D has been shown to result in disease remission in most patients. Remission may not be permanent.]
Figure 25.11 Intertissue relationships in type 2 diabetes. [Note: Ketogenesis is restrained as long as insulin action is adequate.] TCA = tricarboxylic acid; CoA = coenzyme A; VLDL = very-low-density lipoprotein.
IV. CHRONIC EFFECTS AND PREVENTION OF DIABETES
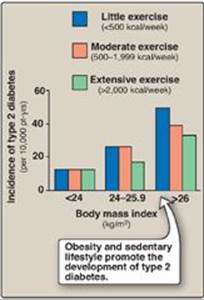
As noted previously, available therapies moderate the hyperglycemia of diabetes but fail to completely normalize metabolism. The long-standing elevation of blood glucose is associated with the chronic complications of diabetes including premature atherosclerosis as well as cardiovascular disease and stroke, retinopathy, nephropathy, and neuropathy. Intensive treatment with insulin (see p. 340) delays the onset and slows the progression of these long-term complications. For example, the incidence of retinopathy decreases as control of blood glucose improves and HbA1c levels decrease (Figure 25.12). The benefits of tight control of blood glucose outweigh the increased risk of severe hypoglycemia in most patients. How hyperglycemia causes the chronic complications of diabetes is unclear. In cells in which entry of glucose is not dependent on insulin, elevated blood glucose leads to increased intracellular glucose and its metabolites. For example, increased intracellular sorbitol contributes to the formation of cataracts (see p. 140) in diabetics. Additionally, hyperglycemia promotes the nonenzymic condensation of glucose with cellular proteins in a reaction analogous to the formation of HbA1c (see p. 34). These glycated proteins undergo additional reactions and become advanced glycation end products (AGEs) that mediate some of the early microvascular changes of diabetes and can reduce wound healing. AGEs bind to their receptors (RAGEs), causing the release of proinflammatory molecules. There is currently no preventative treatment for T1D. The risk for T2D can be significantly decreased by a combined regimen of medical nutrition therapy, weight loss, exercise, and aggressive control of hypertension and dyslipidemias. For example, Figure 25.12 shows the incidence of disease in normal and overweight individuals with varying degrees of exercise. The beneficial effect of intensive therapy on cardiovascular disease has not been shown in individuals with long-standing T2D. In contrast, initial intensive control in individuals with newly diagnosed diabetes has long-term benefit in decreasing the risk of myocardial infarction, diabetes-related death, and overall death. The clinical evidence, thus, supports initiating intensive therapy with the goal of lowering HbA1c levels to below 7% as early as possible in the course of diabetes.
Figure 25.12 Relationship of glycemic control and diabetic retinopathy. Hb = hemoglobin.
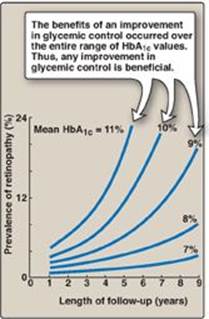
Figure 25.13 Effect of body weight and exercise on the development of type 2 diabetes.
V. CHAPTER SUMMARY
Diabetes mellitus is a heterogeneous group of syndromes characterized by an elevation of fasting blood glucose that is caused by a relative or absolute deficiency of insulin (Figure 25.14). Diabetes is the leading cause of adult blindness and amputation and a major cause of renal failure, nerve damage, heart attacks, and stroke. Diabetes can be classified into two groups, type 1 (T1D) and type 2 (T2D). Type 1 diabetics constitute approximately 10% of the nearly 26 million diabetics in the United States. The disease is characterized by an absolute deficiency of insulin caused by an autoimmune attack on the β cells of the pancreas. This destruction requires a stimulus from the environment (such as a viral infection) and a genetic determinant that allows the β cell to be recognized as “nonself.” The metabolic abnormalities of T1D mellitus include hyperglycemia, ketoacidosis, and hypertriacylglycerolemia that result from a deficiency of insulin. Type 1 diabetics must rely on exogenous insulin delivered subcutaneously to control hyperglycemia and ketoacidosis. T2D has a strong genetic component. It results from a combination of insulin resistance and dysfunctional β cells. Insulin resistance is the decreased ability of target tissues, such as liver, adipose, and muscle, to respond properly to normal (or elevated) circulating concentrations of insulin. Obesity is the most common cause of insulin resistance. However, most people with obesity and insulin resistance do not become diabetic. In the absence of a defect in β-cell function, nondiabetic, obese individuals can compensate for insulin resistance with elevated levels of insulin. Insulin resistance alone will not lead to T2D. Rather, T2D develops in insulin-resistant individuals who also show impaired β-cell function. The metabolic alterations observed in T2D are milder than those described for the insulin-dependent form of the disease, in part, because insulin secretion in T2D, although inadequate, does restrain ketogenesis and blunts the development of diabetic ketoacidosis. Available treatments for diabetes moderate the hyperglycemia but fail to completely normalize metabolism. The long-standing elevation of blood glucose is associated with the chronic complications of diabetes including premature atherosclerosis (macrovascular) as well as retinopathy, nephropathy, and neuropathy (microvascular).
Figure 25.14 Key concept map for diabetes. GLUT = glucose transporter.
Study Questions
Choose the ONE best answer.
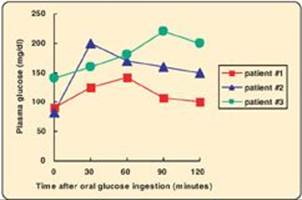
25.1 Three patients being evaluated for gestational diabetes are given an oral glucose tolerance test. Based on the data shown below, which patient is prediabetic?
A. Patient #1
B. Patient #2
C. Patient #3
D. None
Correct answer = B. Patient #2 has a normal fasting blood glucose (FBG) but an impaired glucose tolerance (GT) as reflected in her blood glucose level at 2 hours and, so, is described as prediabetic. Patient #1 has a normal FBG and GT, whereas Patient #3 is diabetic.
25.2 Relative or absolute lack of insulin in humans would result in which one of the following reactions in the liver?
A. Decreased activity of hormone-sensitive lipase
B. Decreased gluconeogenesis from lactate
C. Decreased glycogenolysis
D. Increased formation of 3-hydroxybutyrate
E. Increased glycogenesis
Correct answer = D. Low insulin levels favor the liver producing ketone bodies, using acetyl coenzyme A generated by β-oxidation of the fatty acids provided by adipose tissue. Low insulin also causes activation of hormone-sensitive lipase, decreased glycogen synthesis, and increased gluconeogenesis and glycogenolysis.
25.3 Which one of the following is characteristic of untreated diabetes regardless of the type?
A. Hyperglycemia
B. Ketoacidosis
C. Low levels of hemoglobin A1c
D. Normal levels of C-peptide
E. Obesity
F. Simple inheritance pattern
Correct answer = A. Elevated blood glucose occurs in type 1 diabetes (T1D) as a result of a lack of insulin. In type 2 diabetes (T2D), hyperglycemia is due to a defect in β-cell function and insulin resistance. The hyperglycemia results in elevated hemoglobin A1c levels. Ketoacidosis is rare in T2D, whereas obesity is rare in T1D. Connecting peptide is a measure of insulin synthesis. It would be virtually absent in T1D and initially increased then decreased in T2D. Both forms of the disease show complex genetics.
25.4 An obese individual with type 2 diabetes typically:
A. benefits from receiving insulin about 6 hours after a meal.
B. has a lower plasma level of glucagon than does a normal individual.
C. has a lower plasma level of insulin than does a normal individual early in the disease process.
D. shows improvement in glucose tolerance if body weight is reduced.
E. shows sudden onset of symptoms.
Correct answer = D. Most type 2 diabetics are obese, and almost all show some improvement in blood glucose with weight reduction. Symptoms usually develop gradually. These patients have elevated insulin levels and usually do not require insulin (certainly not 6 hours after a meal) until late in the disease. Glucagon levels are typically normal.