Lippincott’s Illustrated Reviews: Biochemistr, Sixth Edition (2014)
UNIT II: Bioenergetics and Carbohydrate Metabolism
Chapter 8. Introduction to Metabolism and Glycolysis
I. INTRODUCTION TO METABOLISM
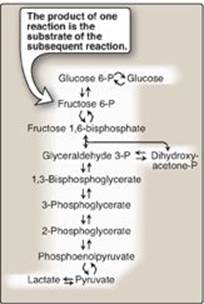
In Chapter 5, individual enzymic reactions were analyzed in an effort to explain the mechanisms of catalysis. However, in cells, these reactions rarely occur in isolation but, rather, are organized into multistep sequences called pathways, such as that of glycolysis (Figure 8.1). In a pathway, the product of one reaction serves as the substrate of the subsequent reaction. Different pathways can also intersect, forming an integrated and purposeful network of chemical reactions. These are collectively called metabolism, which is the sum of all the chemical changes occurring in a cell, a tissue, or the body. Most pathways can be classified as either catabolic (degradative) or anabolic (synthetic). Catabolic reactions break down complex molecules, such as proteins, polysaccharides, and lipids, to a few simple molecules (for example, CO2, NH3 [ammonia], and H2O). Anabolic pathways form complex end products from simple precursors, for example, the synthesis of the polysaccharide, glycogen, from glucose. [Note: Pathways that regenerate a component are called cycles.] In the following chapters, this text focuses on the central metabolic pathways that are involved in synthesizing and degrading carbohydrates, lipids, and amino acids.
Figure 8.1 Glycolysis, an example of ametabolic pathway. [Note: Pyruvate to phosphoenolpyruvate requires two reactions.] Curved reaction arrows (![]() ) indicate forward and reverse reactions that are catalyzed by different enzymes. P = phosphate.
) indicate forward and reverse reactions that are catalyzed by different enzymes. P = phosphate.
A. Metabolic map
It is convenient to investigate metabolism by examining its component pathways. Each pathway is composed of multienzyme sequences, and each enzyme, in turn, may exhibit important catalytic or regulatory features. To provide the reader with the “big picture,” a metabolic map containing the important central pathways of energy metabolism is presented in Figure 8.2. This map is useful in tracing connections between pathways, visualizing the purposeful “movement” of metabolic intermediates, and depicting the effect on the flow of intermediates if a pathway is blocked (for example, by a drug or an inherited deficiency of an enzyme). Throughout the next three units of this book, each pathway under discussion will be repeatedly featured as part of the major metabolic map shown in Figure 8.2.
B. Catabolic pathways
Catabolic reactions serve to capture chemical energy in the form of adenosine triphosphate (ATP) from the degradation of energy-rich fuel molecules. Catabolism also allows molecules in the diet (or nutrient molecules stored in cells) to be converted into building blocks needed for the synthesis of complex molecules. Energy generation by degradation of complex molecules occurs in three stages as shown in Figure 8.3. [Note: Catabolic pathways are typically oxidative, and require oxidized coenzymes such as nicotinamide adenine dinucleotide (NAD+).]
Figure 8.2 Important reactions of intermediary metabolism. Several important pathways to be discussed in later chapters are highlighted. Curved reaction arrows (![]() ) indicate forward and reverse reactions that are catalyzed by different enzymes. The straight arrows (
) indicate forward and reverse reactions that are catalyzed by different enzymes. The straight arrows (![]() ) indicate forward and reverse reactions that are catalyzed by the same enzyme. Blue text = intermediates of carbohydrate metabolism; brown text = intermediates of lipid metabolism; green text = intermediates of protein metabolism. UDP = uridine diphosphate; P = phosphate; CoA = coenzyme A.
) indicate forward and reverse reactions that are catalyzed by the same enzyme. Blue text = intermediates of carbohydrate metabolism; brown text = intermediates of lipid metabolism; green text = intermediates of protein metabolism. UDP = uridine diphosphate; P = phosphate; CoA = coenzyme A.
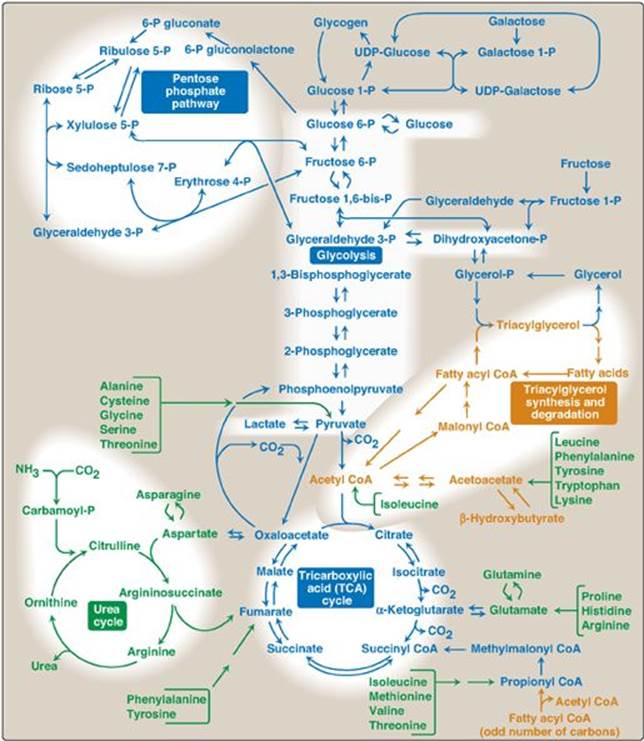
Figure 8.3 Three stages of catabolism. CoA = coenzyme A; TCA = tricarboxylic acid.
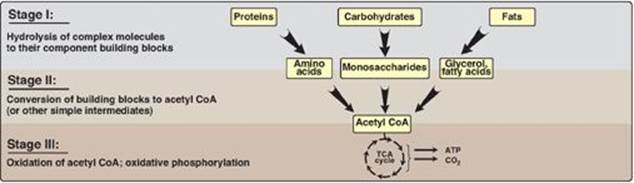
1. Hydrolysis of complex molecules: In the first stage, complex molecules are broken down into their component building blocks. For example, proteins are degraded to amino acids, polysaccharides to monosaccharides, and fats (triacylglycerols) to free fatty acids and glycerol.
2. Conversion of building blocks to simple intermediates: In the second stage, these diverse building blocks are further degraded to acetyl coenzyme A (CoA) and a few other simple molecules. Some energy is captured as ATP, but the amount is small compared with the energy produced during the third stage of catabolism.
3. Oxidation of acetyl coenzyme A: The tricarboxylic acid (TCA) cycle (see p. 109) is the final common pathway in the oxidation of fuel molecules that produce acetyl CoA. Oxidation of acetyl CoA generates large amounts of ATP via oxidative phosphorylation as electrons flow from NADH and flavin adenine dinucleotide (FADH2) to oxygen (see p. 73).
C. Anabolic pathways
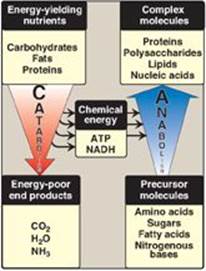
Anabolic reactions combine small molecules, such as amino acids, to form complex molecules such as proteins (Figure 8.4). Anabolic reactions require energy (are endergonic), which is generally provided by the hydrolysis of ATP to adenosine diphosphate (ADP) and inorganic phosphate (Pi). Anabolic reactions often involve chemical reductions in which the reducing power is most frequently provided by the electron donor NADPH (see p. 147). Note that catabolism is a convergent process (that is, a wide variety of molecules are transformed into a few common end products). By contrast, anabolism is a divergent process in which a few biosynthetic precursors form a wide variety of polymeric, or complex, products.
Figure 8.4 Comparison of catabolic and anabolic pathways. ATP = adenosine triphosphate; NADH = nicotinamide adenine dinucleotide.
II. REGULATION OF METABOLISM
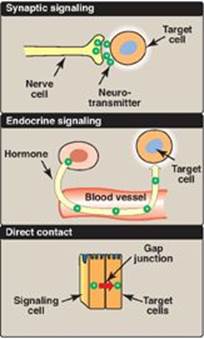
The pathways of metabolism must be coordinated so that the production of energy or the synthesis of end products meets the needs of the cell. Furthermore, individual cells do not function in isolation but, rather, are part of a community of interacting tissues. Thus, a sophisticated communication system has evolved to coordinate the functions of the body. Regulatory signals that inform an individual cell of the metabolic state of the body as a whole include hormones, neurotransmitters, and the availability of nutrients. These, in turn, influence signals generated within the cell (Figure 8.5).
A. Intracellular communication
The rate of a metabolic pathway can respond to regulatory signals that arise from within the cell. For example, the rate of a pathway may be influenced by the availability of substrates, product inhibition, or alterations in the levels of allosteric activators or inhibitors. These intracellular signals typically elicit rapid responses, and are important for the moment-to-moment regulation of metabolism.
B. Intercellular communication
The ability to respond to intercellular signals is essential for the development and survival of organisms. Signaling between cells provides for long-range integration of metabolism and usually results in a response, such as a change in gene expression, that is slower than is seen with intracellular signals. Communication between cells can be mediated, for example, by surface-to-surface contact and, in some tissues, by formation of gap junctions, allowing direct communication between the cytoplasms of adjacent cells. However, for energy metabolism, the most important route of communication is chemical signaling between cells by bloodborne hormones or by neurotransmitters.
Figure 8.5 Some commonly used mechanisms for transmission of regulatory signals between cells.
C. Second messenger systems
Hormones or neurotransmitters can be thought of as signals and their receptors as signal detectors. Each component serves as a link in the communication between extracellular events and chemical changes within the cell. Many receptors signal their recognition of a bound ligand by initiating a series of reactions that ultimately result in a specific intracellular response. “Second messenger” molecules, so named because they intervene between the original messenger (the neurotransmitter or hormone) and the ultimate effect on the cell, are part of the cascade of events that translates (transduces) hormone or neurotransmitter binding into a cellular response. Two of the most widely recognized second messenger systems are the calcium/phosphatidylinositol system (see p. 205) and the adenylyl cyclase (adenylate cyclase) system, which is particularly important in regulating the pathways of intermediary metabolism.
D. Adenylyl cyclase
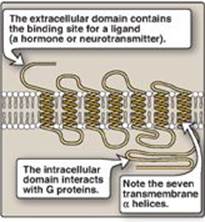
The recognition of a chemical signal by some plasma (cell) membrane receptors, such as the β- and α2-adrenergic receptors, triggers either an increase or a decrease in the activity of adenylyl cyclase (AC). This is a membrane-bound enzyme that converts ATP to 3ʹ,5ʹ-adenosine monophosphate (commonly called cyclic AMP, or cAMP). The chemical signals are most often hormones or neurotransmitters, each of which binds to a unique type of membrane receptor. Therefore, tissues that respond to more than one chemical signal must have several different receptors, each of which can be linked to AC. These receptors, known as G protein–coupled receptors (GPCRs), are characterized by an extracellular ligand-binding domain, seven transmembrane α helices, and an intracellular domain that interacts with G proteins (Figure 8.6).
Figure 8.6 Structure of a typical G protein-coupled receptor of the plasma membrane.
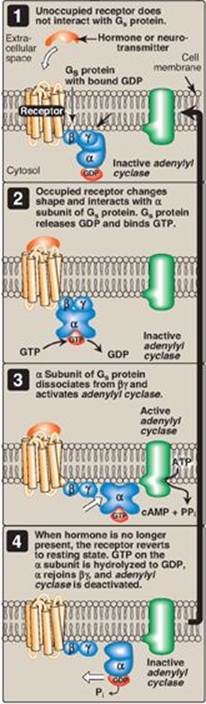
1. Guanosine triphosphate–dependent regulatory proteins: The effect of the activated, occupied GPCR on second messenger formation is not direct but, rather, is mediated by specialized trimeric proteins (α, β, and γ subunits) of the cell membrane. These proteins, referred to as G proteins because the α subunit binds guanine nucleotides (GTP and GDP), form a link in the chain of communication between the receptor and AC. In the inactive form of a G protein, the a-subunit is bound to GDP (Figure 8.7). Binding of ligand causes a conformational change in the receptor, triggering replacement of this GDP with GTP. The GTP-bound form of the α subunit dissociates from the βγ subunits and moves to AC, which is thereby activated. Many molecules of active Gα protein are formed by one activated receptor. [Note: The ability of a hormone or neurotransmitter to stimulate or inhibit AC depends on the type of Gα protein that is linked to the receptor. One type, designated Gs, stimulates AC, whereas another type, designated Gi, inhibits the enzyme (not shown in Figure 8.7).] The actions of the Gα–GTP complex are short-lived because Gα has an inherent GTPase activity, resulting in the rapid hydrolysis of GTP to GDP. This causes inactivation of the Gα, its dissociation from AC, and reassociation with the βγ dimer.
Toxins from Vibrio cholerae (cholera) and Bordetella pertussis (whooping cough) cause inappropriate activation of adenylyl cyclase through covalent modification (ADP-ribosylation) of different G proteins. With cholera, the GTPase activity of Gαs is inhibited in intestinal cells. With whooping cough, Gαi is inactivated in respiratory-tract cells.
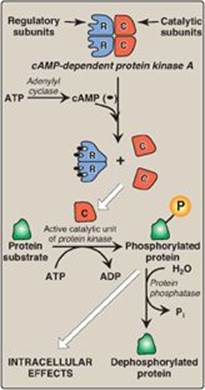
2. Protein kinases: The next key link in the cAMP second messenger system is the activation by cAMP of a family of enzymes called cAMP-dependent protein kinases such as protein kinase A (Figure 8.8). cAMP activates protein kinase A by binding to its two regulatory subunits, causing the release of two active, catalytic subunits. The active subunits catalyze the transfer of phosphate from ATP to specific serine or threonine residues of protein substrates. The phosphorylated proteins may act directly on the cell’s ion channels or, if enzymes, may become activated or inhibited. Protein kinase A can also phosphorylate proteins that bind to DNA, causing changes in gene expression (see p. 456). [Note: Several types of protein kinases are not cAMP dependent, for example, protein kinase C described on p. 205.]
3. Dephosphorylation of proteins: The phosphate groups added to proteins by protein kinases are removed by protein phosphatases, enzymes that hydrolytically cleave phosphate esters (see Figure 8.8). This ensures that changes in protein activity induced by phosphorylation are not permanent.
4. Hydrolysis of cyclic adenosine monophosphate: cAMP is rapidly hydrolyzed to 5ʹ-AMP by cAMP phosphodiesterase, one of a family of enzymes that cleave the cyclic 3ʹ,5ʹ-phosphodiester bond. 5ʹ-AMP is not an intracellular signaling molecule. Therefore, the effects of neurotransmitter- or hormone-mediated increases of cAMP are rapidly terminated if the extracellular signal is removed. [Note: Phosphodiesterase is inhibited by the methylxanthine derivative, caffeine.]
Figure 8.7 The recognition of chemical signals by certain membrane receptors triggers an increase (or, less often, a decrease) in the activity of adenylyl cyclase. GDP = guanosine diphosphate; GTP = guanosine triphosphate; cAMP = cyclic AMP.
III. OVERVIEW OF GLYCOLYSIS
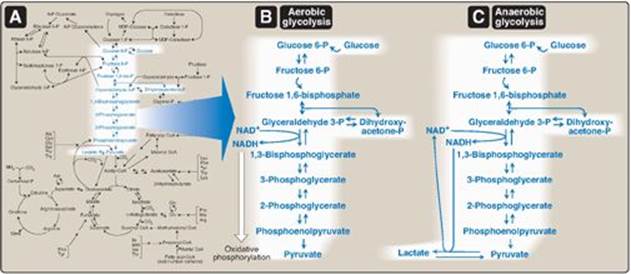
The glycolytic pathway is employed by all tissues for the oxidation of glucose to provide energy (in the form of ATP) and intermediates for other metabolic pathways. Glycolysis is at the hub of carbohydrate metabolism because virtually all sugars, whether arising from the diet or from catabolic reactions in the body, can ultimately be converted to glucose (Figure 8.9A). Pyruvate is the end product of glycolysis in cells with mitochondria and an adequate supply of oxygen. This series of ten reactions is called aerobic glycolysis because oxygen is required to reoxidize the NADH formed during the oxidation of glyceraldehyde 3-phosphate (Figure 8.9B). Aerobic glycolysis sets the stage for the oxidative decarboxylation of pyruvate to acetyl CoA, a major fuel of the TCA cycle. Alternatively, pyruvate is reduced to lactate as NADH is oxidized to NAD+ (Figure 8.9C). This conversion of glucose to lactate is called anaerobic glycolysis because it can occur without the participation of oxygen. Anaerobic glycolysis allows the production of ATP in tissues that lack mitochondria (for example, red blood cells and parts of the eye) or in cells deprived of sufficient oxygen.
Figure 8.8 Actions of cyclic AMP (cAMP). Pi = inorganic phosphate.
IV. TRANSPORT OF GLUCOSE INTO CELLS
Glucose cannot diffuse directly into cells but enters by one of two transport mechanisms: a Na+-independent, facilitated diffusion transport system or an ATP-dependent Na+-monosaccharide cotransport system.
Figure 8.9 A. Glycolysis shown as one of the essential pathways of energy metabolism. B. Reactions of aerobic glycolysis. C. Reactions of anaerobic glycolysis. NAD(H) = nicotinamide adenine dinucleotide; P = phosphate.
A. Sodium-independent facilitated diffusion transport system
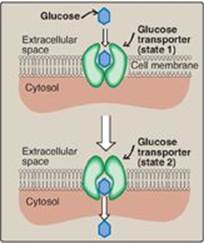
This system is mediated by a family of 14 glucose transporters found in cell membranes. They are designated GLUT-1 to GLUT-14 (glucose transporter isoforms 1–14). These monomeric protein transporters exist in the membrane in two conformational states (Figure 8.10). Extracellular glucose binds to the transporter, which then alters its conformation, transporting glucose across the cell membrane.
1. Tissue specificity of glucose transporter gene expression: The GLUTs display a tissue-specific pattern of expression. For example, GLUT-3 is the primary glucose transporter in neurons. GLUT-1 is abundant in erythrocytes and the blood–brain barrier but is low in adult muscle, whereas GLUT-4 is abundant in muscle and adipose tissue. [Note: The number of GLUT-4 transporters active in these tissues is increased by insulin. (See p. 311 for a discussion of insulin and glucose transport.)] GLUT-2 is abundant in liver, kidney, and β cells of the pancreas. The other GLUT isoforms also have tissue-specific distributions.
2. Specialized functions of glucose transporter isoforms: In facilitated diffusion, transporter-mediated glucose movement is down a concentration gradient (that is, from a high glucose concentration to a lower one and, therefore, does not require energy). For example, GLUT-1, GLUT-3, and GLUT-4 are primarily involved in glucose uptake from the blood. In contrast, GLUT-2, in the liver and kidney, can either transport glucose into these cells when blood glucose levels are high or transport glucose from these cells when blood glucose levels are low (for example, during fasting). GLUT-5 is unusual in that it is the primary transporter for fructose (not glucose) in the small intestine and the testes.
Figure 8.10 Schematic representation of the facilitated transport of glucose through a cell membrane. [Note: Glucose transporter proteins are monomeric and contain 12 transmembrane β helices.]
B. Sodium–monosaccharide cotransport system
This is an energy-requiring process that transports glucose “against” a concentration gradient (that is, from low glucose concentrations outside the cell to higher concentrations within the cell). This system is a transporter-mediated process in which the movement of glucose is coupled to the concentration gradient of Na+, which is transported into the cell at the same time. The transporter is a sodium-dependent glucose transporter (SGLT). This type of transport occurs in the epithelial cells of the intestine (see p. 87), renal tubules, and choroid plexus. [Note: The choroid plexus, part of the blood–brain barrier, also contains GLUT-1.]
Figure 8.11 Two phases of aerobic glycolysis. NAD(H) = nicotinamide adenine dinucleotide.
V. REACTIONS OF GLYCOLYSIS
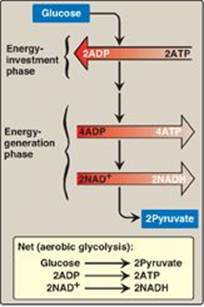
The conversion of glucose to pyruvate occurs in two stages (Figure 8.11). The first five reactions of glycolysis correspond to an energy–investment phase in which the phosphorylated forms of intermediates are synthesized at the expense of ATP. The subsequent reactions of glycolysis constitute an energy–generation phase in which a net of two molecules of ATP are formed by substrate-level phosphorylation (see p. 102) per glucose molecule metabolized.
A. Phosphorylation of glucose
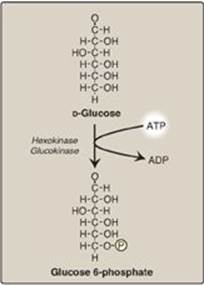
Phosphorylated sugar molecules do not readily penetrate cell membranes because there are no specific transmembrane carriers for these compounds and because they are too polar to diffuse through the lipid core of membranes. The irreversible phosphorylation of glucose (Figure 8.12), therefore, effectively traps the sugar as cytosolic glucose 6-phosphate, thereby committing it to further metabolism in the cell. Mammals have four (I–IV) isozymes of the enzyme hexokinase that catalyze the phosphorylation of glucose to glucose 6-phosphate.
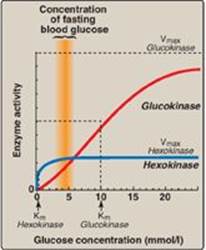
1. Hexokinases I–III: In most tissues, phosphorylation of glucose is catalyzed by one of these isozymes of hexokinase, which is one of three regulatory enzymes of glycolysis (see also phosphofructokinase and pyruvate kinase). These isozymes have broad substrate specificity and are able to phosphorylate several hexoses in addition to glucose. They are inhibited by the reaction product, glucose 6-phosphate, which accumulates when further metabolism of this hexose phosphate is reduced. Hexokinases I-III have a low Michaelis constant (Km) (and, therefore, a high affinity; see p. 59) for glucose. This permits the efficient phosphorylation and subsequent metabolism of glucose even when tissue concentrations of glucose are low (Figure 8.13). These isozymes, however, have a low maximal velocity ([Vmax] see p. 59) for glucose and, therefore, do not sequester (trap) cellular phosphate in the form of phosphorylated hexoses, or phosphorylate more sugars than the cell can use.
Figure 8.12 Energy-investment phase: phosphorylation of glucose. [Note: Kinases utilize ATP complexed with a divalent metal ion, most typically Mg2+.]
2. Hexokinase IV (or, glucokinase): In liver parenchymal cells and b cells of the pancreas, glucokinase (the hexokinase IV isozyme) is the predominant enzyme responsible for the phosphorylation of glucose. In β cells, glucokinase functions as a glucose sensor, determining the threshold for insulin secretion (see p. 309). [Note: Hexokinase IV also serves as a glucose sensor in neurons of the hypothalamus, playing a key role in the adrenergic response to hypoglycemia (see p. 315.] In the liver, the enzyme facilitates glucose phosphorylation during hyperglycemia. Despite the popular but misleading name glucokinase, the sugar specificity of the enzyme is similar to that of other hexokinase isozymes.
a. Kinetics: Glucokinase differs from hexokinases I–III in several important properties. For example, it has a much higher Km, requiring a higher glucose concentration for half-saturation (see Figure 8.13). Thus, glucokinasefunctions only when the intracellular concentration of glucose in the hepatocyte is elevated such as during the brief period following consumption of a carbohydrate-rich meal, when high levels of glucose are delivered to the liver via the portal vein. Glucokinase has a high Vmax, allowing the liver to effectively remove the flood of glucose delivered by the portal blood. This prevents large amounts of glucose from entering the systemic circulation following such a meal thereby minimizing hyperglycemia during the absorptive period. [Note: GLUT-2 insures that blood glucose equilibrates rapidly across the membrane of the hepatocyte.]
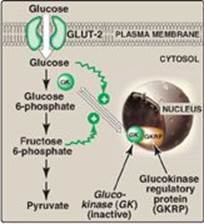
b. Regulation by fructose 6-phosphate and glucose: Glucokinase activity is not directly inhibited by glucose 6-phosphate as are the other hexokinases but, rather, is indirectly inhibited by fructose 6-phosphate (which is in equilibrium with glucose 6-phosphate, a product of glucokinase) and is indirectly stimulated by glucose (a substrate of glucokinase) via the following mechanism. Glucokinase regulatory protein (GKRP) in the liver regulates the activity of glucokinase through reversible binding. In the presence of fructose 6-phosphate, glucokinase is translocated into the nucleus and binds tightly to the regulatory protein, thereby rendering the enzyme inactive (Figure 8.14). When glucose levels in the blood (and also in the hepatocyte, as a result of GLUT-2) increase, glucokinase is released from the regulatory protein, and the enzyme reenters the cytosol where it phosphorylates glucose to glucose 6-phosphate. [Note: Fructose 1-phosphate inhibits formation of the glucokinase–GKRP complex.]
Figure 8.13 Effect of glucose concentration on the rate of phosphorylation catalyzed by hexokinase and glucokinase. Km = Michaelis constant; Vmax = maximal velocity.
Glucokinase functions as a glucose sensor in the maintenance of blood glucose homeostasis. Inactivating mutations of glucokinase are the cause of a rare form of diabetes, maturity onset diabetes of the young type 2 (MODY 2) that is characterized by impaired insulin secretion.
Figure 8.14 Regulation of glucokinase activity by glucokinase regulatory protein. GLUT = glucose transporter.
B. Isomerization of glucose 6-phosphate
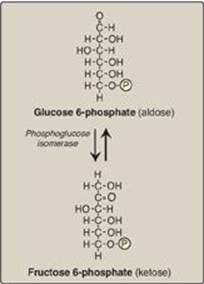
The isomerization of glucose 6-phosphate to fructose 6-phosphate is catalyzed by phosphoglucose isomerase (Figure 8.15). The reaction is readily reversible and is not a rate-limiting or regulated step.
C. Phosphorylation of fructose 6-phosphate
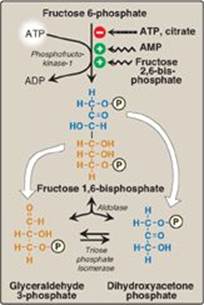
The irreversible phosphorylation reaction catalyzed by phosphofructokinase-1 (PFK-1) is the most important control point and the rate-limiting and committed step of glycolysis (Figure 8.16). PFK-1 is controlled by the available concentrations of the substrates ATP and fructose 6-phosphate as well as by regulatory substances described below.
1. Regulation by energy levels within the cell: PFK-1 is inhibited allosterically by elevated levels of ATP, which act as an “energy-rich” signal indicating an abundance of high-energy compounds. Elevated levels of citrate, an intermediate in the TCA cycle (see p. 109), also inhibit PFK-1. [Note: Inhibition by citrate favors the use of glucose for glycogen synthesis (see p. 125).] Conversely, PFK-1 is activated allosterically by high concentrations of AMP, which signal that the cell’s energy stores are depleted.
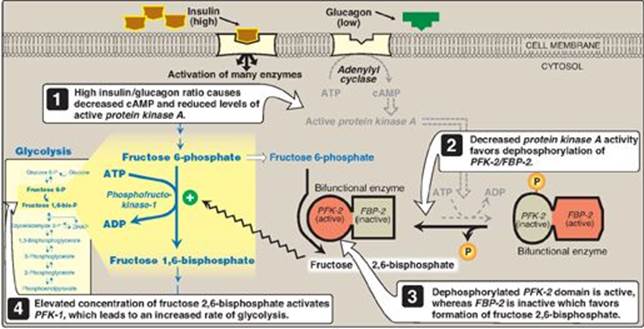
2. Regulation by fructose 2,6-bisphosphate: Fructose 2,6-bisphosphate is the most potent activator of PFK-1 (see Figure 8.16) and is able to activate the enzyme even when ATP levels are high. Fructose 2,6-bisphosphate is formed from fructose 6-phosphate by phosphofructokinase-2 (PFK-2), an enzyme different than PFK-1. PFK-2 is a bifunctional protein that has both the kinase activity that produces fructose 2,6-bisphosphate and the phosphatase activity that dephosphorylates fructose 2,6-bisphosphate back to fructose 6-phosphate. In the liver, the kinase domain is active if dephosphorylated and is inactive if phosphorylated (Figure 8.17). [Note: Fructose 2,6-bisphosphate is an inhibitor of fructose 1,6-bisphosphatase, an enzyme of gluconeogenesis (see p. 120). The reciprocal actions of fructose 2,6-bisphosphate on glycolysis (activation) and gluconeogenesis (inhibition) ensure that both pathways are not fully active at the same time, preventing a futile cycle in which glucose would be converted to pyruvate followed by resynthesis of glucose from pyruvate.]
Figure 8.15 Aldose-ketose isomerization of glucose 6-phosphate to fructose 6-phosphate. P = phosphate.
a. During the well-fed state: Decreased levels of glucagon and elevated levels of insulin, such as occur following a carbohydrate-rich meal, cause an increase in fructose 2,6-bisphosphate and, thus, in the rate of glycolysis in the liver (see Figure 8.17). Fructose 2,6-bisphosphate, therefore, acts as an intracellular signal, indicating that glucose is abundant.
b. During fasting: Elevated levels of glucagon and low levels of insulin, such as occur during fasting (see p. 327), decrease the intracellular concentration of hepatic fructose 2,6-bisphosphate. This results in inhibition of glycolysis and activation of gluconeogenesis.
Figure 8.16 Energy-investment phase (continued): Conversion of fructose 6-phosphate to triose phosphates. P = phosphate; AMP = adenosine monophosphate.
D. Cleavage of fructose 1,6-bisphosphate
Aldolase cleaves fructose 1,6-bisphosphate to dihydroxyacetone phosphate and glyceraldehyde 3-phosphate (see Figure 8.16). The reaction is reversible and not regulated. [Note: Aldolase B, the isoform found primarily in the liver, also cleaves fructose 1-phosphate and functions in the metabolism of dietary fructose (see p. 138).]
Figure 8.17 Effect of elevated insulin concentration on the intracellular concentration of fructose 2,6-bisphosphate in liver. PFK-2 = phosphofructokinase-2; FBP-2 = fructose 2,6-bisphosphatase; cAMP = cyclic AMP; P = phosphate.
E. Isomerization of dihydroxyacetone phosphate
Triose phosphate isomerase interconverts dihydroxyacetone phosphate (DHAP) and glyceraldehyde 3-phosphate (see Figure 8.16). DHAP must be isomerized to glyceraldehyde 3-phosphate for further metabolism by the glycolytic pathway. This isomerization results in the net production of two molecules of glyceraldehyde 3-phosphate from the cleavage products of fructose 1,6-bisphosphate. [Note: DHAP is utilized in triacylglycerol synthesis (see p. 188).]
F. Oxidation of glyceraldehyde 3-phosphate
The conversion of glyceraldehyde 3-phosphate to 1,3-bisphosphoglycerate (1,3-BPG) by glyceraldehyde 3-phosphate dehydrogenase is the first oxidation-reduction reaction of glycolysis (Figure 8.18). [Note: Because there is only a limited amount of NAD+ in the cell, the NADH formed by this reaction must be reoxidized to NAD+ for glycolysis to continue. Two major mechanisms for oxidizing NADH are 1) the NADH-linked conversion of pyruvate to lactate (anaerobic; see p. 96) and 2) oxidation of NADH via the respiratory chain (aerobic; see p. 74). The latter requires the malate-aspartate and glycerol 3-phosphate substrate shuttles (see p. 79.]
1. Synthesis of 1,3-bisphosphoglycerate: The oxidation of the aldehyde group of glyceraldehyde 3-phosphate to a carboxyl group is coupled to the attachment of Pi to the carboxyl group. The high-energy phosphate group at carbon 1 of 1,3-BPG conserves much of the free energy produced by the oxidation of glyceraldehyde 3-phosphate. The energy of this high-energy phosphate drives the synthesis of ATP in the next reaction of glycolysis.
2. Mechanism of arsenic poisoning: The toxicity of arsenic is due primarily to the inhibition by trivalent arsenic (arsenite) of enzymes such as the pyruvate dehydrogenase complex, which require lipoic acid as a coenzyme (see p. 110). However, pentavalent arsenic (arsenate) can prevent net ATP and NADH production by glycolysis without inhibiting the pathway itself. It does so by competing with Pi as a substrate for glyceraldehyde 3-phosphate dehydrogenase, forming a complex that spontaneously hydrolyzes to form 3-phosphoglycerate (see Figure 8.18). By bypassing the synthesis of and phosphate transfer from 1,3-BPG, the cell is deprived of energy usually obtained from the glycolytic pathway. [Note: Arsenate also competes with Pi on the F1 domain of ATP synthase (see p. 77), resulting in formation of ADP-arsenate that is rapidly hydrolyzed.]
3. Synthesis of 2,3-bisphosphoglycerate in red blood cells: Some of the 1,3-BPG is converted to 2,3-BPG by the action of bisphosphoglycerate mutase (see Figure 8.18). 2,3-BPG, which is found in only trace amounts in most cells, is present at high concentration in red blood cells (RBCs) and serves to increase O2 delivery (see p. 31). 2,3-BPG is hydrolyzed by a phosphatase to 3-phosphoglycerate, which is also an intermediate in glycolysis (see Figure 8.18). In the RBC, glycolysis is modified by inclusion of these “shunt” reactions.
Figure 8.18 Energy-generating phase: conversion of glyceraldehyde 3-phosphate to pyruvate. NAD(H) = nicotinamide adenine dinucleotide P = phosphate; Pi = inorganic phosphate.
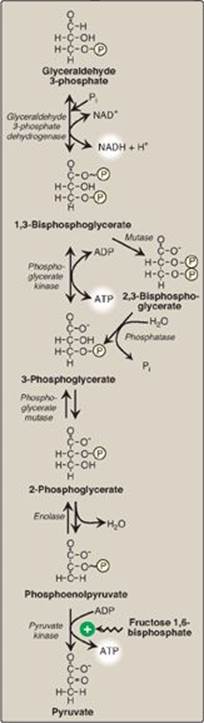
G. Synthesis of 3-phosphoglycerate, producing ATP
When 1,3-BPG is converted to 3-phosphoglycerate, the high-energy phosphate group of 1,3-BPG is used to synthesize ATP from ADP (see Figure 8.18). This reaction is catalyzed by phosphoglycerate kinase, which, unlike most other kinases, is physiologically reversible. Because two molecules of 1,3-BPG are formed from each glucose molecule, this kinase reaction replaces the two ATP molecules consumed by the earlier formation of glucose 6-phosphate and fructose 1,6-bisphosphate. [Note: This is an example of substrate-level phosphorylation, in which the energy needed for the production of a high-energy phosphate comes from a substrate rather than from the electron transport chain (see J. below and p. 113 for other examples).]
H. Shift of the phosphate group
The shift of the phosphate group from carbon 3 to carbon 2 of phosphoglycerate by phosphoglycerate mutase is freely reversible (see Figure 8.18).
I. Dehydration of 2-phosphoglycerate
The dehydration of 2-phosphoglycerate by enolase redistributes the energy within the substrate, resulting in the formation of phosphoenolpyruvate (PEP), which contains a high-energy enol phosphate (see Figure 8.18). The reaction is reversible despite the high-energy nature of the product. [Note: Fluoride inhibits enolase, and water fluoridation reduces lactate production by mouth bacteria, decreasing dental caries.]
J. Formation of pyruvate, producing ATP
The conversion of PEP to pyruvate is catalyzed by pyruvate kinase (PK), the third irreversible reaction of glycolysis. The high-energy enol phosphate in PEP is used to synthesize ATP from ADP and is another example of substrate-level phosphorylation (see Figure 8.18).
1. Feedforward regulation: PK is activated by fructose 1,6-bisphosphate, the product of the phosphofructokinase-1 reaction. This feedforward (instead of the more usual feedback) regulation has the effect of linking the two kinase activities: increased phosphofructokinase activity results in elevated levels of fructose 1,6-bisphosphate, which activates PK.
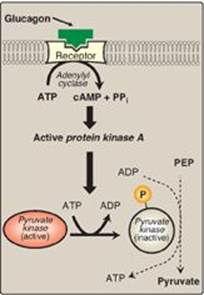
2. Covalent modulation of pyruvate kinase: Phosphorylation by a cAMP-dependent protein kinase leads to inactivation of the hepatic isozyme of PK (Figure 8.19). When blood glucose levels are low, elevated glucagon increases the intracellular level of cAMP, which causes the phosphorylation and inactivation of PK in the liver only. Therefore, PEP is unable to continue in glycolysis and, instead, enters the gluconeogenesis pathway. This, in part, explains the observed inhibition of hepatic glycolysis and stimulation of gluconeogenesis by glucagon. Dephosphorylation of PK by a phosphatase results in reactivation of the enzyme.
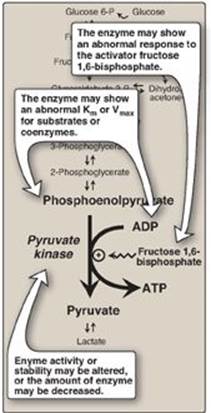
3. Pyruvate kinase deficiency: Mature RBCs lack mitochondria and are, therefore, completely dependent on glycolysis for ATP production. ATP is required to meet the metabolic needs of RBCs and to fuel the ion pumps necessary for the maintenance of the flexible, biconcave shape that allows them to squeeze through narrow capillaries. The anemia observed in glycolytic enzyme deficiencies is a consequence of the reduced rate of glycolysis, leading to decreased ATP production. The resulting alterations in the RBC membrane lead to changes in cell shape and, ultimately, to phagocytosis by cells of the reticuloendothelial system, particularly macrophages of the spleen. The premature death and lysis of RBCs result in hemolytic anemia. Among patients exhibiting the rare genetic defects of glycolytic enzymes, the majority has a deficiency in PK. The effects of PK deficiency are restricted to RBCs and include mild-to-severe nonspherocytic hemolytic anemia, with the severe form requiring regular transfusions. [Note: Hepatic PK is encoded by the same gene as the RBC isozyme. Liver cells show no effect, however, because they have mitochondria and can generate ATP by oxidative phosphorylation.] Severity depends both on the degree of enzyme deficiency (generally 5–35% of normal levels) and on the extent to which RBCs compensate by synthesizing increased levels of 2,3-BPG (see p. 31). Almost all individuals with PK deficiency have a mutant enzyme that shows abnormal properties such as altered kinetics (Figure 8.20). Individuals heterozygous for PK deficiency have resistance to the most severe forms of malaria.
Figure 8.19 Covalent modification of hepatic pyruvate kinase results in inactivation of the enzyme. cAMP = cyclic AMP; PEP = phosphoenolpyruvate; P = phosphate; PPi = pyrophosphate.
The tissue-specific expression of PK in RBCs and the liver is the result of differential promoter utilization in transcription (see p. 422) of the gene that encodes both isozymes.
Figure 8.20 Alterations observed with various mutant forms of pyruvate kinase. Km = Michaelis constant; Vmax = maximal velocity.
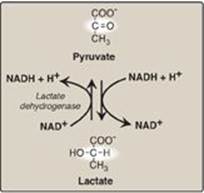
K. Reduction of pyruvate to lactate
Lactate, formed by the action of lactate dehydrogenase, is the final product of anaerobic glycolysis in eukaryotic cells (Figure 8.21). The formation of lactate is the major fate for pyruvate in the lens and cornea of the eye, kidney medulla, testes, leukocytes, and RBCs, because these are all poorly vascularized and/or lack mitochondria.
1. Lactate formation in muscle: In exercising skeletal muscle, NADH production (by glyceraldehyde 3-phosphate dehydrogenase and by the three NAD+-linked dehydrogenases of the TCA cycle; see p. 112) exceeds the oxidative capacity of the respiratory chain. This results in an elevated NADH/NAD+ ratio, favoring reduction of pyruvate to lactate. Therefore, during intense exercise, lactate accumulates in muscle, causing a drop in the intracellular pH, potentially resulting in cramps. Much of this lactate eventually diffuses into the bloodstream and can be used by the liver to make glucose (see p. 118).
2. Lactate utilization: The direction of the lactate dehydrogenase reaction depends on the relative intracellular concentrations of pyruvate and lactate and on the ratio of NADH/NAD+ in the cell. For example, in the liver and heart, the ratio of NADH/NAD+ is lower than in exercising muscle. These tissues oxidize lactate (obtained from the blood) to pyruvate. In the liver, pyruvate is either converted to glucose by gluconeogenesis or oxidized in the TCA cycle. Heart muscle exclusively oxidizes lactate to CO2 and H2O via the TCA cycle.
Figure 8.21 Interconversion of pyruvate and lactate. [Note: Lactate produced in muscle enters the circulation, is picked up by liver through facilitated diffusion, and is oxidized to pyruvate. Pyruvate is used by liver to make glucose.] NAD(H) = nicotinamide adenine dinucleotide.
3. Lactic acidosis: Elevated concentrations of lactate in the plasma, termed lactic acidosis (a type of metabolic acidosis), occur when there is a collapse of the circulatory system, such as in myocardial infarction, pulmonary embolism, and uncontrolled hemorrhage, or when an individual is in shock. The failure to bring adequate amounts of oxygen to the tissues results in impaired oxidative phosphorylation and decreased ATP synthesis. To survive, the cells rely on anaerobic glycolysis for generating ATP, producing lactic acid as the end product. [Note: Production of even meager amounts of ATP may be life-saving during the period required to reestablish adequate blood flow to the tissues.] The excess oxygen required to recover from a period when the availability of oxygen has been inadequate is termed the “oxygen debt.”
The oxygen debt is often related to patient morbidity or mortality. In many clinical situations, measuring the blood levels of lactic acid allows the rapid, early detection of oxygen debt in patients and the monitoring of their recovery.
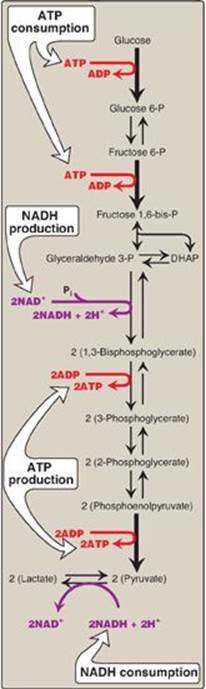
Figure 8.22 Summary of anaerobic glycolysis. Reactions involving the production or consumption of ATP or NADH are indicated. The three irreversible reactions of glycolysis are shown with thick arrows. DHAP = dihydroxyacetone phosphate; NAD(H) = nicotinamide adenine dinucleotide; P = phosphate.
L. Energy yield from glycolysis
Despite the production of some ATP during glycolysis, the end product, pyruvate or lactate, still contains most of the energy originally contained in glucose. The TCA cycle is required to release that energy completely (see p. 109).
1. Anaerobic glycolysis: Two molecules of ATP are generated for each molecule of glucose converted to two molecules of lactate (Figure 8.22). There is no net production or consumption of NADH.
2. Aerobic glycolysis: The direct consumption and formation of ATP is the same as in anaerobic glycolysis (that is, a net gain of two ATP per molecule of glucose). Two molecules of NADH are also produced per molecule of glucose. Ongoing aerobic glycolysis requires the oxidation of most of this NADH by the electron transport chain, producing approximately three ATP for each NADH molecule entering the chain (see p. 77). [Note: NADH cannot cross the inner mitochondrial membrane, and substrate shuttles are required (see p. 79).]
VI. HORMONAL REGULATION OF GLYCOLYSIS
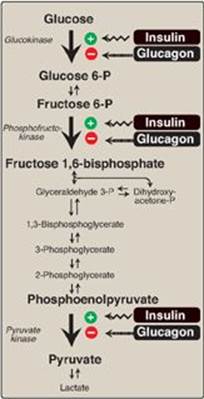
The regulation of glycolysis by allosteric activation or inhibition, or the covalent phosphorylation/dephosphorylation of rate-limiting enzymes, is short-term (that is, they influence glucose consumption over periods of minutes or hours). Superimposed on these moment-to-moment effects are slower, and often more profound, hormonal influences on gene expression, or the amount of enzyme protein synthesized. These effects can result in 10-fold to 20-fold increases in enzyme activity that typically occur over hours to days. Although the current focus is on glycolysis, reciprocal changes occur in the rate-limiting enzymes of gluconeogenesis, which are described in Chapter 10 (see p. 117). Regular consumption of meals rich in carbohydrate or administration of insulin initiates an increase in the amount of glucokinase, phosphofructokinase, and PK in the liver (Figure 8.23). These changes reflect an increase in gene transcription, resulting in increased enzyme synthesis. High activity of these three enzymes favors the conversion of glucose to pyruvate, a characteristic of the absorptive state (see p. 321). Conversely, gene transcription and synthesis of glucokinase, phosphofructokinase, and PK are decreased when plasma glucagon is high and insulin is low (for example, as seen in fasting or diabetes).
Figure 8.23 Effect of insulin and glucagon on the synthesis of key enzymes of glycolysis in liver. P = phosphate.
VII. ALTERNATE FATES OF PYRUVATE
A. Oxidative decarboxylation of pyruvate
Oxidative decarboxylation of pyruvate by the pyruvate dehydrogenase complex is an important pathway in tissues with a high oxidative capacity such as cardiac muscle (Figure 8.24). Pyruvate dehydrogenase irreversibly converts pyruvate, the end product of glycolysis, into acetyl CoA, a major fuel for the TCA cycle (see p. 109) and the building block for fatty acid synthesis (see p. 183).
B. Carboxylation of pyruvate to oxaloacetate
Carboxylation of pyruvate to oxaloacetate by pyruvate carboxylase is a biotin-dependent reaction (see Figure 8.24). This reaction is important because it replenishes the TCA cycle intermediates and provides substrate for gluconeogenesis (see p. 118).
C. Reduction of pyruvate to ethanol (microorganisms)
The conversion of pyruvate to ethanol occurs by the two reactions summarized in Figure 8.24. The decarboxylation of pyruvate by pyruvate decarboxylase occurs in yeast and certain other microorganisms but not in humans. The enzyme requires thiamine pyrophosphate as a coenzyme and catalyzes a reaction similar to that described for pyruvate dehydrogenase (see p. 110).
VIII. CHAPTER SUMMARY
Most pathways can be classified as either catabolic (degrade complex molecules to a few simple products) or anabolic (synthesize complex end products from simple precursors). Catabolic reactions also capture chemical energy in the form of ATP from the degradation of energy-rich molecules. Anabolic reactions require energy, which is generally provided by the hydrolysis of ATP. The rate of a metabolic pathway can respond to regulatory signals such as allosteric activators or inhibitors that arise from within the cell. Signaling between cells provides for the integration of metabolism. The most important route of this communication is chemical signaling (for example, by hormones or neurotransmitters). Second messenger molecules transduce a chemical signal (hormone or neurotransmitter) to appropriate intracellular responders. Adenylyl cyclase is a cell membrane enzyme that synthesizes cyclic AMP (cAMP) in response to chemical signals, such as the hormones glucagon and epinephrine. Following binding of a hormone to its cell-surface receptor, a GTP-dependent regulatory protein (G protein) is activated that, in turn, activates adenylyl cyclase. The cAMP produced activates a protein kinase, which phosphorylates a cadre of enzymes, causing their activation or deactivation. Phosphorylation is reversed by protein phosphatases. Aerobic glycolysis, in which pyruvate is the end product, occurs in cells with mitochondria and an adequate supply of oxygen (Figure 8.25). Anaerobic glycolysis, in which lactic acid is the end product, occurs in cells that lack mitochondria and in cells deprived of sufficient oxygen. Glucose is transported across membranes by one of 14 glucose transporter isoforms (GLUTs). GLUT-1 is abundant in erythrocytes and the brain, GLUT-4 (which is insulin dependent) is found in muscle and adipose tissue, and GLUT-2 is found in the liver, kidney, and β cells of the pancreas. The conversion of glucose to pyruvate (glycolysis; Figure 8.25) occurs in two stages: an energy–investment phase in which phosphorylated intermediates are synthesized at the expense of ATP, and an energy-generation phase, in which ATP is produced. In the energy-investment phase, glucose is phosphorylated by hexokinase (found in most tissues) or glucokinase (a hexokinase found in liver cells and the β cells of the pancreas). Hexokinase has a high affinity (low Km) and a low Vmax for glucose and is inhibited by glucose 6-phosphate. Glucokinase has a high Km and a high Vmax for glucose. It is indirectly inhibited by fructose 6-phosphate and activated by glucose. The transcription of the gene for glucokinase is enhanced by insulin. Glucose 6-phosphate is isomerized to fructose 6-phosphate, which is phosphorylated to fructose 1,6-bisphosphate by phosphofructokinase-1 (PFK-1). This enzyme is allosterically inhibited by ATP and citrate and activated by AMP. Fructose 2,6-bisphosphate, whose synthesis by phosphofructokinase-2 (PFK-2) is activated by insulin, is the most potent allosteric activator of PFK-1. A total of two ATP are used during this phase of glycolysis. Fructose 1,6-bisphosphate is cleaved to form two trioses that are further metabolized by the glycolytic pathway, forming pyruvate. During these reactions, four ATPand two NADH are produced from ADP and NAD+. The final step in pyruvate synthesis from phosphoenolpyruvate is catalyzed by pyruvate kinase (PK). This enzyme is allosterically activated by fructose 1,6-bisphosphate and hormonally activated by insulin and inhibited in the liver by glucagon via the cAMP pathway. PK deficiency accounts for the majority of all inherited defects in glycolytic enzymes. Effects are restricted to erythrocytes and present as mild to severe chronic, nonspherocytic hemolytic anemia. In anaerobic glycolysis, NADH is reoxidized to NAD+ by the conversion of pyruvate to lactate. This occurs in cells, such as erythrocytes, that have few or no mitochondria, and in tissues, such as exercising muscle, where production of NADH exceeds the oxidative capacity of the respiratory chain. Elevated concentrations of lactate in the plasma (lactic acidosis) occur when there is a collapse of the circulatory system or when an individual is in shock. Pyruvate can be 1) oxidatively decarboxylated by pyruvate dehydrogenase, producing acetyl coenzyme A; 2) carboxylated to oxaloacetate (a tricarboxylic acid cycle intermediate) by pyruvate carboxylase; or 3) reduced by microorganisms to ethanol by pyruvate decarboxylase.
Figure 8.24 Summary of the metabolic fates of pyruvate. TPP = thiamine pyrophosphate. TCA = tricarboxylic acid; NAD(H) = nicotinamide adenine dinucleotide; CoA = coenzyme A.
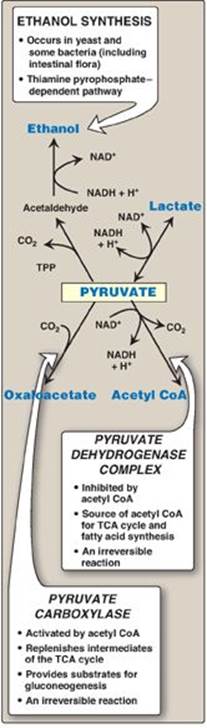
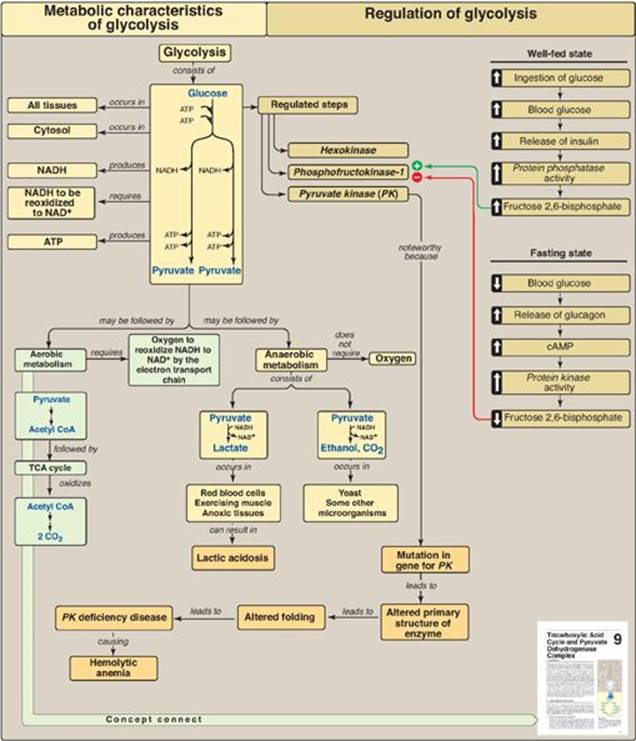
Figure 8.25 Key concept map for glycolysis. NAD(H) = nicotinamide adenine dinucleotide; cAMP = cyclic adenosine monophosphate; CoA = coenzyme A; TCA = tricarboxylic acid.
Study Questions
Choose the ONE best answer.
8.1 Which of the following best describes the activity level and phosphorylation state of the listed hepatic enzymes in an individual who consumed a carbohydrate-rich meal about an hour ago? PFK-1 = phosphofructokinase-1; PFK-2 = phosphofructokinase-2; P = phosphorylated.
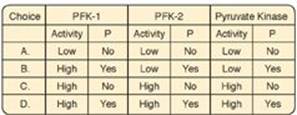
Correct answer = C. In the period immediately following a meal, blood glucose levels and hepatic uptake of glucose increase. The glucose is phosphorylated to glucose 6-phosphate and used in glycolysis. In response to the rise in blood glucose, the insulin-to-glucagon ratio increases. As a result, the kinase domain of PFK-2 is dephosphorylated and active. Its product, fructose 2,6-bisphosphate, allosterically activates PFK-1. (PFK-1 is not covalently regulated.) Active PFK-1 produces fructose 1,6-bisphosphate that is a feedforward activator of pyruvate kinase. Hepatic pyruvate kinase is covalently regulated, and the rise in insulin favors dephosphorylation.
8.2 Which of the following statements is true for anabolic pathways only?
A. Their irreversible (nonequilibrium) reactions are regulated.
B. They are called cycles if they regenerate an intermediate.
C. They are convergent and generate a few simple products.
D. They are synthetic and require energy.
E. They typically require oxidized coenzymes.
Correct answer = D. Anabolic processes are synthetic and energy requiring (endergonic). Statements A and B apply to both anabolic and catabolic processes, whereas C and E apply only to catabolic processes.
8.3 Compared with the resting state, vigorously contracting skeletal muscle shows:
A. decreased AMP/ATP ratio.
B. decreased levels of fructose 2,6-bisphosphate.
C. decreased NADH/NAD+ ratio.
D. increased oxygen availability.
E. increased reduction of pyruvate to lactate.
Correct answer = E. Vigorously contracting muscle shows an increase in the reduction of pyruvate to lactate compared with resting skeletal muscle. The levels of adenosine monophosphate (AMP) and reduced nicotinamide adenine dinucleotide (NADH) increase, whereas change in the concentration of fructose 2,6-bisphosphate is not a key regulatory factor in skeletal muscle. The rise in the NADH to NAD+ ratio exceeds the oxidative capacity of the respiratory chain.
8.4 Glucose uptake by:
A. liver cells is through facilitated diffusion involving a glucose transporter.
B. intestinal mucosal cells requires insulin.
C. brain cells is through energy-requiring (active) transport.
D. most cells is through simple diffusion up a concentration gradient.
Correct answer = A. Glucose uptake in the liver, brain, muscle, and adipose tissue is down a concentration gradient, and the diffusion is facilitated by tissue-specific glucose transporters (GLUTs). In adipose and muscle, insulin is required for glucose uptake. Moving glucose against a concentration gradient requires energy, and is seen with sodium-dependent glucose transporter-1 (SGLT-1) of intestinal mucosal cells.
8.5 Given that the Km of glucokinase for glucose is 10 mM whereas that of hexokinase is 0.1 mM, which isozyme will more closely approach Vmax at the normal blood glucose concentration of 5 mM?
Correct answer = Hexokinase. Km is that substrate concentration that gives 1⁄2 Vmax. When blood glucose concentration is 5 mM, hexo-kinase (Km = 0.1 mM) will be saturated, but glucokinase (Km = 10 mM) will not.
8.6 In patients with whooping cough, Gαi is inhibited. How does this lead to a rise in cyclic AMP?
Liganded G proteins of the Gαi type inhibit adenylyl cyclase. If Gαi is inhibited by toxin, adenylyl cyclase production of cyclic adenosine monophosphate (cAMP) is inappropriately activated.