CHEMISTRY THE CENTRAL SCIENCE
19 CHEMICAL THERMODYNAMICS
19.4 ENTROPY CHANGES IN CHEMICAL REACTIONS
In Section 5.5 we discussed how calorimetry can be used to measure ΔH for chemical reactions. No comparable method exists for measuring ΔS for a reaction. However, because the third law establishes a zero point for entropy, we can use experimental measurements to determine theabsolute value of the entropy, S. To see schematically how this is done, let's review in greater detail the variation in the entropy of a substance with temperature.
We know that the entropy of a pure crystalline solid at 0 K is zero and that the entropy increases as the temperature of the crystal is increased. ![]() FIGURE 19.13 shows that the entropy of the solid increases steadily with increasing temperature up to the melting point of the solid. When the solid melts, the atoms or molecules are free to move about the entire volume of the sample. The added degrees of freedom increase the randomness of the substance, thereby increasing its entropy. We therefore see a sharp increase in the entropy at the melting point. After all the solid has melted, the temperature again increases and with it, the entropy.
FIGURE 19.13 shows that the entropy of the solid increases steadily with increasing temperature up to the melting point of the solid. When the solid melts, the atoms or molecules are free to move about the entire volume of the sample. The added degrees of freedom increase the randomness of the substance, thereby increasing its entropy. We therefore see a sharp increase in the entropy at the melting point. After all the solid has melted, the temperature again increases and with it, the entropy.
![]() GO FIGURE
GO FIGURE
Why does the plot show vertical jumps at the melting and boiling points?
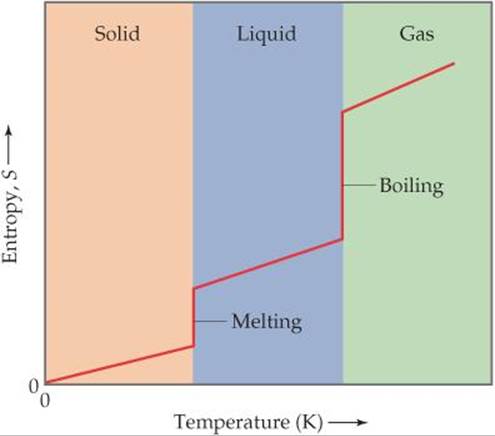
![]() FIGURE 19.13 Entropy increases with increasing temperature.
FIGURE 19.13 Entropy increases with increasing temperature.
At the boiling point of the liquid, another abrupt increase in entropy occurs. We can understand this increase as resulting from the increased volume available to the atoms or molecules as they enter the gaseous state. When the gas is heated further, the entropy increases steadily as more energy is stored in the translational motion of the gas atoms or molecules.
Another change that occurs at higher temperatures is that the distribution of molecular speeds is skewed toward higher values. ![]() [Figure 10.17(a)] The expansion of the range of speeds leads to increased kinetic energy and increased disorder and, hence, increased entropy. The conclusions we reach in examining Figure 19.13 are consistent with what we noted earlier: Entropy generally increases with increasing temperature because the increased motional energy leads to a greater number of possible microstates.
[Figure 10.17(a)] The expansion of the range of speeds leads to increased kinetic energy and increased disorder and, hence, increased entropy. The conclusions we reach in examining Figure 19.13 are consistent with what we noted earlier: Entropy generally increases with increasing temperature because the increased motional energy leads to a greater number of possible microstates.
Entropy plots such as Figure 19.13 can be obtained by carefully measuring how the heat capacity of a substance ![]() (Section 5.5) varies with temperature, and we can use the data to obtain the absolute entropies at different temperatures. (The theory and methods used for these measurements and calculations are beyond the scope of this text.) Entropies are usually tabulated as molar quantities, in units of joules per mole-kelvin (J/mol-K).
(Section 5.5) varies with temperature, and we can use the data to obtain the absolute entropies at different temperatures. (The theory and methods used for these measurements and calculations are beyond the scope of this text.) Entropies are usually tabulated as molar quantities, in units of joules per mole-kelvin (J/mol-K).
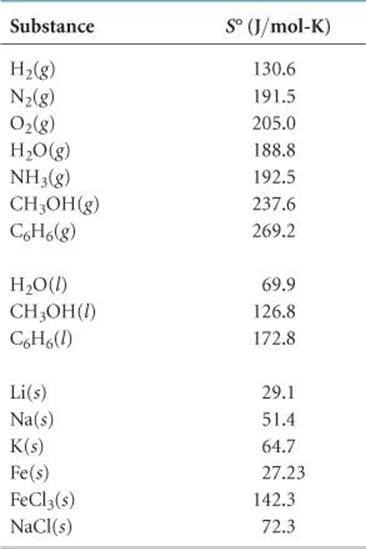
Molar entropies for substances in their standard states are known as standard molar entropies and denoted S°. The standard state for any substance is defined as the pure substance at 1 atm pressure.* ![]() TABLE 19.1 lists the values of S° for a number of substances at 298 K; Appendix C gives a more extensive list.
TABLE 19.1 lists the values of S° for a number of substances at 298 K; Appendix C gives a more extensive list.
We can make several observations about the S° values in Table 19.1:
1. Unlike enthalpies of formation, standard molar entropies of elements at the reference temperature of 298 K are not zero.
2. The standard molar entropies of gases are greater than those of liquids and solids, consistent with our interpretation of experimental observations, as represented in Figure 19.13.
3. Standard molar entropies generally increase with increasing molar mass.
4. Standard molar entropies generally increase with an increasing number of atoms in the formula of a substance.
Point 4 is related to the molecular motion discussed in Section 19.3. In general, the number of degrees of freedom for a molecule increases with increasing number of atoms, and thus the number of possible microstates also increases. ![]() FIGURE 19.14 compares the standard molar entropies of three hydrocarbons in the gas phase. Notice how the entropy increases as the number of atoms in the molecule increases.
FIGURE 19.14 compares the standard molar entropies of three hydrocarbons in the gas phase. Notice how the entropy increases as the number of atoms in the molecule increases.
TABLE 19.1 • Standard Molar Entropies of Selected Substances at 298 K
![]() GO FIGURE
GO FIGURE
What might you expect for the value of S° for butane, C4H10?
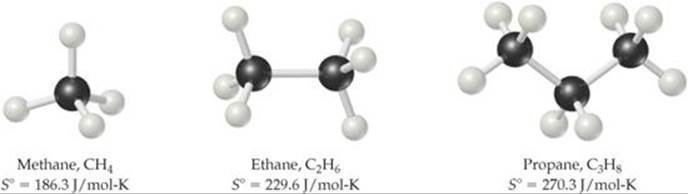
![]() FIGURE 19.14 Entropy increases with increasing molecular complexity.
FIGURE 19.14 Entropy increases with increasing molecular complexity.
The entropy change in a chemical reaction equals the sum of the entropies of the products minus the sum of the entropies of the reactants:
![]()
As in Equation 5.31, the coefficients n and m are the coefficients in the balanced chemical equation for the reaction.
SAMPLE EXERCISE 19.5 Calculating ΔS° from Tabulated Entropies
Calculate the change in the standard entropy of the system, ΔS°, for the synthesis of ammonia from N2(g) and H2(g) at 298 K:
![]()
SOLUTION
Analyze We are asked to calculate the standard entropy change for the synthesis of NH3(g) from its constituent elements.
Plan We can make this calculation using Equation 19.8 and the standard molar entropy values in Table 19.1 and Appendix C.
Solve
Using Equation 19.8, we have
![]()
Substituting the appropriate S° values from Table 19.1 yields

Check: The value for ΔS° is negative, in agreement with our qualitative prediction based on the decrease in the number of molecules of gas during the reaction.
PRACTICE EXERCISE
Using the standard molar entropies in Appendix C, calculate the standard entropy change, ΔS°, for the following reaction at 298 K:
![]()
Answer: 180.39 J/K
Entropy Changes in the Surroundings
We can use tabulated absolute entropy values to calculate the standard entropy change in a system, such as a chemical reaction, as just described. But what about the entropy change in the surroundings? We encountered this situation in Section 19.2, but it is good to revisit it now that we are examining chemical reactions.
We should recognize that the surroundings for any system serve essentially as a large, constant-temperature heat source (or heat sink if the heat flows from the system to the surroundings). The change in entropy of the surroundings depends on how much heat is absorbed or given off by the system.
For an isothermal process, the entropy change of the surroundings is given by
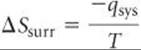
Because in a constant-pressure process, qsys is simply the enthalpy change for the reaction, ΔH, we can write
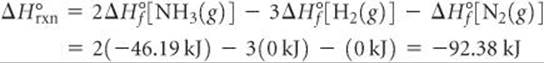
For the reaction in Sample Exercise 19.5, qsys is the enthalpy change for the reaction under standard conditions, ΔH°, so the changes in entropy will be standard entropy changes, ΔS°. Therefore, using the procedures described in Section 5.7, we have
The negative value tells us that at 298 K the formation of ammonia from H2(g) and N2(g) is exothermic. The surroundings absorb the heat given off by the system, which means an increase in the entropy of the surroundings:
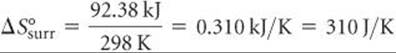
Notice that the magnitude of the entropy gained by the surroundings is greater than that lost by the system, calculated as –198.3 J/K in Sample Exercise 19.5.
The overall entropy change for the reaction is
![]()
Because ![]() is positive for any spontaneous reaction, this calculation indicates that when NH3(g), H2(g), and N2(g) are together at 298 K in their standard states (each at 1 atm pressure), the reaction moves spontaneously toward formation of NH3(g).
is positive for any spontaneous reaction, this calculation indicates that when NH3(g), H2(g), and N2(g) are together at 298 K in their standard states (each at 1 atm pressure), the reaction moves spontaneously toward formation of NH3(g).
Keep in mind that while the thermodynamic calculations indicate that formation of ammonia is spontaneous, they do not tell us anything about the rate at which ammonia is formed. Establishing equilibrium in this system within a reasonable period requires a catalyst, as discussed inSection 15.7.
![]() GIVE IT SOME THOUGHT
GIVE IT SOME THOUGHT
If a process is exothermic, does the entropy of the surroundings (1) always increase, (2) always decrease, or (3) sometimes increase and sometimes decrease, depending on the process?
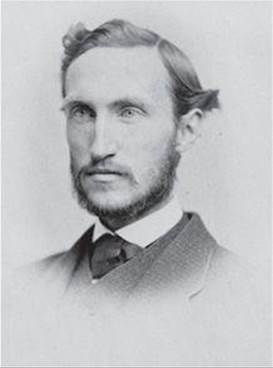
![]() FIGURE 19.15 Josiah Willard Gibbs. Gibbs was the first person to be awarded a Ph.D. in science from an American university (Yale, 1863). From 1871 until his death, he held the chair of mathematical physics at Yale. He developed much of the theoretical foundation that led to the development of chemical thermodynamics.
FIGURE 19.15 Josiah Willard Gibbs. Gibbs was the first person to be awarded a Ph.D. in science from an American university (Yale, 1863). From 1871 until his death, he held the chair of mathematical physics at Yale. He developed much of the theoretical foundation that led to the development of chemical thermodynamics.