CHEMICAL BIOLOGY
Approaches to Enzyme Inhibition
Richard B. Silverman, Northwestern University, Evanston,, Illinois
doi: 10.1002/9780470048672.wecb157
This article describes various approaches to inhibition of enzyme catalysis. Reversible inhibition includes competitive, uncompetitive, mixed inhibition, noncompetitive inhibition, transition state, and slow tight-binding inhibition. Irreversible inhibition approaches include affinity labeling and mechanism-based enzyme inhibition. The kinetics of the various inhibition approaches are summarized, and examples of each type of inhibition are presented.
Enzyme inhibitors are compounds that interact with an enzyme and slow down or prevent catalysis from occurring. Natural enzyme inhibitors are often present to control metabolism; synthetic inhibitors generally are used for the purpose of blocking enzyme-catalyzed reactions in the treatment of human and lower animal disease and in agriculture. Many biological systems are controlled with two molecules that have opposite activities, such as excitatory and inhibitory neurotransmitters or hypertensive and hypotensive peptide hormones. Specific enzymes that are responsible for the biosynthesis of these molecules can be selectively inhibited. Diseases often develop from an excess or deficiency of a particular metabolite, from infestation of a foreign organism, or from aberrant cell growth. All of these disease etiologies, at least when related to an enzyme activity, can be addressed by specific enzyme inhibition. For example, if an excess of a particular metabolite exists, then inhibition of the enzyme that produces that metabolite would decrease its concentration; inhibition of an enzyme that degrades a particular metabolite would lead to an increase in that compound, thereby reversing a deficiency of that molecule. Inhibition of an essential enzyme for a foreign organism, particularly if humans do not have that enzyme, would be an ideal method for selective toxicity of the foreign organism. A similar approach can be taken to destroy insects, fungi, or weeds for agricultural purposes, namely by inhibiting an essential enzyme for those pests. Inhibition can occur either reversibly or irreversibly. In this article, the various common approaches of reversible and irreversible inhibition are summarized with relevant examples provided for each. The reversible inhibition methods include competitive, uncompetitive, mixed, noncompetitive, transition state analog, multisubstrate analog, slow-binding, and slow tight-binding inhibition. Irreversible inhibition includes affinity labeling and mechanism-based inhibition. Derivations of the kinetic equations are given in the books in the Further Reading section at the end of this review.
Reversible Enzyme Inhibition
The most common type of inhibition is reversible inhibition. As the name implies, a reversible inhibitor functions by binding reversibly (generally noncovalently) to the target enzyme. An inhibitor forms a complex with the enzyme (an E-I complex); the dissociation of that complex is measured by the K; (the ratio of the rate of dissociation of the inhibitor to association of the inhibitor, koff/kon; the concentration of inhibitor that gives half the maximal inhibition). As it is a dissociation constant, the smaller the Ki value for an inhibitor, the tighter the binding, and the more potent is the inhibitor. How these dissociation constants for the various types of inhibition are determined experimentally is described in the respective sections below.
Reversible inhibition that produces complete loss of catalytic activity is referred to as linear inhibition because the plots of Km/V or 1/V versus [I] are straight lines. When some catalytic activity remains, even at saturating amounts of inhibitor, it is referred to as hyperbolic inhibition because these plots are nonlinear (this case will not be considered here). Both of these types of reversible inhibition are further classified according to the various apparent Michaelis-Menten parameters that are affected by the inhibitor. The two limiting cases are competitive inhibition and uncompetitive inhibition; a third type is mixed inhibition, which includes as a special case noncompetitive inhibition.
The simplest method to determine whether an inhibitor is reversible after enzyme inhibition with excess inhibitor is to remove the inhibitor by dialysis or gel filtration. If full enzyme activity returns, then inhibition is reversible. However, it does not answer the question of whether the compound is noncovalently bound or covalently bound with a weak, reversible covalent interaction.
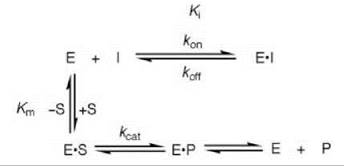
Scheme 1. Competitive inhibition.
Competitive Reversible Enzyme Inhibition
The most common type of reversible inhibition is when the inhibitor binds to the free enzyme in the substrate binding site (called the active site), which is known as competitive reversible inhibition. Competitive inhibition prevents the substrate from binding because of a competition between the substrate and inhibitor for binding to the active site (Scheme 1). Particularly in medicinal chemistry, another common expression of inhibition, in addition to the Ki, is the IC50 value, the concentration of an inhibitor that results in 50% inhibition of the enzyme in the presence of a specific concentration of substrate. The IC50 and Ki values for a competitive reversible inhibitor are roughly interconverted by the following expression (Eq. 1) (1-3)
![]()
Kinetics of Simple Competitive Inhibition
The rate of the reaction, which depends on [I], Ki, [S], and the Km, is depicted in Equation 2.
![]()
The reciprocal of this equation, known as the Lineweaver-Burk equation (4), is shown in Equation 3.
![]()
The Lineweaver-Burk expression is depicted graphically in Fig. 1. This graph correlates the rate as a function of [S], first in the absence of inhibitor (line a), then with added inhibitor concentrations (lines b-e). Note that as more inhibitor is added, the slope of the line increases, but the Vmax does not vary. As 1/[S] approaches zero (infinite [S]), the lines converge on the data in the absence of inhibitor (all of the inhibitor is displaced by substrate), namely, 1/Vmax. At low [S], inhibitor competes effectively with substrate for the enzyme. When a competitive inhibitor binds to the free enzyme, there are fewer enzyme molecules for the substrate to bind to, so the rate decreases. According to Equations 2 and 3, the reciprocal of the rate is proportional to Km/Vmax, so the slopes of the lines vary with [I] (in the presence of inhibitor, it requires more substrate to attain the same Vmax as in the absence of inhibitor). Therefore, the Km appears to be larger in the presence of inhibitor (a larger Km/Vmax means a larger slope). The apparent Km (Km,app) at each [I] can be calculated from each negative x-axis intercept using Equation 4.
![]()
The Ki values can be obtained by replotting the data from Fig. 1 in a graph of Km,app versus [I] (Fig. 2a) or Km,app/Vmax (the slope) versus [I] (Fig. 2b). Other ways of displaying kinetic data are with the use of Dixon (5) and Cornish-Bowden (6) plots.
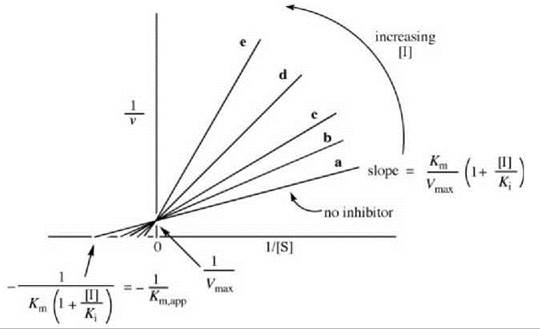
Figure 1. Graphical depiction of Lineweaver-Burk expression for determination of competitive inhibitor kinetic constants.
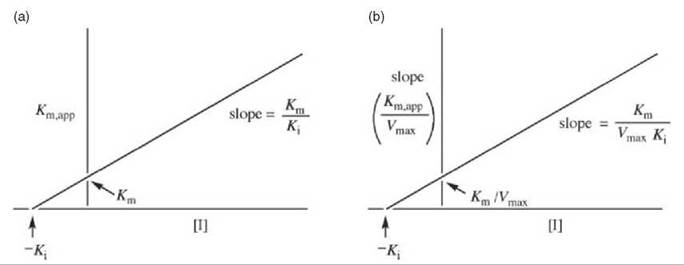
Figure 2. (a) Replot of data from Lineweaver-Burk plots (Fig. 1) for determination of K values for competitive inhibitors. (b) Alternative replot of data from Lineweaver-Burk plots (Fig. 1) for determination of K values for competitive inhibitors.
Example of Simple Competitive Inhibition
As the most common type of inhibition, myriad examples of competitive reversible inhibition exist in the literature. The following is a selection from Thomas Poulos and my laboratories related to the selective inhibition of the neuronal isozyme of nitric oxide synthase (NOS) (7). Nitric oxide (NO) is a ubiquitous biological messenger involved in a variety of physiological processes that acts as a signal transducer but also exerts a variety of regulatory and cytostatic functions (8). It is produced by the enzyme NOS, which catalyzes the oxidation of L-arginine to L-citrulline and NO in a NADPH- and O2-dependent process (9, 10). There are at least three distinct isoforms of NOS. The constitutive endothelial isoform (eNOS) is involved in the regulation of smooth muscle relaxation and blood pressure and in the inhibition of platelet aggregation (11). A second constitutive isoform is neuronal NOS (nNOS), which is important for neurotransmission (12). A third isozyme is inducible NOS (iNOS), which is located in activated macrophage cells and acts as a cytotoxic agent in normal immune responses (13). All of the isoforms use NADPH, FAD, FMN, tetrahydrobiopterin, and heme as cofactors. The constitutive isoforms also require Ca2+ and calmodulin for activity, whereas the inducible isoform has tightly bound Ca2+ and calmodulin. They share only approximately 50% of primary sequence homology, suggesting that they may differ from each other in regulatory aspects. The use of NOS inhibitors in pathologically elevated synthesis of NO has great therapeutic potential (14, 15). NO overproduction by nNOS has been associated with neurodegeneration during stroke, spinal transmission of pain, migraine headaches, Parkinson’s disease, and Alzheimer’s disease. Thus nNOS represents an important therapeutic target for nNOS-selective inhibitors (16). Enhanced formation of NO after the induction of iNOS appears to be important in the tolerance to and dependence on morphine, development of colitis, cancer, and tissue damage and inflammation (17, 18). Selective inhibition of one isoform over the others is essential because the three isoforms of NOS have unique roles in separate tissues (19).
An analog of (L)-nitroarginine, L-nitroargininyl-L-2,4-diaminobutyramide (1), was shown to be a potent (Ki 130nM) and highly selective inhibitor of nNOS (1538-fold more potent than with eNOS and 192-fold more potent than with iNOS) (20). In addition to a kinetic analysis that demonstrated competitive inhibition, dialysis of the inhibited enzyme led to the return of enzyme activity, indicating that 1 is a reversible inhibitor. The competitive nature of the inhibition was firmly established by X-ray crystallography, showing 1 in the active site (7) of both nNOS (Fig. 3a) and eNOS (Fig. 3b). The nitroargininyl moiety binds at the guanidino binding site for L-arginine. However, in nNOS 1 adopts a somewhat curled conformation, whereas in eNOS it has an extended conformation. It is thought that this binding difference develops from two sources: a 1 amino acid difference in the active site, namely, Asp597 in nNOS is Asn368 in eNOS, which is responsible for an important electrostatic interaction in nNOS that is missing in eNOS, and the smaller Val106 side chain in eNOS near the active site entry, which allows inhibitors to adopt an extended conformation while the larger Met336 in nNOS encourages a curled conformation. If Asp597 in nNOS is mutated to Asn, then 1 adopts an extended conformation in D597N nNOS as if it was binding to eNOS. Furthermore, the K; value for 1 with the D597N mutant is 223 times larger (weaker binding) than wild-type nNOS, again simulating binding interactions like those with eNOS (21). Conversely, if Asn368 in eNOS is mutated to Asp, then 1 adopts a curled conformation in N368D eNOS, as if it was nNOS, and the Ki value for 1 bound to N368D eNOS is 10 times lower (more potent) than in wild-type eNOS, again simulating binding to nNOS rather than to eNOS. A double mutant of eNOS, N368D/V106M eNOS, was prepared to make the active site of eNOS appear even more nNOS-like, and the Ki value for 1 was an additional fivefold lower than the single mutant; the crystal structure showed that 1 was still in the curled conformation, as in the case with wild-type nNOS. Likewise, 1 bound to the D597 N/M336V double mutant of nNOS was in the extended conformation (Fig. 4) as if it was bound to eNOS, although there was little change in the Ki value relative to that of the single mutant.
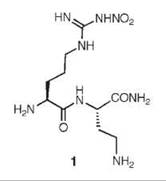
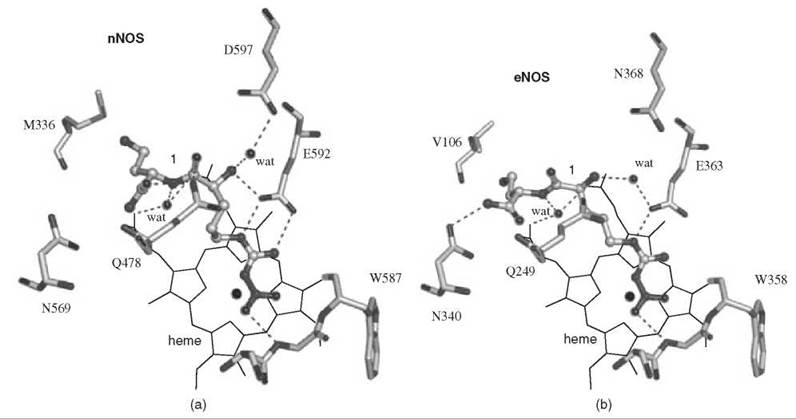
Figure 3. (a) Compound 1 bound to active site of nNOS. (b) Compound 1 bound to active site of eNOS.
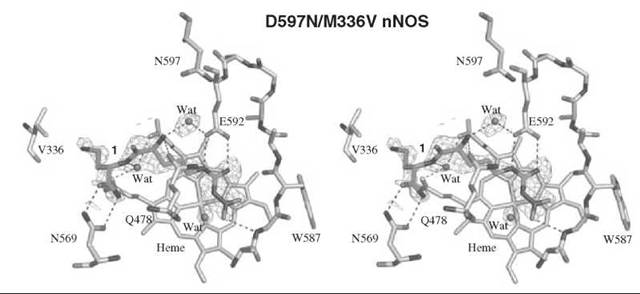
Figure 4. Stereographic projection of 1 bound to active site of the D597N/M336V double mutant of nNOS.
Uncompetitive Enzyme Inhibition
The other extreme is when a compound binds only to the E-S complex but not to the free enzyme, in which case uncompetitive inhibition occurs (Scheme 2). Although it is rare in single substrate reactions, it is common in multiple substrate systems. An inhibitor of a two-substrate enzyme that is competitive against one of the substrates often is found to give uncompetitive inhibition when the other substrate is varied. The inhibitor binds at the active site but only prevents the binding of one of the substrates.
Scheme 2. Uncompetitive inhibition.
Kinetics Of Uncompetitive Inhibition
The rate of this type of inhibition is described by Equation 5; the Lineweaver-Burk transformation of this rate equation is given by Equation 6.
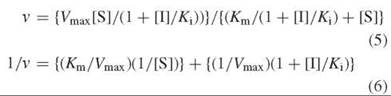
As uncompetitive inhibitors do not bind to free enzyme, the inhibitor has no effect on the Vmax/Km, and the slopes are independent of inhibitor concentration (Fig. 5). The Ki values can be obtained from replots of either 1/Vmax,app (the y-axis intercepts) versus [I] (Fig. 6a) or 1/Km,app (the x-axis intercepts) versus [I] (Fig. 6b).
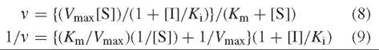
The IC50 value for an uncompetitive inhibitor is related to the Ki by Equation 7 (22). When [S] >> Km, which is often the case, the IC50 = Ki.
![]()
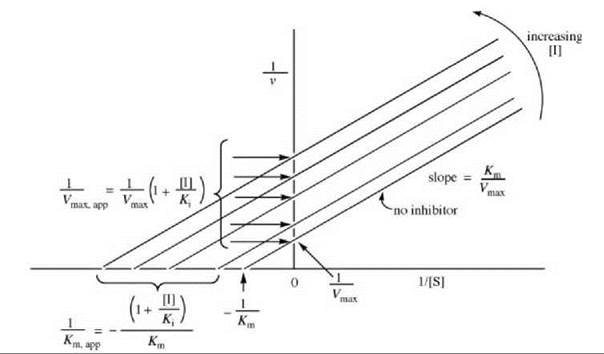
Figure 5. Lineweaver-Burk plots for determination of uncompetitive inhibitor kinetic constants.
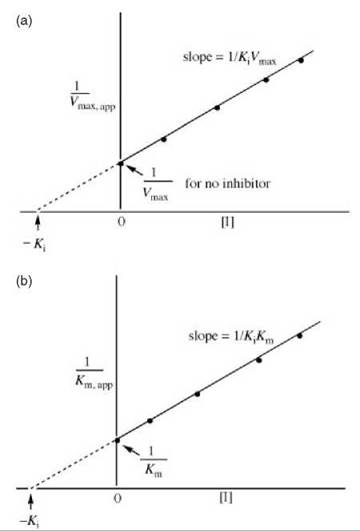
Figure 6. (a) Replot of data from Lineweaver-Burk plots (Fig. 5) for determination of K values for uncompetitive inhibitors. (b) Alternative replot of data from Lineweaver-Burk plots (Fig. 12) for determination of K values for uncompetitive inhibitors.
Example of Uncompetitive Inhibition
Tuberculosis is responsible for 2,000,000 deaths worldwide annually (23). It is one of the leading opportunistic infections in Acquired Immune Deficiency Syndrome (AIDS) patients (24) and is spreading because of multidrug-resistant strains of the organism that causes tuberculosis, namely Mycobacterium tuberculosis (25). The principal drug used for tuberculosis is isoniazid (2, Scheme 3), which inhibits the biosynthesis of mycolic acids, thereby disrupting the mycobacterium’s cell wall (26). The target for isoniazid is the enoyl reductase (known as InhA) in the type II fatty acid biosynthesis pathway (27). InhA is inhibited by the product of the mycobacterial catalase-peroxidase (KatG) (28) reaction of isoniazid and NADH (3, Scheme 3) (29-31). Resistance to isoniazid principally develops from mutations in KatG, which blocks the activation of isoniazid (32). Compounds that directly inhibit the ultimate target, InhA, without requirement of activation by KatG should be more promising drugs for resistant Mycobacterium tuberculosis.
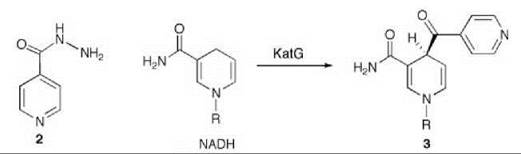
Scheme 3. Mycobacterial catalase-peroxidase (KatG)-catalyzed reaction of isoniazid (2) and NADH.
A series of uncompetitive inhibitors of InhA were developed using structure-based design from the crystal structure of triclosan (4) bound to both E. coli enoyl reductase (called ecFabI) (33) and to InhA (Fig. 7) (34). Triclosan was shown by kinetic analysis to be an uncompetitive inhibitor of InhA (35). The structure of triclosan bound to InhA confirmed its uncompetitive inhibition properties; triclosan binds to InhA only in the presence of NAD+. The phenol ring of triclosan n-stacks with the nicotinamide ring of NAD+ as well as forming a hydrogen bond to Tyr158 and the 2'-hydroxyl group of NAD+. Based on this structure, a series of alkyl diphenyl ethers, which are uncompetitive inhibitors of InhA and do not require activation by KatG, was designed. The most potent analog (5) has a Kivalue of 1 nM for InhA and MIC99 (minimum inhibitory concentration to destroy 99% of the organisms) values of 2-3 pg/mL (6-10 pm) for drug-sensitive and drug-resistant strains of Mycobacterium tuberculosis.
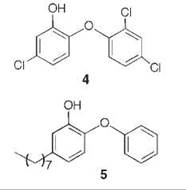
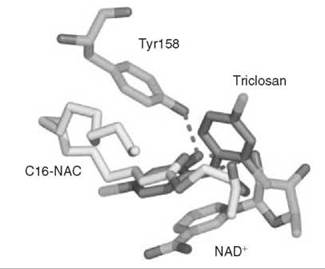
Figure 7. Structure of triclosan (gray) bound to E. coli InhA overlayed with the structure of substrate (C16-NAC) (yellow) bound to InhA and NAD+.
Mixed Enzyme Inhibition
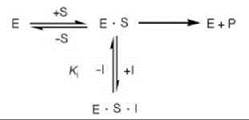
Sometimes an inhibitor can bind to both the free enzyme (E) and to the enzyme-substrate (E-S) complex, resulting in mixed inhibition (Scheme 4). This type of inhibition involves binding of the inhibitor to a site other than at the active site for binding to the E-S complex to occur. A special case of mixed inhibition when Km and K m are equal is called noncompetitive inhibition.
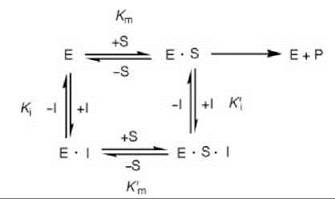
Scheme 4. Mixed inhibition.
Kinetics of Mixed Inhibition
If dissociation of the substrate from the E-S complex is the same as that from the E-S-I complex (i.e., Km = Km’), then pure noncompetitive inhibition occurs, and the rate is given as Equation 8. The Lineweaver-Burk equation from this is shown in Equation 9, which is depicted graphically in Fig. 8.
Unlike competitive inhibitors, noncompetitive inhibitors affect Vmax (interception on the y-axis is different at different inhibitor concentrations) but not Km (all concentrations of inhibitor give lines with the same interception on the x-axis). A replot of these data either as the slope versus [I] (Fig. 9a) or 1/Vmax,app versus [I] (Fig. 9b) provides the Ki value. Dixon (5) and Cornish-Bowden (6) plots also can be constructed.
The situation above, where Km = Km’ for dissociation of the substrate from both the E-S and the E∙S∙I complexes, is actually relatively rare compared with the case of different dissociation constants. If the E∙I complex has a lower affinity for the substrate than free enzyme, then inhibition is a mixture of competitive and uncompetitive inhibition, referred to as mixed inhibition. In the presence of inhibitor, there will always be some E-S-I complex, which lowers the free enzyme concentration, and Vmax will be less than with just free enzyme (the E∙S∙I complex is nonproductive). As the E-I complex has a lower affinity for substrate than free enzyme, the Km will be greater (lower affinity) for the E∙I complex than that with free enzyme. The Lineweaver-Burk equation for this case is shown in Equation 10.
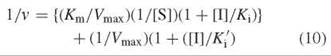
In this case, the interception of lines as a function of inhibitor concentration can occur either above the x-axis (Fig. 10a) or below the x-axis Fig. 10b). Ki values for mixed inhibition are obtained by replotting the data from the Lineweaver-Burk plot as the slope ([Km/Vmax][1 + [[I]/Ki]) versus [I] (Fig. 11a) or as the y-axis intercept (1/Vmax,app) versus [I] (Fig. 11b). With Fig. 11a, the x-axis intercept is — Ki; with Fig. 11b the x-axis intercept is — K'i.
The IC50 value for a mixed inhibitor can be related to the Ki by Equation 11 (36). For a noncompetitive inhibitor, in which Ki = Ki', or when the [S] >> Km, IC50 = Ki.
![]()
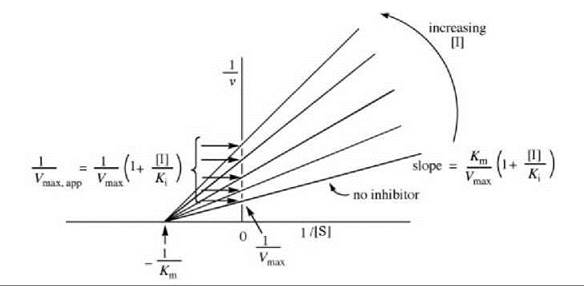
Figure 8. Graphical depiction of Lineweaver-Burk expression for determination of pure noncompetitive inhibitor kinetic constants.
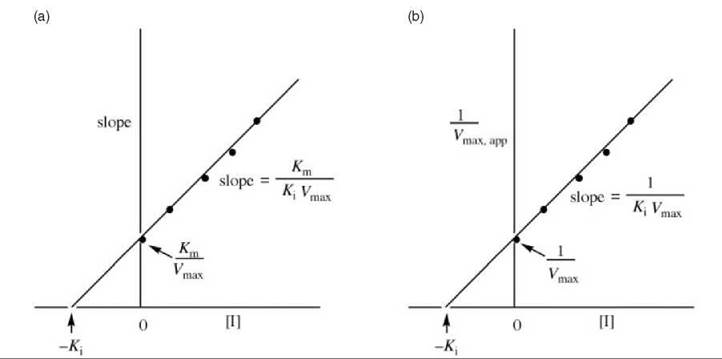
Figure 9 (a) Replot of data from Lineweaver-Burk plots (Fig. 8) for determination of K values for pure noncompetitive inhibitors. (b) Alternative replot of data from Lineweaver-Burk plots (Fig. 8) for determination of Ki values for pure noncompetitive inhibitors.
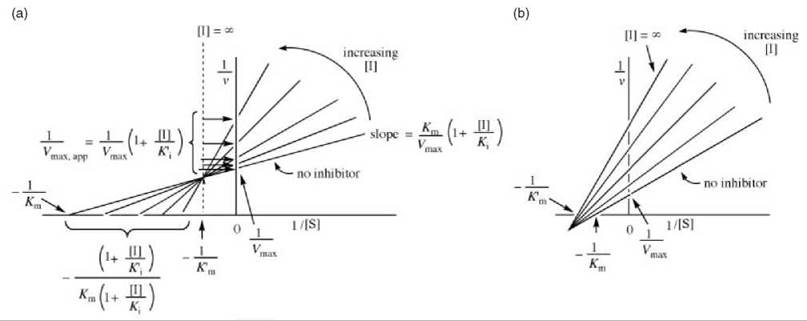
Figure 10. (a) One possible graphical depiction of Lineweaver-Burk plots for determination of mixed inhibitor kinetic constants. (b) Alternative possibility for graphical depiction of Lineweaver-Burk expression for determination of mixed inhibitor kinetic constants.
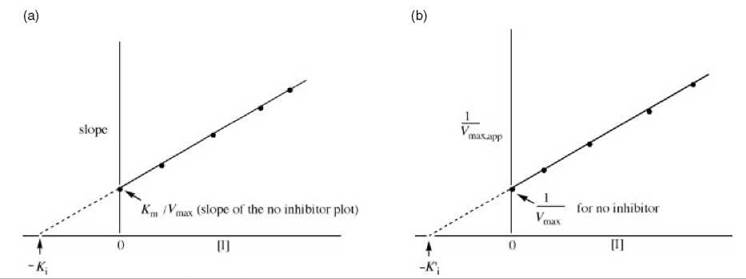
Figure 11. (a) Replot of data from Lineweaver-Burk plots (Fig. 10) for determination of K values for mixed inhibitors. (b) Alternative replot of data from Lineweaver-Burk plots (Fig. 10) for determination of K values for mixed inhibitors.
Example of Mixed Inhibition
The mitogen-activated protein kinase (MAPK) signaling pathway is responsible for the regulation of cell growth and differentiation consisting of a MAPK (such as ERK1 and ERK2), a MAPK kinase (such as MEK1 and MEK2), and a MAPKK kinase (37-39). The MAPK signaling pathways are important for the formation, progression, and survival of tumors (40) as well as being intracellular mediators in many inflammatory processes (41). MEK1 and MEK2 phosphorylate ERK at specific tyrosine and threonine residues, which is a prerequisite for cell proliferation. MEK1 and MEK2 are equally competent to phosphorylate ERK (42), so both are targets for the design of antitumor agents.
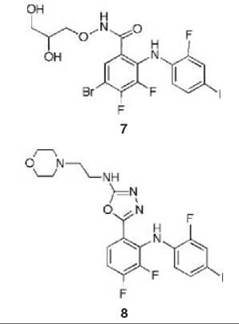
Compound 6 has been found to be a potent and highly selective inhibitor of MEK1 and MEK2; it was shown kinetically to be a mixed inhibitor with both Mg∙ATP and MAPK and went into clinical trials for the treatment of colon cancer (43). Further evidence for the mixed inhibition properties of 6 was provided by crystal structures of an analog of 6 (compound 7) bound to an N-terminally truncated form of human MEK1 containing Mg-ATP (to 2.4 A resolution) and compound 8 bound to an N-terminally truncated form of human MEK2 containing Mg-ATP (to 3.2 A resolution) (44). Therefore, the inhibitors bind to the E-S complex. The Mg∙ATP in MEK1 binds in a location similar to that in other protein kinases; 6, however, binds in a separate binding site adjacent to Mg-ATP (Fig. 12). The side chains of Lys97 and Met143 separate these two binding pockets. When Mg∙ATP and 6 are bound to unphosphorylated MEK1, the two lobes adopt a closed conformation, causing conformational changes in the activation loop and helix C, which interferes with an important electrostatic interaction between a conserved glutamate residue (Glu114) and a conserved lysine residue (Lys97) in the ATP binding site, resulting in stabilization of an inactive conformation of the enzyme. A similar structure was obtained for 8 bound to MEK2 containing Mg∙ATP. It is believed that the specificity of these mixed inhibitors derives from their binding in a region where sequence homology to other protein kinases is very low and distinct from the highly homologous ATP binding site.
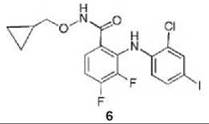
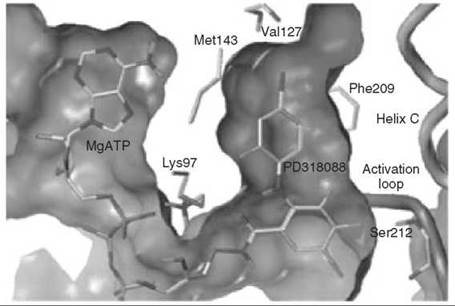
Figure 12. Crystal structure of MEK1 showing Mg-ATP and mixed inhibitor 6 (referred in the paper as PD318088) in different binding pockets.
Transition State Analog Inhibition and Slow Tight-Binding Inhibition
A special type of reversible inhibition in which the inhibitor resembles the transition state structure of the enzyme-catalyzed reaction is known as transition state analog inhibition. It has long been believed that an enzyme catalyzes its reaction by an initial interaction of the substrate with the active site of the enzyme, triggering a conformational change in the enzyme, which induces the chemistry of the reaction (45, 46). As the reaction approaches the transition state, the binding interactions with the substrate increase until, at the transition state, maximal binding interactions result. These interactions produce transition state stabilization, which is responsible for lowering the activation energy and accelerating the rate of the reaction.
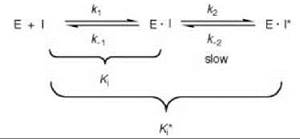
This process suggests that enhanced binding by an inhibitor to an enzyme would occur if the inhibitor structure resembled that of the transition state of the reaction rather than the ground state (i.e., the substrate structure) (47-50), which has been shown to be the case in many examples (51). Typically the kinetics of inhibition of transition state analog inhibitors are different from that of other types of reversible inhibitors, which exhibit instantaneous inhibition (millisecond time scale); transition state analog inhibitors generally produce time-dependent inhibition (t1/2 of seconds or even hours) as a result of a conformational change that is induced when these inhibitors bind to the enzyme, leading to a slow isomerization of the initial E-I complex to another complex (E∙I*) in which the inhibitor is bound more tightly to the enzyme than in the E∙I complex (Scheme 5). This process is known as slow-binding inhibition.
Kinetics of Slow-Binding Inhibition and Slow Tight-Binding Inhibition
Reversible inhibitors that attain equilibrium between enzyme, inhibitor, and the E∙I complex slowly, as compared with the enzyme-catalyzed substrate reaction, are called slow-binding inhibitors (52). In some cases, the ratio of total inhibitor to total enzyme must be high, as in the case of the classic competitive inhibitors; but in other cases, the attainment of the equilibrium of E, I, and the E∙I complex occurs when the inhibitor concentration is approximately the same as the enzyme concentration, in which case the inhibitors are called slow tight-binding inhibitors (53, 54). Slow-binding and slow tight-binding inhibition generally occur in competition with the substrate, but also can be a mixed type inhibition. The lifetimes of enzyme complexes with slow-binding inhibitors or slow tight-binding inhibitors are relatively long and exhibit slow off rates (koff); the on rates (kon) may be fast or slow. As the rate of release of the inhibitor from the E∙I complex becomes exceedingly slow, inhibition approaches irreversible. The overall dissociation constant for the E∙I* complex (Ki*) is defined by Equation 12.
![]()
Progress curves for a slow-binding or slow tight-binding inhibitor are described by general Equation 13, where vo, vs, and k represent, respectively, the initial
![]()
rate, the final steady-state rate, and the apparent first-order rate constant for establishment of the equilibrium between E∙I and E∙I*. The following equations are valid only under specific simplifying conditions (52). Equilibria to the formation of the E-S (from E + S) and E∙I (from E + I) complexes must be attained rapidly. In addition to a slow establishment of equilibrium between E∙I and E∙I*, the reverse rate (k-2) of this equilibrium must be much less than the forward rate (k2). The initial rate is obtained from Equation 14, where Vmax is the maximum rate, [S] is the concentration of the substrate for which I is an inhibitory analog,
![]()
Km is the Michaelis constant for S, and Ki is the dissociation constant for the E∙I complex. The final steady-state rate is obtained from Equation 15, where Ki* is
![]()
the overall inhibition constant as defined in Equation 12. The apparent first-order rate constant (k) for the interconversion of E∙I and E∙I* in the presence of substrate S is expressed in Equation 16. Figure 13 gives an example of a progress curve for a slow-binding inhibitor. For each curve with inhibitor present, there is an initial burst followed by a slower steady-state rate.
![]()
Scheme 5. Slow-binding or slow tight-binding inhibition.
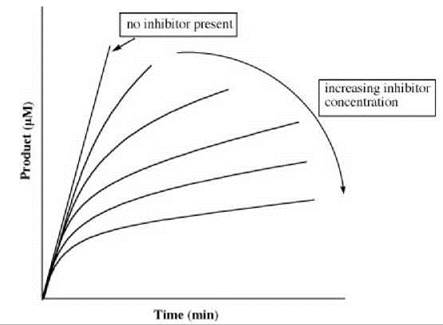
Figure 13. Progress curve for slow-binding inhibition.
Example of a Transition State Analog Inhibitor that Exhibits Slow Tight-Binding Inhibition
5'-Methylthioadenosine/S-adenosylhomocysteine nucleosidase (MTAN) catalyzes the hydrolysis of 5'-methylthioadenosine (MTA), a byproduct of polyamine synthesis, to adenine and 5-methylthio-D-ribose (MTR) (Scheme 6). MTA is a feedback inhibitor of polyamine synthesis, so inhibition of MTAN would inhibit polyamine synthesis and the salvage pathways for adenine and methionine, which would result in antibacterial (55) or antitumor activity (56). Kinetic isotope effects on this reaction were measured to determine the transition state structure (57). A large 1'-3H and small 1'-14C isotope effect suggest that the MTAN-catalyzed reaction proceeds by a dissociative (SN1) mechanism with little involvement of the leaving group or attacking nucleophile at the transition state, which indicates that the transition state has significant ribooxacarbenium ion character. Based on this hypothetical transition state structure, two series of transition state analog inhibitors were designed (9 and 10) to mimic the transition state structure. The protonated
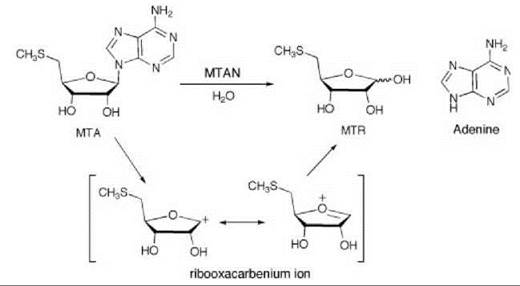
Scheme 6. 5'-Methylthioadenosine/S-adenosylhomocysteine nucleosidase (MTAN)-catalyzed hydrolysis of 5'-methylthioadenosine (MTA) to adenine and 5-methylthio-D-ribose (MTR).
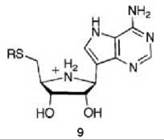
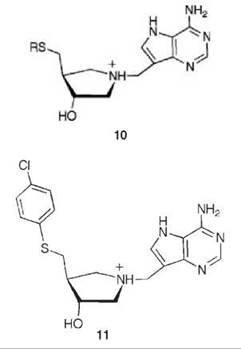
nitrogens in each series mimic the ribooxacarbenium ion intermediate (related to the transition state) and a methylene bridge was added between the ribooxacarbenium ion mimic and the 9-deazaadenine base to emulate the N-ribosidic bond distance of a fully dissociated transition state. A kinetic analysis shows that 9 and 10 are competitive inhibitors; progression curves demonstrated the time dependence of the inhibition. Application of Equations 14-16 to the 9 series resulted in dissociation constants in the picomolar range and for the 10 series in the femtomolar range. Compound 11 has a Ki = 2.6 pM and a Ki* = 47 fM with a Km/Ki* value of 9.1 million and 91 million (11 binds this amount greater) relative to the substrates MTA and S-adenosylhomocysteine, respectively! These are some of the most potent noncovalent competitive enzyme inhibitors known. Furthermore, there is no MTAN in humans; 5'-methylthioadenosine phosphorylase (MTAP) is the only enzyme in humans capable of metabolizing MTA, and MTAN has a larger 5'-alkylthio binding site. Specificity factors in the thousands between inhibition of MTAN in bacteria over MTAP in humans were achieved, which allows for selective toxicity against microorganisms.
The crystal structures of 9 (R = CH3) and 10 (R = CH3) bound to MTAN at 2.2 A resolution revealed a new ion pair between the positive charge on the ring and the nucleophilic water (hydroxide ion) (58). Based on the distances of these interacting atoms, 9 (R = CH3) appears to be a mimic of an early transition state, and 10 (R = CH3) mimics a highly dissociated transition state, for the MTAN-catalyzed reaction.
Example of a Multisubstrate Analog Inhibitor
Purine nucleoside phosphorylase (PNP), which catalyzes the reversible phosphorolysis of ribonucleosides to ribose 1-phosphate and the free base (Scheme 7), plays an important role in purine nucleoside metabolism and in T-cell development (59, 60). PNP inhibitors have therapeutic utility for selective destruction of T cells in T-cell leukemias and T-cell lymphomas as well as in the treatment of T-cell-mediated autoimmune diseases and for the suppression of the post-organ transplant T-cell response (61).
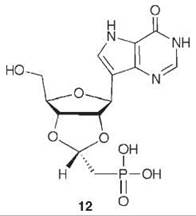
To mimic the long bond length in the transition state, compound 12 was synthesized as a multisubstrate inhibitor (62). This compound mimics both substrates of PNP, the purine nucleoside, and phosphate. The two-carbon bridge between the ribose ring and the phosphonate group was incorporated to place the phosphonate moiety into the phosphate-binding site. A crystal structure of 12 bound in PNP to 1.7 A resolution (Fig. 14) resembles that of a previously determined structure of bovine PNP with substrate analogs (inosine and sulfate) bound (63). The nucleoside part of 12 binds in the purine nucleoside binding pocket, and the phosphonate binds in the phosphate binding pocket. The IC50 for 12 is 30 nM, one of the most potent PNP inhibitors reported.
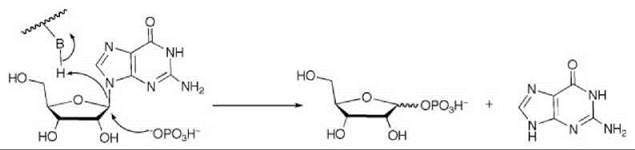
Scheme 7. Purine nucleoside phosphorylase (PNP)-catalyzed phosphorolysis of ribonucleosides to ribose 1-phosphate and the free base.
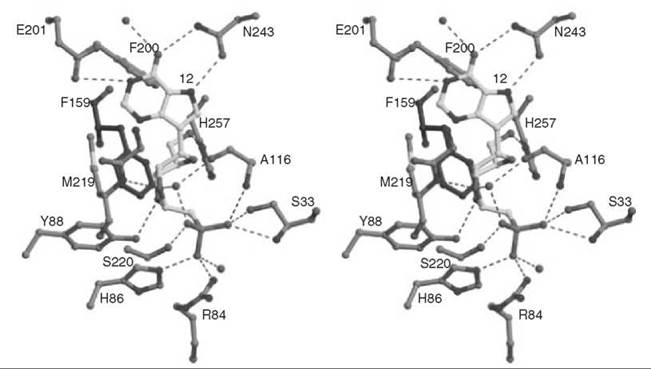
Figure 14. Stereographic projection of 12 bound to active site of PNP at 1.7
Substrate and Product Inhibition
Michaelis-Menten kinetics predict that as the concentration of the substrate increases, the rate increases hyperbolically. However, some enzymes exist in which a maximum velocity is obtained at low substrate concentration, but further increases in the substrate concentration lead to a decrease in velocity. This effect is known as substrate inhibition and can eventually lead to complete enzyme inhibition or partial enzyme inhibition.
It is thought that substrate inhibition occurs if two substrate molecules bind to the enzyme simultaneously in an incorrect orientation and produce an inactive E∙S∙S complex, analogous to that discussed for uncompetitive inhibition. The rate of the enzyme reaction that undergoes substrate inhibition is given by Equation 17, where Ki represents the
![]()
equilibrium constant for formation of the E∙S∙S complex from E∙S and S and K’m is a modified Michaelis constant. The reciprocal of Equation 17 is described by Equation 18, which is analogous to the Lineweaver-Burk equation and is depicted graphically in Fig. 15.
![]()
Another type of inhibition results from the product formed in an enzyme-catalyzed reaction (64). The rate of substrate turnover in the presence of preexisting product is less than the initial rate at the same substrate concentration in the absence of product. This process occurs for two reasons: Some of the enzyme is in an E-P complex so there is less enzyme available to which the substrate can bind, which increases the apparent Km for the substrate; some of the product is being converted back to substrate, which makes it appear as if less substrate is available.
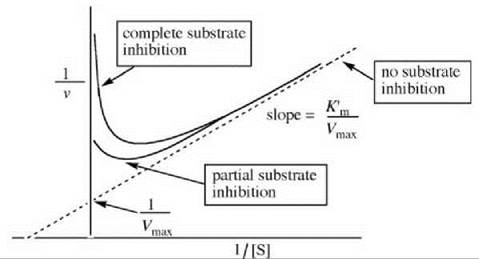
Figure 15. Graphical depiction of the Lineweaver-Burk expression for substrate inhibition.
Irreversible Enzyme Inhibition
Irreversible enzyme inhibition, also called enzyme inactivation (or active-site directed irreversible inhibition, because it is generally competitive with substrate), occurs when a compound blocks the enzyme activity for an extended period of time, generally via covalent bond formation. Therefore, even though some slow tight-binding inhibitors functionally block the enzyme activity irreversibly, they are still considered reversible inhibitors because they can dissociate from the enzyme, albeit very slowly. The most effective inactivators are ones whose structures are similar to those of the substrates or products of the target enzyme, but this is not essential when studying an isolated enzyme. Once the reaction has occurred, it is no longer necessary to sustain a concentration of the inactivator to retain the E∙I complex because of the covalent nature of the bond formed. In some cases only a stoichiometric amount of inactivator is needed to produce complete irreversible inhibition. Irreversible inhibition is generally determined by dialysis or gel filtration of the inactivated enzyme; no enzyme recovery is expected. Two general types of irreversible enzyme inhibitors exist, affinity labeling agents and mechanism-based inactivators.
Affinity Labeling Agents
Affinity labeling agents are intrinsically reactive compounds that initially bind reversibly to the active site of the enzyme then undergo chemical reaction (generally an acylation or alkylation reaction) with a nucleophile on the enzyme (Scheme 8). To differentiate a reversible inhibitor from an irreversible one, often the dissociation constant is written with a capital i, Ki (65), instead of a small i, Ki, which is used for reversible inhibitors. The KI denotes the concentration of an inactivator that produces half-maximal inactivation. Note that this kinetic Scheme is similar to that for substrate turnover except instead of the catalytic rate constant, kcat for product formation, kinact is used to denote the maximal rate constant for inactivation.
![]()
Scheme 8. Affinity labeling agent inactivation.
Kinetics of Affinity Labeling Inactivation
When the equilibrium for reversible E∙I complex formation (KI) is rapid, and the rate of dissociation of the E∙I complex (koff) is fast relative to kinact (the most common situation), then kinact is the rate-determining step, and time-dependent loss of enzyme activity occurs. Under these conditions, when [I] >> [Eo], then Kitz and Wilson (65) described kapp by Equation 19. Two limiting situations can be
![]()
considered. For [I] >> KI, kapp = kinact, and pseudo first-order kinetics are observed, as shown in Fig. 16a. For [I] < KI then kapp = kinact/KI, which gives simple bimolecular kinetics, in which case the straight line in Fig. 16b would pass through the origin rather than the + y-axis.
To determine the KI and kinact values, first a plot of the log of the enzyme activity versus time is constructed (Fig. 16a). The rate of inactivation is proportional to low concentrations of the inactivator, but becomes independent at high concentrations. In these cases, the inactivator reaches enzyme saturation (just as substrate saturation occurs during catalytic turnover). Once all of the enzyme molecules are in the E-I complex, the addition of more inactivator does not affect the rate of the inactivation reaction. The half-lives for inactivation (t 1/2) at each inactivator concentration (lines a-e in Fig. 16a) are determined. The t1/2 at any inactivator concentration equals log 2/kinact,app; in the limiting case of infinite inactivator concentration, t1/2 = 0.693/kinact (log 2 = 0.693). A replot of these half-lives versus the inverse of the inactivator concentration, referred to as a Kitz and Wilson replot, is constructed to obtain the KI and kinact values (Fig. 16b).
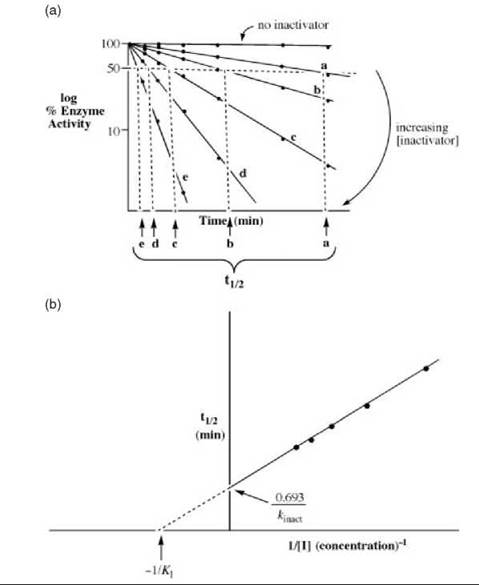
Figure 16. (a) A plot showing time-dependent inactivation by affinity labeling agents and mechanism-based inactivators used for determination of kinetic constants. (b) Replot of the half-lives of inactivation from Fig. 16a versus the inverse of the inactivator concentration to determine the Kl and kinact values for affinity labeling agents and mechanism-based inactivators.
Example of an Affinity Labeling Agent
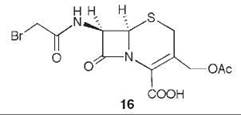
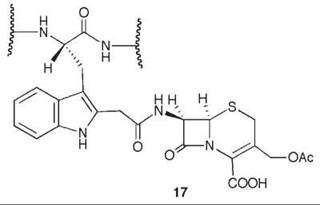
7-Aminocephalosporanic acid (15, Scheme 9) is an important intermediate in the production of many semisynthetic cephalosporin antibiotics (66, 67). However, direct deacylation of cephalosporin C (13) to 15 by cephalosporin C acylase is unfavorable, so an enzymatic process is used involving D-amino acid oxidase (DAAO) oxidation of 13 to N-glutaryl-7-aminocephalosporanic acid (14, GL-7-ACA) followed by deacylation to 15 and glutaric acid, catalyzed by GL-7-ACA acylase from Pseudomonas sp. 130 (Scheme 9) (68, 69). GL-7-ACA acylase underwent pseudo first-order time-dependent inactivation by 7β-bromoacetyl aminocephalosporanic acid (16) (70). Dialysis did not regenerate enzyme activity, indicating irreversible inhibition. The rate of inactivation was lowered by the presence of either glutaric acid or 15, indicating that inactivation is active-site directed (competitive inhibition). The site of covalent attachment was identified as the indole ring of Trp-B4 by LC/MS peptide mapping, tandem MS analysis, and NMR spectrometry. MALDI-TOF spectrometric analysis showed that the fourth tryptophan residue in the P-subunit (Trp-B4) was alkylated. 1H-13C HSQC NMR spectrometry of the acylase inactivated by [2-13C]-16 demonstrated that a C-C bond was formed, and it was the tryptophan residue that was alkylated. Based on other inactivations, it is reasonable that attachment is at C-2 of the indole ring of the tryptophan after rearrangement from the C-3 alkylation product (71) (17). As Trp-B4 is in the middle of an αββα sandwich structure, which does not have sufficient space for the inactivator to fit, it is believed that a conformational change has to occur to allow alkylation. Mutations at Trp-B4, except WB4Y, prevented covalent modification of the enzyme.
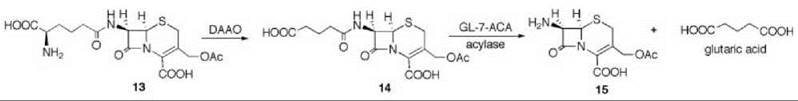
Scheme 9. D-Amino acid oxidase (DAAO) oxidation of 13 to N-glutaryl-7-aminocephalosporanic acid (14, GL-7-ACA) followed by deacylation to 15 and glutaric acid catalyzed by GL-7-ACA acylase from Pseudomonas sp. 130.
Mechanism-Based Enzyme Inactivators
Mechanism-based inactivators are unreactive compounds that bear a structural similarity to the substrate or product of a specific enzyme and are converted by the normal catalytic mechanism of that enzyme into a product that, before its release, inactivates the enzyme. These inactivators, then, act initially as substrates for the target enzyme. Generally the product undergoes a covalent bond reaction with the target enzyme, but it may just form a tight-binding complex that is functionally irreversible. The key features are an unreactive compound that is enzymatically converted to the actual inactivating species, which binds to that same enzyme before the inactivator’s release. Inactivation by these compounds requires knowledge of the mechanism of the enzyme. Alternatively, because these compounds act as substrates, they can be designed to test a hypothetical catalytic mechanism for an enzyme and determine if a particular type of intermediate is reasonable.
Kinetics of Mechanism-Based Inactivation
As activation of a mechanism-based inactivator requires a catalytic step, an additional intermediate (E-I’) is required relative to affinity labeling agents (Scheme 10). If k4 is a fast step and the equilibrium k1/k-1 is established rapidly, then k2 is the inactivation rate constant (kinact), which determines the maximal rate for the inactivation process leading to E-I’. As both affinity labeling agents and mechanism-based inactivators initially form reversible E-I complexes, which then lead to inactivation of the enzyme (affinity labeling agents by direct covalent reaction and mechanism-based inactivators by initial [generally] rate-determining modification to the activated species followed by rapid reaction), the kinetic constants (KI and kinact) for both types of inactivators are determined in the same way (see Figs. 16a and 16b). The key features of mechanism-based inactivators that differentiate them from affinity labeling agents are their unreactivity and the requirement for an enzyme-catalyzed conversion to the activated species before inactivation. Often this activated species is quite reactive, so it acts as an affinity labeling agent already at the active site. However, inactivation (k4in Scheme 10) does not occur every time the inactivator is activated because the enzyme will attempt to eject it from the active site as a product (k3 in Scheme 10). It would not be a favorable process if the activated species is highly reactive because it could attach to other parts of the enzyme or, if more than one enzyme was present, could attach to another enzyme. The ratio of the number of turnovers that leads to product release per inactivation event (k3/k4) is known as the partition ratio.
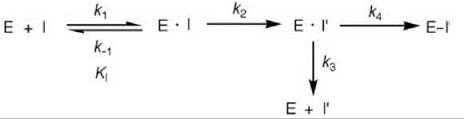
Scheme 10. Mechanism-based enzyme inactivation.
Example of a Mechanism-Based Inactivator
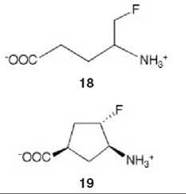
There are many examples of mechanism-based inactivators from which to choose, but I have selected an example from mine and Tilman Schirmer’s laboratories that relates to the inactivation of γ-aminobutyric acid aminotransferase (GABA-AT). This enzyme is a pyridoxal 5'-phosphate (PLP) dependent enzyme that catalyzes the conversion of the inhibitory neurotransmitter GABA to succinic semialdehyde with concomitant conversion of α-ketoglutarate to the excitatory neurotransmitter L-glutamate (Scheme 11). When the concentration of GABA in the brain diminishes, convulsions can occur. Inhibition of GABA-AT prevents the degradation of GABA, resulting in an increase in the brain GABA concentrations, which is one approach for the treatment of epilepsy. Based on the structure of 4-amino-5-fluoropentanoic acid (18), which was shown to be a very efficient mechanism-based inactivator of GABA-AT (72), (1R,3S,4S )-3-amino-4-fluorocyclopentane-1-carboxylic acid (19) was designed as a potentially more lipophilic analog (73). Two inactivation mechanisms were envisioned for 19, one leading to 23 (pathway a) and one leading to 24 (pathway b) (Scheme 12). A crystal structure refined to 1.9 zA resolution of the enzyme inactivated by 19 (Fig. 17) showed explicitly that the more reasonable mechanism is that shown in pathway a to give 23 (74). Inactivator 19 is a classic example of a mechanism-based inactivator; it is an unreactive molecule that is converted by the normal catalytic mechanism of GABA-AT to 20. Deprotonation leads to elimination of fluoride ion (probably via an E1cB mechanism into the PLP) to give a product (21), which after reaction with the active site lysine produces 22. Before its release from the active site, 22 undergoes an enamine reaction with Lys-bound PLP to give covalent adduct 23, the structure identified in the crystal structure. The partition ratio for this inactivator was measured by determination of the number of fluoride ions released per inactivation event to be 147; 148 molecules are turned over, one of which leads to inactivation. Therefore, the crystal structure was able to differentiate these two mechanistic possibilities. The use of crystallography to resolve mechanistic alternatives has been referred to as mechanistic crystallography.
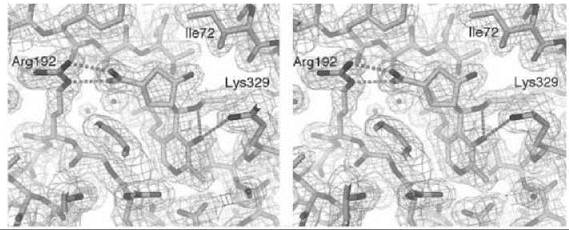
Figure 17. Stereographic projection of 19 bound to GABA-AT at 1.9 A resolution.
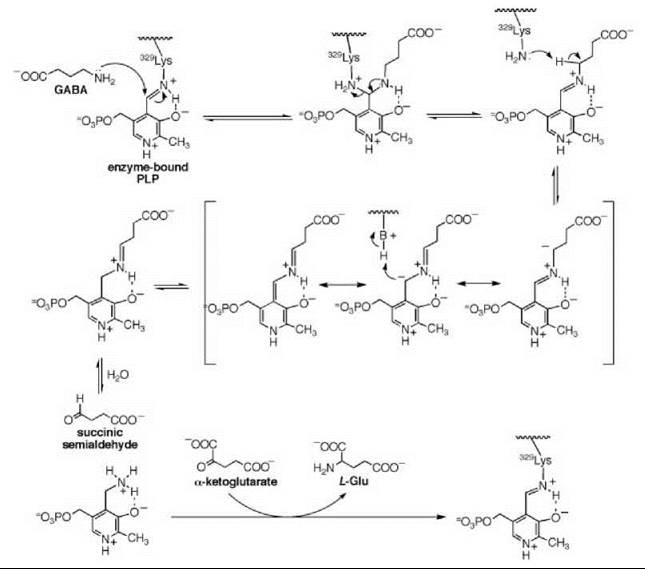
Scheme 11. Mechanism for GABA-AT.
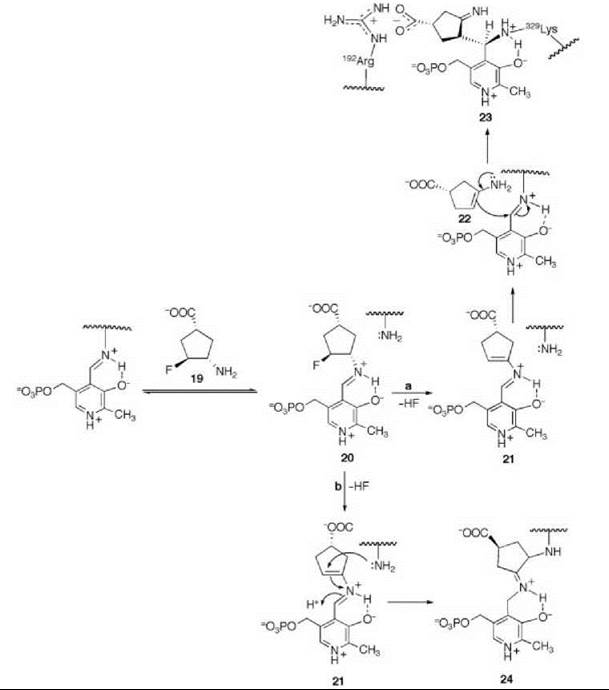
Scheme 12. Two possible mechanisms for inactivation of GABA-AT by 19.
References
1. Cheng YC, Prusoff WH. Relationship between the inhibition constant (KI) and the concentration of inhibitor which causes 50 per cent inhibition (I50) of an enzymatic reaction. Biochem. Pharmacol. 1973; 22:3099-3108.
2. Segal IH. Enzyme kinetics: behavior and analysis of rapid equilibrium and steady state enzyme systems. 1975. John Wiley & Sons, New York, p. 106.
3. Burlingham BT, Widlanski TS. An intuitive look at the relationship of Ki and IC50: a more general use for the Dixon plot. J. Chem. Educ. 2003; 80:214-218.
4. Lineweaver H, Burk D. The determination of enzyme dissociation constants. J. Am. Chem. Soc. 1934; 56:658-666.
5. Dixon M. The determination of enzyme inhibitor constants. Biochem. J. 1953; 55(1):170-171.
6. Cornish-Bowden A. A simple graphical method for determining the inhibition constants of mixed, uncompetitive and non-competitive inhibitors. Biochem. J. 1974; 137(1):143-144.
7. Li H, Flinspach ML, Igarashi J, Jamal J, Yang W, Gomez-Vidal JA, Litzinger EA, Huang H, Erdal EP, Silverman RB, Poulos TP. Exploring the binding conformations of bulkier dipeptide amide inhibitors in constitutive nitric oxide synthases. Biochemistry 2005; 44:15222-15229.
8. Ghafourifar P, Saavedra-Molina A. Functions of mitochondrial nitric oxide synthase. Oxidative Stress and Disease 2006; 19:77-98.
9. Su Y, Kondrikov D, Block ER. Cytoskeletal regulation of nitric oxide synthase. Cell Biochem. Biophys. 2005; 43(3):439-449.
10. Hobbs AJ, Higgs A, Moncada S. Inhibition of nitric oxide synthase as a potential therapeutic target. Annu. Rev. Pharmacol. Toxicol. 1999; 39:191-220.
11. Dudzinski DM, Igarashi J, Greif D, Michel T. The regulation and pharmacology of endothelial nitric oxide synthase. Annu. Rev. Pharmacol. Toxicol. 2006; 46:235-276.
12. Mungrue IN, Bredt DS. nNOS at a glance: implications for brain and brawn. J. Cell Sci. 2004; 117(13):2627-2629.
13. Lowenstein CJ, Padalko E. iNOS (NOS2) at glance. J. Cell Sci. 2004; 117(14):2865-2867.
14. Alcaraz MJ, Guillen MI. Nitric oxide related therapeutic phenomenon: a challenging task. Curr. Pharm. Des. 2002; 8:215-231.
15. Matter H, Kotsonis P. Biology and chemistry of the inhibition of nitric oxide synthases by pteridine-derivatives as therapeutic agents. Med. Res. Rev. 2004; 24(5):662-684.
16. Erdal EP, Litzinger EA, Seo J, Zhu Y, Ji H, Silverman RB. Selective neuronal nitric oxide synthase inhibitors. Curr. Top. Med. Chem. 2005; 5(7):603-624.
17. Miljkovic DJ, Markovic M, Trajkovic V. Inducible nitric oxide synthase inhibition by mycophenolic acid. Mini-Rev. Med. Chem. 2004; 4(7):741-746.
18. Hofseth LJ, Sawa T, Hussain SP, Harris CC. Inducible nitric oxide synthase as a target for chemoprevention. Cancer Chemoprevent. 2004; 1:133-151.
19. Salerno L, Sorrenti V, Di Giacomo C, Romeo G, Siracusa MA. Progress in the development of selective nitric oxide synthase (NOS) inhibitors. Curr. Pharm. Des. 2002; 8:177-200.
20. Huang H, Martasek P, Roman LJ, Masters BS, Silverman RB. Q-nitroarginine-containing dipeptide amides. Potent and highly selective inhibitors of neuronal nitric oxide synthase. J. Med. Chem. 1999; 42:3147-3153.
21. Flinspach M, Li H, Jamal J, Yang W, Huang H, Hah J-M, Gomez-Vidal JA, Litzinger EA, Silverman RB, Poulos TL. Structural basis for dipeptide amide isoform-selective inhibition of neuronal nitric oxide synthase. Nature Struct. Mol. Biol. 2004; 11:54-59.
22. Cheng YC, Prusoff WH. Relationship between the inhibition constant (KI) and the concentration of inhibitor which causes 50 per cent inhibition (I50) of an enzymatic reaction. Biochem. Pharmacol. 1973; 22:3099-3108.
23. World Health Organization. Fact sheet on tuberculosis. 2005. Available at: http://www.who.int/mediacentre/factsheets/fs104/en/print.html.
24. Perlman DC, El Sadr WM, Heifets LB, Nelson ET, Matts JP, Chirgwin K, Salomon N, Telzak EE, Klein O, Kreiswirth BN, Musser JM, Hafner R. Susceptibility to levofloxacin of Mycobacterium tuberculosis isolates from patients with HIV-related tuberculosis and characterization of a strain with levofloxacin monoresistance. AIDS 1997; 11:1473-1478.
25. Rattan A, Kalia A, Ahmad N. Multidrng-resistant Mycobac-37. terium tuberculosis: molecular perspectives. Emerging Infect. Dis. 1998; 4:195-209.
26. Pierattelli R, Banci L, Eady NAJ, Bodiguel J, Jones JN, 38. Moody PCE, Raven EL, Jamart-Gregoire B, Brown KA. Enzyme-catalyzed mechanism of isoniazid activation in class I and 39. class III peroxidases. J. Biol. Chem. 2004; 279(37):39000-39009.
27. Quemard A, Sacchettini JC, Dessen A, Vilcheze C, Bittman R, 40. Jacobs WR Jr, Blanchard JS. Enzymatic characterization of the target for isoniazid in Mycobacterium tuberculosis. Biochemistry 1995; 34:8235-8241.41.
28. Zhang Y, Heym B, Allen B, Young D, Cole S. The catalase-peroxidase gene and isoniazid resistance of Mycobacterium tuberculosis. Nature 1992; 358:591-593.42.
29. Johnsson K, King DS, Schultz PG. Studies on the mechanism of action of isoniazid and ethionamide in the chemotherapy of tuberculosis. J. Am. Chem. Soc. 1995; 117:5009-5010.43.
30. Quemard A, Dessen A, Sugantino M, Jacobs MR Jr, Sacchettini JC, Blanchard JS. Binding of catalase-peroxidase-activated isoniazid to wild-type and mutant Mycobacterium tuberculosis enoyl-ACP reductases. J. Am. Chem. Soc. 1996; 118:1561-1562.
31. Rozwarski DA, Grant GA, Barton DHR, Jacobs WR Jr, Sacchettini JC. Modification of the NADH of the isoniazid target (InhA) from Mycobacterium tuberculosis. Science 1998;279:98-102.
32. Musser JM, Kapur V, Williams DL, Kreiswirth BN, van Soolingen D, van Embden JD. Characterization of the catalase-peroxidase gene (katG) and inhA locus in isoniazid-resistant and -susceptible strains of Mycobacterium tuberculosis by automated DNA sequencing: restricted array of mutatins associated with drug resistance. J. Infect. Dis. 1996; 173:196-202.
33. Stewart MJ, Parikh S, Xiao G, Tonge PJ, Kisker C. Structural basis and mechanism of enoyl reductase inhibition by triclosan. J. Mol. Biol. 1999; 290:859-865.47.
34. Sullivan TJ, Truglio JJ, Boyne ME, Novichenok P, Zhang X, Stratton CF, Li H-J, Kaur T, Amin A, Johnson F, Slayden RA, Kisker C, Tonge PJ. High affinity InhA inhibitors with activity against drug-resistant strains of Mycobacterium tuberculosis. ACS Chem. Biol. 2006; 1:43-53.49.
35. Parikh SL, Xiao G, Tonge PJ. Inhibition of InhA, the enoyl-reductase from Mycobacterium tuberculosis, by triclosan and isoniazid. Biochemistry 2000; 39:7645-7650.
36. Cheng YC, Prusoff WH. Relationship between the inhibition constant (KI) and the concentration of inhibitor which causes 50 per cent inhibition (150) of an enzymatic reaction. Biochem. Pharmacol. 1973; 22:3099-3108.
37. Panka DJ, Atkins MB, Mier JW. Targeting the mitogen-activated protein kinase pathway in the treatment of malignant melanoma. Clin. Cancer Res. 2006; 12(7,Pt.2):2371s-2375s.
38. Anderson DH. Role of lipids in the MAPK signaling pathway. Prog. Lipid Res. 2006; 45(2):102-119.
39. Rubinfeld H, Seger R. The ERK cascade as a prototype of MAPK signaling pathways. Methods Mol. Biol. 2004; 250:1-28.
40. Herrera R, Sebolt-Leopold JS. Unraveling the complexities of the Raf/MAP kinase pathway for pharmacological intervention. Trends Mol. Med. 2002; 8:S27-S31.
41. Kyriakis JM, Avuruch J. Mammalian mitogen-activated signal tansduction pathways activated by stress and inflammation. Physiol. Rev. 2002; 81:807-869.
42. Zheng C-F, Guan K. Cloning and characterization of two distinct human extracellular signal-regulated kinase activator kinases, MEK1 and MEK2. J. Biol. Chem. 1993; 268:11435-11439.
43. Sebolt-Leopold JS, Dudley DT, Herrera R, Van Becelaere K, Wiland A, Gowan RC, Tecle H, Barrett SD, Bridges A, Przybranowski S, Leopold WR, Saltiel AR. Blockade of the MAP kinase pathway suppresses growth of colon tumours in vivo. Nat. Med. 1999; 5:810-816.
44. Ohren JF, Chen H, Pavlovsky A, Whitehead C, Zhang E, Kuffa P, Yan C, McConnell P, Spessard C, Banotai C, Mueller WT, Delaney A, Omer C, Sebolt-Leopold J, Dudley DT, Leung IK, Flamme C, Warmus J, Kaufman M, Barrett S, Tecle H, Hasemann CA. Structures of human MAP kinase kinase 1 (MEK1) and MEK2 describe novel noncompetitive kinase inhibition. Nat. Struct. Mol. Biol. 2004; 11:1192-1197.
45. Pauling L. Molecular architecture and biological reactions. Chem. Eng. News 1946; 24:1375-1377.
46. Pauling L. Chemical achievement and hope for the future. Am. Sci. 1948; 36:51-58.
47. Bernhard SA, Orgel LE. Mechanism of enzyme inhibition by phosphate esters. Science 1959; 130:625-626.
48. Jencks WP. Strain and conformation change in enzymatic catalysis. In: Current Aspects of Biochemical Energetics. Kennedy EP, ed. 1966. Academic Press, New York, pp. 273-298.
49. Wolfenden R. Transition state analog inhibitors and enzyme catalysis. Annu. Rev. Biophys. Bioeng. 1976; 5:271-306.
50. Lienhard GE. Enzymatic catalysis and transition-state theory. Science 1973; 180:149-154.
51. Radzicka A, Wolfenden R. Transition state and multisubstrate analog inhibitors. Meth. Enzymol. 1995; 249:284-312.
52. Morrison JF, Walsh CT. The behavior and significance of slow-binding enzyme inhibitors. Adv. Enzymol. Relat. Areas Mol. Biol. 1988; 61:201-301.
53. Szedlacsek SE, Duggleby RG. Kinetics of slow and tight-binding inhibitors. Meth. Enzymol. 1995; 249:144-180.
54. Cha S. Tight-binding inhibitors—III. A new approach for the determination of competition between tight-binding inhibitors and substrates-inhibition of adenosine deaminase by coformycin. Biochem. Pharmacol. 1976; 25:2695-2702.
55. Bitonti AJ, McCann PP, Sjoerdsma A. Restriction of bacterial growth by inhibition of polyamine biosynthesis by using monoflu-oromethylornithine, difluoromethylarginine, and dicyclohexylam- monium sulfate. Biochem. J. 1982; 208(2):435-441.
56. Leveque J, Foucher F, Havouis R, Desury D, Grall J-Y, Moulinoux J-P. Benefits of complete polyamine deprivation in hormone responsive and hormone resistant MCF-7 human breast adenocarcinoma in vivo. Anticancer Res. 2000; 20(1A):97-101.
57. Singh V, Lee JE, Nunez S, Howell PL, Schramm VL. Transition state structure of 5’-methylthioadenosine/S-adenosylhomocysteine nucleosidase from Escherichia coli and its similarity to transition state analogues. Biochemistry 2005; 44:11647-11659.
58. Lee JE, Singh V, Evans GB, Tyler PC, Furneaux RH, Cornell KA, Riscoe MK, Schramm VL, Howell PL. Structural rationale for the affinity of pico- and femtomolar transition state analogues of Escherichia coli 5’-methylthioadenosine/S-adenosylhomocysteine nucleosidase. J. Biol. Chem. 2005; 280:18274-18282.
59. Posmantur R, Wang KKW, Nath R, Gilbertsen RB. A purine nucleoside phosphorylase (PNP) inhibitor induces apoptosis via caspase-3-like protease activity in MOLT-4T cells. Immunophar- macology 1997; 37(2,3):231-244.
60. Montgomery JA. Inhibitors of purine nucleoside phosphorylase. Exp. Opin. Invest. Drugs 1994; 3(12):1303-1313.
61. Ealick SE, Babu YS, Bugg CE, Erion MD, Guida WC, Montgomery JA, Secrist JA III. Proc. Natl. Acad. Sci. U.S.A. 1991; 88:11540-11544.
62. Toms AV, Wang W, Li Y, Ganem B, Ealick SE. Novel multisubstrate inhibitors of mammalian purine nucleoside phosphorylase. Acta Cryst. 2005; D61:1449-1458.
63. Mao C, Cook WJ, Zhou M, Federov AA, Almo SC, Ealick SE. Calf spleen purine nucleoside phosphorylase complexed with substrates and substrate analogues. Biochemistry 1998; 37:7135-7146.
64. Cooper BF, Rudolph FB. Product inhibition applications. Meth. Enzymol. 1995; 249:188-211.
65. Kitz R, Wilson IB. Esters of methanesulfonic acid as irreversible inhibitors of acetylcholinesterase. J. Biol. Chem. 1962; 237:3245-3249.
66. Bayer T. 7-aminocephalosporanic acid—chemical versus enzymatic production process. Asymmetric Catalysis Industrial Scale 2004; 117-130.
67. Kim Y, Hol WGJ. Structure of cephalosporin acylase in complex with glutaryl-7-aminocephalosporanic acid and glutarate: insight into the basis of its substrate specificity. Chem. Biol. 2001; 8(12):1253-1264.
68. Yang YL, Yun DF, Guan YQ, Peng HL, Chen JM, He YS, Jiao RC. Cloning of GL-7-ACA acylase gene from Pseudomonas sp. 130 and its expression in Escherichia coli. Chin. J. Biotechnol. 1991; 7(2):93-104.
69. Luo H, Yu H, Li Q, Shen Z. Cloning and co-expression of D-amino acid oxidase and glutaryl-7-aminocephalosporanic acid acylase genes in Escherichia coli. Enz. Microb. Technol. 2004; 35(6-7):514-518.
70. Huang X, Zeng R, Ding X, Mao X, Ding Y, Rao Z, Xie Y, Jiang W, Zhao G. Affinity alkylation of the Trp-B4 residue of the β-subunit of the glutaryl 7-aminocephalosporanic acid acylase of Pseudomonas sp. 130. J. Biol. Chem. 2002; 277:10256-10264.
71. Loudon GM, Portsmouth D, Lukton A, Koshland DE Jr. The chemistry of the modification of tryptophan with 2-hydroxy-5-nitrobenzyl bromide. J. Am. Chem. Soc. 1969; 91:2792-2794.
72. Silverman RB, Invergo BJ. Mechanism of inactivation of γ-aminobutyrate aminotransferase by 4-amino-5-fluoropentanoic acid. First example of an enamine mechanism for a y-amino acid with a partition ratio of 0. Biochemistry 1986; 25:6817-6820.
73. Qiu J, Silverman RB. A new class of conformationally-rigid analogues of 4-amino-5-halopentanoic acids, potent inactivators of γ-aminobutyric acid aminotransferase. J. Med. Chem. 2000;43: 706-720.
74. Storici P, Qiu J, Schirmer T, Silverman RB. Mechanistic crystallography. mechanism of inactivation of γ-aminobutyric acid aminotransferase by (1 R,3 S,4 S)-3-amino-4-fluorocyclopentane-1-carboxylic acid as elucidated by crystallography. Biochemistry 2004; 43:14057-14063.
Further Reading
Copeland RA. Evaluation of Enzyme Inhibitors in Drug Discovery: A Guide for Medicinal Chemists and Pharmacologist. 2005. Wiley-Interscience, Hoboken, NJ.
Cornish-Bowden A. Fundamentals of Enzyme Kinetics, 3rd edition, 2004. Portland Press, London, UK.
Leskovac V. Comprehensive Enzyme Kinetics. 2003. Kluwer Academic/Plenum, New York.
Robertson JG. Mechanistic basis of enzyme-targeted drugs. Biochemistry 2005; 44(15):5561-5571; 8918.
Segel IH. Enzyme Kinetics: Behavior and Analysis of Rapid Equilibrium and Steady-State Enzyme Systems. 1975. John Wiley & Sons, New York.
Silverman RB. Mechanism-Based Enzyme Inactivation: Chemistry and Enzymology, Vols. I and II. 1988. CRC Press, Boca Raton, FL.
Silverman RB. The Organic Chemistry of Enzyme-Catalyzed Reactions. 2002. Academic Press, San Diego, CA.
Silverman RB. The Organic Chemistry of Drug Design and Drug Actio. 2nd edition. 2004. Elsevier/Academic Press, San Diego, CA.
See Also
Enzyme Catalysis, Chemistry of
Enzyme Kinetics
Enzyme Catalysis, Chemical Strategies for
Enzyme Catalysis, Roles of Structural Dynamics in