CHEMICAL BIOLOGY
Enzyme Kinetics
W. Wallace Cleland, university of Wisconsin, Madison, Wisconsin
doi: 10.1002/9780470048672.wecb159
Enzyme kinetics is an important tool for assaying enzyme activities and for determining enzyme mechanisms. Although other techniques can provide useful information on enzyme mechanisms, the kinetics has to be the ultimate arbiter because it looks at the reaction while it is taking place. Initial velocity patterns, inhibition patterns, patterns of isotopic exchange, pH profiles, and isotope effects are all kinetic tools that allow one to determine kinetic mechanisms, chemical mechanisms, and transition state structures.
All chemical reactions in living cells are catalyzed by enzymes, because it is the only way to control reaction rates. Kinetics is one of the best ways to study enzyme-catalyzed reactions, because one follows the reaction while it takes place. Structural studies such as X-ray structures are extremely helpful in understanding enzymatic catalysis, but the kinetics must be the ultimate arbiter.
Reasons for Study of Enzyme Kinetics
One determines enzyme kinetics for several reasons. First, kinetic assays are needed to measure enzyme activity during purification and to establish that one has an active enzyme. Such assays also allow one to determine the effects of potential drugs as inhibitors. Second, kinetic studies are one of the best ways to determine the mechanism of the reaction, and we will focus in this article mainly on the use of kinetics for this purpose. For determination of mechanism we need:
1. The kinetic mechanism, which is the order of events during a catalytic cycle in terms of the order of substrates combining with and products dissociating from the enzyme. We need to know the complexes that form, how many sites exist, and their specificity for binding reactants. This information is qualitative.
2. The relative rates of steps in the mechanism, which is quantitative information on which steps are rate limiting at high or low concentrations of substrates. Are substrates sticky (that is, react once they combine faster than they dissociate)?
3. The chemical mechanism, which includes the nature of any intermediates and the identification of enzymatic groups involved in binding and catalysis.
4. Transition state structure. Isotope effects will often give a very clear picture of what the transition state looks like for an enzymatic reaction.
One Substrate Concentration Varied
An enzyme has a pocket or cleft in which substrates bind, and usually a flap exists that then closes around the substrates once they are bound. Thus, an enzyme has open and closed conformations, with reactants coming and going from the open form and catalysis taking place in the closed form. As the enzyme and substrate(s) form a complex, the basic rate equation when one substrate concentration is varied (any others being held constant) usually is:
![]()
where v is velocity, V is the maximum velocity when the substrate concentration is saturating, K is the Michaelis constant, and A is the substrate concentration (bold type will indicate concentrations in this article). The Michaelis constant measures affinity in the steady state and is the level of substrate that gives half of V. K can be greater than, smaller than, or the same as the dissociation constant of the substrate. We will assume that the enzyme is operating in the steady state, that is, that the substrate concentrations exceed the enzyme level by at least an order of magnitude, which is normally the situation in an enzyme assay, but for very slow mutants it may not be a valid assumption. Presteady-state studies with enzyme levels equivalent to or exceeding substrate concentrations also require the use of more complicated rate equations.
The usual practice is to measure the initial velocity with which the reaction starts and to determine such initial velocities for separate reaction mixtures containing different levels of substrate. Although it is possible to integrate Equation 1 and determine residual substrate concentrations or product formation as the reaction proceeds, this procedure is subject to more uncertainties as the pH may change or the enzyme may die. The high correlation between the various data points also makes statistical analysis tricky. See References 1 and 2 for a discussion of this method and its problems.
In Equation 1, the rate when A is very high is V, whereas at low A, it is given by:
![]()
where V/K is an apparent first-order rate constant. V and V/K are the two kinetic constants that vary independently with the levels of other substrates, inhibitors and activators, pH, ionic strength, and so forth. K is not an independent constant, but just the ratio of V and V/K. It does indicate the likely concentration of the substrate in vivo, as only in this concentration range does one get proportional control of the rate. At substrate levels well above K, the rate does not vary with substrate concentration, whereas at low substrate concentrations, one is not using the potential activity of the enzyme.
As Equation 1 is not linear, but a rectangular hyperbola, it is usually inverted for graphing purposes to give a double reciprocal plot:
![]()
Thus, 1/v plots linearly against 1/A, with a slope of K/V and a vertical intercept of 1/V. Note that the slope and intercept are the reciprocals of the two fundamental kinetic constants, V/K and V. In the discussion that follows, we will refer to slope and intercept effects, and one needs to keep in mind that these are effects on V/K and V.
Although Equation 3 is the usual form used for graphing, one should not make unweighted least squares fits of the experimental data to it. Such fits require v4 weighting factors if errors in the velocities are thought to be roughly constant or v2 weights if errors are proportional to velocities. The proper fits are made to Equation 1 directly by nonlinear least squares fitting (for constant errors), or to the equation with logarithms taken of both sides if proportional errors in velocities are assumed (3). This situation also applies to all of the rate equations that will be discussed below.
Use of Kinetics for Study of Mechanism
Initial Velocity Studies
The approach outlined above is sufficient when there is only one substrate or in an assay where one varies only the concentration of one substrate. However, where two or more substrates exist and one wants to know the order of their combination with the enzyme, one needs to determine an initial velocity pattern. One varies the concentrations of one substrate at several different levels of a second substrate and determines the initial velocities for the different reaction mixtures. It is, of course, necessary to have the same enzyme level in each reaction or correct the rates to constant enzyme concentration.
Three initial velocity patterns are commonly observed. When both substrates have to add to the enzyme before any products are released, one has a sequential mechanism. The rate equation for most sequential mechanisms is:
![]()
where v is initial velocity; V is maximum velocity; A and B are substrate concentrations; Ka and Kb are Michaelis constants for A and B, and are the levels that give half of V when the other substrate is saturating; and Kia is the dissociation constant of A, the first substrate to add to the enzyme if the mechanism is ordered. If the mechanism is random, a dissociation constant for B of Kib also exists, and KiaKb = KaKib.
Although experimental data should be fitted directly to Equation 4, or to the log form of it if errors in velocities are proportional to velocities, for graphing purposes, Equation 4 is inverted to give:
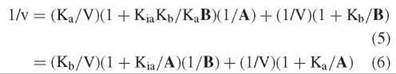
Equation 6 describes an intersecting initial velocity pattern where 1/v is plotted versus 1/A at different values of B, whereas Equation 6 describes the pattern where 1/v is plotted versus 1/B at different values of A (Fig. 1). Both the slopes and the intercepts of the reciprocal plots are functions of the other substrate concentration, and replots of slopes or intercepts versus the reciprocal of the other substrate concentration allow determination of all kinetic constants.

Figure 1. Reciprocal plots with A varied at different levels of B (intersecting initial velocity pattern) or different levels of I (noncompetitive inhibition pattern).
The reciprocal plots in these patterns cross to the left of the vertical axis at
![]()
The crossover point is above the horizontal axis if Ka < Kia, below it if Ka > Kia, and is the same regardless of which substrate concentration is varied.
Sequential mechanisms are typical of kinases and dehydrogenases. Some mechanisms are ordered and some are random, but the initial velocity pattern does not distinguish between them and inhibition studies are required (see below).
When one substrate adds to the enzyme and a product is released before the second substrate adds, one has a ping-pong mechanism, and the rate equation is
![]()
The constant term is missing, which leads to a parallel initial velocity pattern (Fig. 2) regardless of which substrate concentration is varied:
The slopes of the reciprocal plots do not vary with the level of the other substrate, but the intercepts do. Replots of intercepts, and comparison with slopes, allow determination of the kinetic constants.

Figure 2. Reciprocal plots with A varied at different levels of B (parallel initial velocity pattern) or different levels of I (uncompetitive inhibition pattern).
Ping-pong mechanisms are shown by transaminases and nucleoside diphosphate kinase (4). One must be cautious about assuming that a parallel-looking initial velocity pattern represents a ping-pong mechanism, as some sequential mechanisms give patterns in which the crossover point is far down in the third quadrant and the pattern looks parallel. Isotopic exchange studies will distinguish the mechanisms (see below).
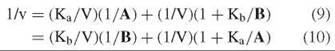
The third type of initial velocity pattern results from a mechanism in which 1) the substrates add in obligatory order and 2) the off-rate constant for the first substrate to bind exceeds the turnover number (V/Et or kcat) sufficiently that its binding is at equilibrium, which is called an equilibrium ordered initial velocity pattern (Fig. 3). The rate equation is
![]()
and in reciprocal form
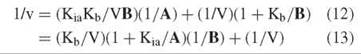

Figure 3. Reciprocal plots with B varied at different levels of A (equilibrium ordered initial velocity pattern) or different levels of I (competitive inhibition pattern).
The patterns are not the same when plotted versus 1/A or 1/B. Equation 13 plots as a pattern intersecting to the left of the vertical axis at 1/V, with the slope at infinite B being zero. That is, a replot of slopes versus 1/B goes through the origin. Equation 13 plots as a pattern intersecting on the vertical axis at 1/V. Note that the differences in the patterns given by Equations 13 and 13 establish the order of combination of the two substrates as well as showing that they add in an obligate order.
Equilibrium ordered mechanisms are rare, because in most ordered sequential mechanisms the off-rate constant of the first substrate to add is not much larger than the turnover number. Examples of equilibrium ordered mechanisms are creatine kinase at pH 7 or below (5), malic enzyme at pH 4 (6), phosphofructokinase with fructose-6-sulfate as an alternate substrate (7), and glycerokinase with amino analogs of glycerol as substrates (8). More common are cases in which reactant A is an activator that cannot dissociate once the substrate adds. In this case, the off-rate constant of the activator need not be large, as the activator is not used up during the reaction and its binding will come to equilibrium in the steady state. An example is the addition of Mn2+ followed by UDP-galactose to lactose synthetase (9).
When three substrates exist for an enzymatic reaction, the usual procedure is to vary the concentration of one of them at fixed levels of a second, with the concentration of the third held constant. This process gives three initial velocity patterns (A-B, A-C, and B-C). The pyruvate dehydrogenase complex shows three parallel patterns as the mechanism is a three-site ping-pong mechanism (10). A number of enzymes show intersecting patterns between two substrates and parallel patterns with either one of these and the third substrate. Examples are synthetases where MgATP and an acid combine to generate an acyl-adenylate intermediate with liberation of Mg-pyrophosphate. The intermediate then reacts with the third substrate to give the final product and AMP. Biotin carboxylases show similar patterns with MgATP and bicarbonate generating carboxy-phosphate that carboxylates biotin with the release of MgADP and phosphate. Carboxy-biotin then carboxylates the accceptor.
Sequential terreactant mechanisms can be ordered, random, or partly random. A fully random mechanism gives only intersecting patterns. An ordered mechanism gives a parallel pattern when the first and third substrate concentrations are varied and the level of the second one is saturating. An example is glutamate dehydrogenase, with NADPH, α-ketoglutarate and ammonia adding in that order (11). The same pattern is seen if the first two substrates add in obligate order, but the third can add randomly. An example is β-hydroxy-β-methylglutaryl-CoA reductase (12). If one substrate must add first, but the other two can add randomly to the EA complex, the A-B pattern becomes parallel at infinite C and the A-C pattern becomes parallel at infinite B. For a detailed description of the kinetics of reactions with three substrates, see Reference 13.
Inhibition Studies
The determination of kinetic mechanisms requires more than just initial velocity patterns, and inhibition studies are usually required. Several types of inhibitors are useful. The products are substrates in the reverse reaction and thus have some affinity for the enzyme and will give inhibition unless their inhibition constants exceed their solubility. Dead-end inhibitors are molecules that play musical chairs with the substrates for open portions of the active site but do not react. Substrates may act as dead-end inhibitors by combining at points in the mechanism where they are not intended and thus cause substrate inhibition. The inhibition patterns caused by these inhibitors are useful in distinguishing between different kinetic mechanisms.
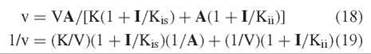
Three common types of inhibition exist. The first causes changes only in V/K and not V. It is called competitive as it results from competition between substrate and inhibitor for binding to the enzyme. The rate equation is
![]()
where V is the apparent maximum velocity, A and I are concentrations of the substrate and the inhibitor, and Kis is the inhibition constant. In reciprocal form, it is
![]()
and it is clear that the inhibition affects only the slopes of reciprocal plots. A series of reciprocal plots versus 1/A at different I intersects on the vertical axis and is called a competitive pattern. A replot of slopes versus I determines Kis from the horizontal intercept.
The second type of inhibition is called uncompetitive and involves effects only on V and not on V/K. The inhibition pattern is a series of parallel lines, and the rate equations are
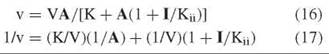
A replot of intercepts versus I determines Kii from the horizontal intercept. This type of inhibition results from combination of the inhibitor with an enzyme form that is present only when the substrate has added to the enzyme. In an ordered sequential mechanism, for example, a dead-end inhibitor resembling the second substrate will give competitive inhibition versus B and uncompetitive inhibition versus A. Such patterns help to establish the order of substrate combination.
The third type of inhibition is called noncompetitive and involves effects on both V and V/K, although not necessarily to the same degree. The rate equations are
The inhibition pattern is a series of lines intersecting to the left of the vertical axis. The crossover point is above the horizontal axis if Kis < Kii and below it if Kis > Kii. Replots of slopes or intercepts versus I determine Kis or Kii from the horizontal intercept.
Noncompetitive inhibitions result from combination of the inhibitor with an enzyme form other than the one the substrate combines with, and one that is present at both high and low levels of the substrate. An example is a dead-end inhibitor resembling the first substrate in an ordered mechanism. It is competitive versus A, but noncompetitive versus B, because B cannot prevent the binding of the inhibitor to free enzyme. In a random mechanism, an inhibitor binding at one site is noncompetitive versus a substrate binding at another site.
Competitive and noncompetitive inhibitions are the most common types, especially for product inhibitors. The first product (P) released in an ordered mechanism, for example, gives noncompetitive inhibition versus either substrate A or B as the result of partially reversing the reaction. This result can occur at either low or high levels of substrate, and thus V/K as well as V is affected. A dead-end inhibitor combining with EQ in the same fashion, however, gives uncompetitive inhibition because it cannot reverse the reaction.
Substrate inhibition is caused by the substrate acting as a dead-end inhibitor, which is most common in the nonphysiological direction of the reaction. When the concentration of the substrate giving the inhibition is varied, the rate equation is
![]()
The reciprocal plot is no longer linear, but is a hyperbola, rising asymptotically with the vertical axis (Fig. 4).

Figure 4. Substrate inhibition (reciprocal form of Eq. 20). Note that the asymptote, which defines Km and V, lies the same distance from the curve as the vertical axis. The usual error is to draw it too close to the curve.
Substrate inhibition normally occurs only in mechanisms with two substrates or products. When one substrate (A) in a ping-pong mechanism combines with the stable enzyme form that B normally adds to, it causes competitive substrate inhibition (that is, only the slopes of reciprocal plots vs. 1/B show inhibition). In an ordered sequential mechanism, it is typical for substrate B to look like the first product P (alcohol and aldehyde for an alcohol dehydrogenase). If B combines with the EQ complex and prevents release of Q, it will give uncompetitive substrate inhibition versus A (that is, only the intercepts of reciprocal plots vs. 1/A will show inhibition). In a random mechanism, combination of one substrate at the binding site of the other causes competitive substrate inhibition. For example, with adenylate kinase, AMP shows competitive substrate inhibition versus MgATP by combining at the MgATP site (14). In the reverse reaction, free ADP gives competitive substrate inhibition versus MgADP. MgATP and MgADP do not show substrate inhibition as they are too large to fit into the site for AMP or ADP.
Isotopic Exchange
Initial velocity and inhibition patterns involve following the chemical reaction catalyzed by an enzyme. In isotopic exchange studies, one follows the transfer of label between reactants at equilibrium, or from product back into substrate while the reaction is proceeding. In ping-pong mechanisms, exchange occurs without all reactants being present. Thus, one can observe an exchange between A and P in the absence of B and Q and vice versa. The reaction comes rapidly to equilibrium as indicated by E + A = F + P, where A and P are the reactants between which exchange takes place and E and F are the two stable enzyme forms. Observation of such exchanges establishes a ping-pong mechanism as long as Equation 21 holds.
![]()
V*AP and V*BQ are the maximum exchange rates given by Equations 24 and 24, whereas V1 and V2 are the maximum velocities of the chemical reaction in the two directions as given by equations such as Equation 8.
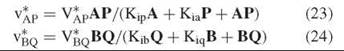
The forms of Equations 24 and 24 resemble that of Equation 8, and reciprocal plots of exchange rate versus the level of one reactant at fixed levels of the other will give a parallel pattern. The kinetic constants determined are dissociation constants, rather than Michaelis constants, as the exchange takes place at equilibrium. One can vary the levels of reactants freely, because equilibrium is maintained by the ratio of E and F.
In more complicated ping-pong mechanisms where two substrates combine before release of one or two products, the exchange pattern between a substrate and product when A and B levels are varied will tell whether the addition of A and B is ordered or random. For example, with a synthetase where MgATP reacts with an acid to give Mg-pyrophosphate and an acyl-adenylate, one can observe exchange between pyrophosphate and ATP at different levels of MgATP and acid at a fixed level of Mg-pyrophosphate. If MgATP levels are varied at fixed levels of acid, one has three cases:
1. The mechanism is ordered with MgATP as A and the acid as B. One sees an intersecting pattern with uncompetitive substrate inhibition by B.
2. The mechanism is ordered with the acid as A and MgATP as B. One sees an equilibrium ordered pattern (Eq. 13).
3. The mechanism is random. One sees an intersecting pattern with no substrate inhibition.
With sequential mechanisms, one can follow isotopic exchange at equilibrium only if one varies the levels of one substrate and one product at a constant ratio and has all reactants present. The usual protocol is to vary the concentrations of like reactants together at fixed levels of the others and determine exchange rates. For example, with an alcohol dehydrogenase, one varies the levels of NAD and NADH together and alcohol and aldehyde together. One determines exchange between NAD and NADH, and between alcohol and aldehyde. In an ordered mechanism, reciprocal plots of exchange rate versus reciprocal levels of reactants are linear when A and Q levels are varied together, and the plots for the A-Q and B-P exchanges have the same apparent dissociation constant (the plots cross on the horizontal axis). The B-P exchange is faster. When the levels of B and P are varied together, the reciprocal plots for A-Q exchange and B-P exchange are parallel, but the A-Q exchange shows total substrate inhibition (Eq. 20), which is a very sensitive test for an ordered mechanism, as partly random ones will not show complete substrate inhibition, and the apparent dissociation constants when A and Q levels are varied together will not show the same dissociation constants for the two exchanges.
Random mechanisms will not show substrate inhibition of exchanges unless the levels of reactants that can form an abortive complex are varied together. The relative rates of the two exchanges will show whether catalysis is totally rate limiting (a rapid equilibrium random mechanism), or whether release of a reactant is slower. For kinases that phosphorylate sugars, the usual pattern is for sugar release to be partly rate limiting, but for nucleotides to dissociate rapidly (15, 16).
It is also possible in a sequential mechanism to follow the exchange of label from a product back into substrate while the reaction is occurring. Only the first product to be released will exchange back into substrate, which allows determination of the order of product release (17).
pH Studies
The pH variation of kinetic parameters allows one to identify enzyme groups required for binding or catalysis. The parameters that are plotted versus pH are log(V/K), log(V), and pKi [log (1/Ki)], where K is the dissociation constant of substrates, other than the last one to add to the enzyme, or of competitive inhibitors. Any pK values seen in a pKi profile have their correct values for the enzyme form involved or the molecule that is binding, as Ki is an equilibrium dissociation constant.
The log(V/K) profile shows the pKs of groups in substrate or enzyme required for binding, as well as ones involved in catalysis (Fig. 5). Thus, if a substrate binds only as a dianion, the V/K profile will decrease a factor of 10 per pH units below the pK of the substrate. If a group on the enzyme has a required protonation state for catalysis, this pK will also appear. The pKs seen in V/K profiles may not appear at their true values if the substrate is sticky (that is, reacts to give products as fast or faster than it dissociates). The pK will be displaced outward on the profile by log (1 + Sr), where Sr is the stickiness ratio (the ratio of the net rate constant to produce the first product and the off-rate constant for the substrate). Comparison of pKs in V/K and pKi profiles allows one to determine stickiness of the substrate.
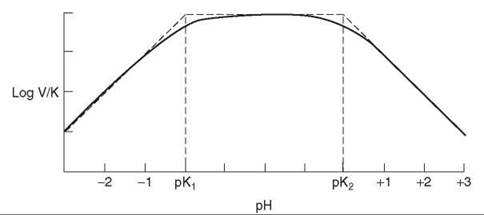
Figure 5. pH profile of log(V/K) when two groups exist whose state of ionization affects binding or catalysis. At the pK values, the curve lies 0.3 below the intersection points of the asymptotes.
The log V profile shows only the pKs groups responsible for the catalytic reaction after the substrate has bound and the pKs are typically displaced from values seen in free enzyme or substrate. The pKs of neutral acids (carboxyl, sulfhydryl, phosphate) are elevated by a pH unit or more by being removed from solvent. Specific hydrogen bonding interactions can displace a pK either upwards or downwards by 1-2 pH units. For fumarase, for example, the pK of the group (probably a carboxyl) that removes the proton during reaction of malate is elevated by binding of either malate or fumarate, whereas the pK of the group that protonates the OH of malate to give water is elevated by 2 pH units by the binding of malate, and lowered by 2 units by the binding of fumarate (18).
Another reason for displaced pK values in log V profiles is the switch in rate-limiting steps. If the catalytic step that is pH-sensitive is 10-fold faster than pH-independent second product release at neutral pH, the pKs in the log V profile will be displaced outward by one pH unit, as catalysis has to be slowed by an order of magnitude before it becomes rate limiting.
pH profiles are log-log plots and consist of horizontal lines (when all groups are properly protonated) and lines with slopes of 1, 2, -1, -2, and so on. These segments are connected with a curved portion 2 pH units wide that is centered on the pK. If protonation causes loss of binding or catalysis, the profile decreases a factor of 10 per pH unit below the pK. If deprotonation does the same, the profile drops at high pH. When one group must be protonated and the other unprotonated, the profile will drop at both low and high pH. In this case, when the pKs are not far apart, one cannot tell from the pKs which group has to be protonated and which has to be unprotonated for activity. When the group with the lower pK has to be protonated and the one with the higher pK unprotonated, one has reverse protonation. The profile will have the same shape as if the other protonation states were required, but the amplitude will differ, which is evident in the V/K profiles for fumarase (18). As the equilibrium constant is pH-independent in the neutral pH range, the V/Kmalate and V/Kfumarate profiles are identical, with apparent pKs of 5.7 and 7.1. For reaction of malate, the low pK group must be ionized and the other one protonated, whereas for reaction of fumarate, the states of protonation have to be reversed. This reversal is the typical situation when acid-base catalysis is involved in enzymatic reactions.
Isotope Effects
Isotope effects result from replacing the normal isotopes of hydrogen, carbon, nitrogen, or oxygen with deuterium or tritium, 13C, 14C, 15N, or 18O. The effects of such replacements are expressed as klight/kheavy for kinetic isotope effects, or Keq light/Keq heavy for equilibrium isotope effects. Equilibrium isotope effects compare the stiffness of bonding of the isotopic atom in product versus substrate, whereas kinetic ones compare the transition state to the substrate. The heavy isotope enriches in the more stiffly bonded position and the light isotope effect in the less stiffly bonded position.
Equilibrium isotope effects are normal (>1.0) if the substrate is more stiffly bonded and inverse (<1.0) if the product is more stiffly bonded. Primary kinetic isotope effects are almost always normal, as the atom being transferred is more weakly bonded in the transition state. Isotope effects in positions not subject to bond breaking or making are secondary and are good tools for determining transition state structure. They may be either normal or inverse.
Isotope effects on enzymatic mechanisms are determined for each V/K value and for V. A leading superscript indicates the nature of the isotope effect. Thus D(V/K) is a deuterium isotope effect on V/K (the value for unlabeled substrate divided by that for deuterated substrate). The leading superscripts used by enzymologists are D, T, 13, 14, 15, 18 for deuterium; tritium; and 13C, 14C, 15N, and18O isotope effects. Isotope effects on V/K are the most commonly used ones, and we will focus on them.
Three methods for determining isotope effects exist. The first is direct comparison of reciprocal plots for unlabeled and deuterated substrate. This method is the least precise and is practical only for deuterium isotope effects of 1.1 or higher. However, it determines the isotope effect on the substrate whose concentration is varied (even if it is not the labeled one) and is the only method that gives the isotope effect on V.
The second method is internal competition. This method is used for tritium and 14C isotope effects where the label is a trace one and only determines isotope effects on V/K for the labeled substrate. It is also used for 13C, 15N, and 18O isotope effects by following changes in the 1.1%, 0.37%, and 0.2% natural abundance of these isotopes. One compares the specific activity or mass ratio of the product or residual substrate at a fraction of reaction f from 0.3-0.5 with those of the original substrate
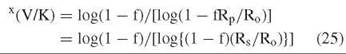
where x indicates the isotope and Ro and Rp and Rs are mass ratios in initial substrate, product at fraction of reaction f, or residual substrate at f. This method is the most precise way to determine isotope effects, especially when the isotope ratio mass spectrometer is used to determine the heavy atom isotope effects (errors of 0.0002 are feasible).
The third method for measuring isotope effects is equilibrium perturbation (19). In this method, one adds enzyme to a reaction mixture calculated to be at equilibrium containing a labeled substrate and an unlabeled product. For a normal isotope effect, the unlabeled product reacts faster than the labeled substrate and causes a perturbation from equilibrium. As isotopic mixing takes place, however, the reaction comes back to chemical as well as isotopic equilibrium. The size of the perturbation is used to compute the isotope effect. This method is of intermediate precision, but can be used for isotope effects of 1.03 or greater. The isotope effect that is determined is similar to a V/K one.
The equation that governs the isotope effect seen on an enzymatic reaction is:
![]()
where x indicates the nature of the isotope effect and xk is the intrinsic isotope effect on the isotope-sensitive step. The constants cf and cr are commitments to catalysis, and each is the ratio of the rate of the catalytic step to the net rate constant for release of a reactant from the enzyme. For direct comparison studies, cf is for the varied substrate, while for internal competition it is for the labeled reactant. In both cases, cr is for the first product released. For equilibrium perturbation experiments, cf and cr are for the perturbants, the molecules between which the label is exchanged.
It is clear from Equation 26 that unless the commitments are small, one does not determine the intrinsic isotope effect on the isotope-sensitive step. Two methods have been used to calculate intrinsic isotope effects. Northrop’s method involves comparison of deuterium and tritium isotope effects on V/K, as a tritium isotope effect is the 1.44 power of the deuterium one
![]()
This equation is exact only if cr is zero or DKeq is unity, but gives approximate answers otherwise. It works only for deuterium and tritium isotope effects.
The other method for determining intrinsic isotope effects involves measuring deuterium and 13C isotope effects on the same step (21). Equation 26 is used for primary and secondary deuterium isotope effects, and for 13C isotope effects with unlabeled and primary or secondary deuterated substrates. In the latter cases, the commitments are reduced by the size of the intrinsic deuterium isotope effects, which gives five equations in the five unknowns prl-Dk, sec-Dk, 13k, cf, and cr. Although the errors for the intrinsic isotope effects are reasonable, those on cf and cr are large, but their sum is well determined (22). For irreversible decarboxylations where cr is small, one needs only the primary deuterium isotope effect and the 13C one with unlabeled and deuterated substrates to solve for pri-Dk,13k, and cf.
The variation of cf in Equation 26 with the level of a second substrate is a powerful tool for determination of kinetic mechanism (23). In an ordered mechanism, D(V/Kb) for the second substrate is independent of the level of A, the first substrate. The apparent value of D(V/Ka), however, varies from D(V/Kb) at low levels of B to unity at saturating B. In a random mechanism, both V/K isotope effects are finite, although they may not have the same value if one substrate is sticky or stickier than the other.
Isotope effects are useful in determining chemical mechanisms. In an oxidative decarboxylation where a hydride ion is removed from one carbon and CO2 is lost from another, one can tell whether the reaction is concerted or stepwise by the effect of deuteration on the 13C isotope effect in the CO2 (21). In a concerted mechanism, deuteration makes the chemical step more rate limiting, and one will see a larger 13C isotope effect, or the same one if commitments were small to start with. In a stepwise mechanism, however, deuteration of the substrate makes the decarboxylation step less rate limiting and thus diminishes the size of the observed isotope effect.
If an appreciable equilibrium deuterium isotope effect exists on a stepwise mechanism (>1.1), one can tell which step comes first. In the direction where the deuterium-sensitive step comes first (21),
![]()
whereas in the reverse direction with the 13C-sensitive step first,
![]()
These are really the same equation, but Equation 28 is expressed in terms of parameters of the forward reaction and Equation 29 in terms of ones for the reverse reaction.
The size of intrinsic isotope effects can be used to determine transition state structure. For example, in the concerted oxidative decarboxylation catalyzed by prephenate dehydrogenase, a large deuterium isotope effect (7.3) but a small 13C one (1.5%) indicates an asynchronous transition state with considerable C-H bond cleavage, but only a small degree of C-C cleavage, as most decarboxylations show ~5% 13C isotope effects (24). The shift in isotope effects as the redox potential of the nucleotide substrate was changed (thus changing Keq) for the formate dehydrogenase reaction showed that the transition state became earlier as Keq increased (25). Similar results were seen with liver alcohol dehydrogenase (26).
References
1. Orsi BA, Tipton KF. Kinetic analysis of progress curves. Methods Enzymol. 1979; 63:159-183.
2. Duggleby RG. Analysis of enzyme progress curves by nonlinear regression. Methods Enzymol. 1995; 249:61-90.
3. Cleland WW. Statistical analysis of enzyme kinetic data. Methods Enzymol. 1979; 63:103-138.
4. Garces E, Cleland WW. Kinetic study of yeast nucleosidediphos- phate kinase. Biochemistry 1969; 8:633-640.
5. Schimerlik MI, Cleland WW. Inhibition of creatine kinase by chromium nucleotides. J. Biol. Chem. 1973; 248:8418-8423.
6. Schimerlik MI, Cleland WW. The pH variation of the kinetic parameters and the catalytic mechanism of malic enzyme. Biochemistry 1977; 16:576-583.
7. Martensen TM, Mansour TE. Studies on heart phosphofructokinase. Use of fructose 6-sulfate as an alternative substrate to study the mechanism of action and active site specificity. J. Biol. Chem. 1976; 251:3664-3670.
8. Knight WB, Cleland WW. Thiol and amino analogs as alternate substrates for glycerokinase from Candida mycoderma. Biochemistry 1989; 28:5728-5734.
9. Morrison JF, Ebner KE. Studies on galactosyltransferase. Kinetic investigations with n-acetylglucosamine as the galactosyl group acceptor. J. Biol. Chem. 1971; 246:3977-3984.
10. Tsai CS, Burgett MW, Reed LJ. a-Keto Acid dehydrogenase complexes. XX. A kinetic study of the pyruvate dehydrogenase complex from bovine kidney. J. Biol. Chem. 1973; 248:8348-8352.
11. Rife JE, Cleland WW. Kinetic mechanism of glutamate dehydrogenase. Biochemistry 1980; 19:2321-2328.
12. Qureshi N, Dugan RE, Cleland WW, Porter JS. Kinetic analysis of the individual reductive steps catalyzed by β-hydroxy-β-methyl-glutaryl-coenzyme A reductase obtained from yeast. Biochemistry 1976; 15:4191-4197.
13. Viola RE, Cleland WW. Initial velocity analysis for terreactant mechanisms. Methods Enzymol. 1982; 87:353-366.
14. Khoo JC, Russsel PJ Jr. Adenylate kinase from bakers’ yeast. IV. Substrate and inhibitor structural requirements. J. Biol. Chem. 1970; 245:4163-4167.
15. Gulbinsky JS, Cleland WW. Kinetic studies of Escherichia coli galactokinase. Biochemistry 1968; 7:566-575.
16. Raushel FM, Cleland WW. Determination of the rate-limiting steps and chemical mechanism of fructokinase by isotope exchange, isotope partitioning, and pH studies. Biochemistry 1977; 16:2176-2181.
17. Haas LF, Byrne WL. The mechanism of glucose-6-phosphatase. J. Am. Chem. Soc. 1960; 82:947-954.
18. Brandt DA, Barnett LB, Alberty RA. The temperature dependence of the steady state kinetic parameters of the fumarase reaction. J. Am. Chem. Soc. 1963; 85:2204-2209.
19. Cleland WW. Measurement of isotope effects by the equilibrium perturbation technique. Methods Enzymol. 1980; 64:104-125.
20. Northrop DB. Steady-state analysis of kinetic isotope effects in enzymic reactions. Biochemistry 1975; 14:2644-2651.
21. Hermes JD, Roeske CA, O’Leary MH, Cleland WW. Use of multiple isotope effects to determine enzyme mechanisms and intrinsic isotope effects. Malic enzyme and glucose-6-phosphate dehydrogenase. Biochemistry 1982; 21:5106-5114.
22. Hermes JD, Cleland WW. Evidence from multiple isotope effect determinations for coupled hydrogen motion and tunneling in the reaction catalyzed by glucose-6-phosphate dehydrogenase. J. Am. Chem. Soc. 1984; 106:7263-7264.
23. Cook PF, Cleland WW. Mechanistic deductions from isotope effects in multireactant enzyme mechanisms. Biochemistry 1981; 20:1790-1796.
24. Hermes JD, Tipton PA, Fisher MA, O’Leary MH, Morrison JF, Cleland WW. Mechanisms of enzymatic and acid-catalyzed decarboxylations of prephenate. Biochemistry 1984; 23:6263-6275.
25. Hermes JD, Morrical SW, O’Leary MH, Cleland WW. Variation of transition-state structure as a function of the nucleotide in reactions catalyzed by dehydrogenases. 2. Formate dehydrogenase. Biochemistry 1984; 23:5479-5488.
26. Scharschmidt M, Fisher MA, Cleland, WW. Variation of transition-state structure as a function of the nucleotide in reactions catalyzed by dehydrogenases. 1. Liver alcohol dehydrogenase with benzyl alcohol and yeast aldehyde dehydrogenase with benzaldehyde. Biochemistry 1984; 23:5471-5478.
Further Reading
Cook PF, Cleland WW. Enzyme Kinetics and Mechanism. 2007. Garland Science, Taylor & Francis Group, LLC, New York.
See Also
Enzyme Inhibition, Mechanisms of
Enzyme Inhibition, Tools to Study
Enzyme Kinetics, Techniques to Study
Kinetic Isotope Effects
Enzyme Catalysis, Chemistry of