MCAT Organic Chemistry Review: For MCAT 2015 (Graduate School Test Preparation) - P.J. Alaimo, Ph.D. 2015
Lab Techniques: Separations and Spectroscopy
5.1 SEPARATIONS
Extractions
One of the more useful techniques in experimental organic chemistry is solvent extraction. Isolation of natural products from marine organisms, plants, and other natural sources is facilitated by exploiting the particular solubilities of organic compounds in various solvents. Complex mixtures of organic compounds can be separated using careful choice of solvents based on the differential solubilities of the various components of the mixture. We’ll see that the acid/base properties of organic molecules play an important role in the extraction process.
Extraction allows the chemist to separate one substance from a mixture of substances by adding a solvent in which the compound of interest is highly soluble. If the solution containing the compound of interest is shaken with a second solvent (completely immiscible with the first) and allowed to separate into two distinct phases, the compound of interest will distribute itself between the two phases based upon its solubility in each of the individual solvents. This is called a liquid-liquid extraction. The ratio of the substance’s solubilities in the two solvents is called the distribution (or partition) coefficient.
Solubility largely depends on two things: the polarity of the solute and the polarity of the solvent. When it comes to solubility, like dissolves like. Polar molecules are soluble in polar solvents, and nonpolar molecules are soluble in nonpolar solvents. For example, water is a polar solvent and hydrocarbons are nonpolar molecules. Hydrocarbons will therefore have very low solubility in water.
The simplest liquid-liquid extraction is accomplished when an organic compound is extracted with water. A simple water extraction can remove substances that are highly polar or charged, including inorganic salts, strong acids and bases, and polar, low molecular weight compounds (less than five carbons) such as alcohols, amines, and carboxylic acids.
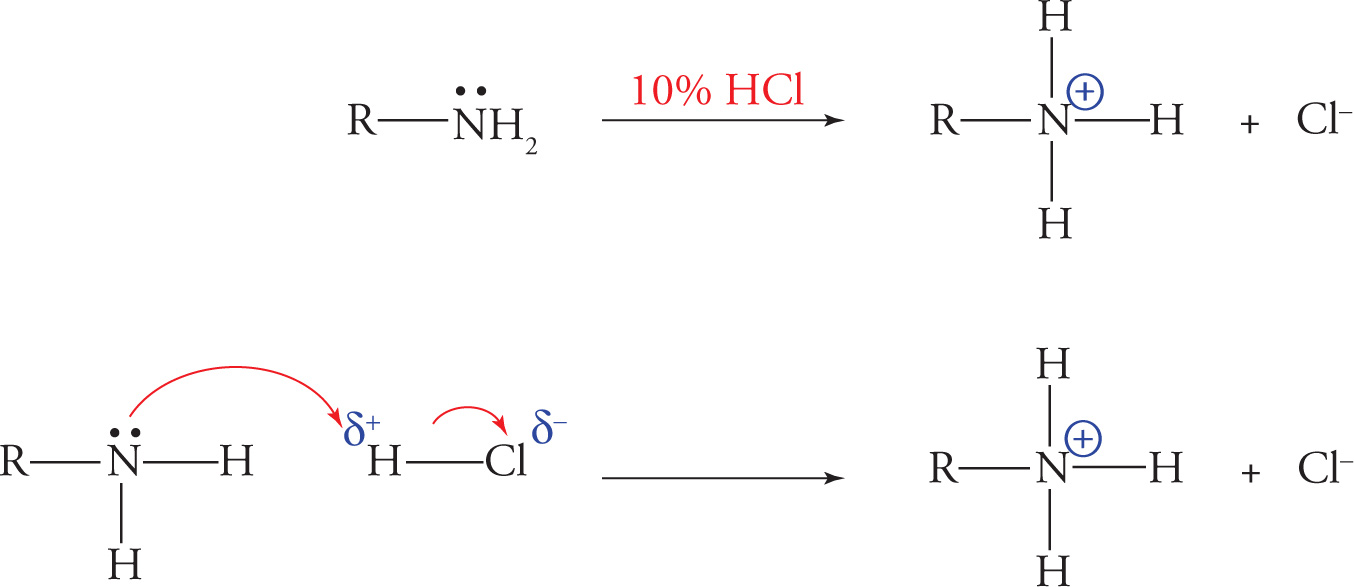
A second class of organic extraction involves the use of acidic or basic water solutions. Organic compounds that are basic (e.g., amines) can be extracted from mixtures of organic compounds upon treatment with dilute acid (usually 5—10% HCl). This treatment will protonate the basic functional group, forming a positively charged ion. The resulting cationic salts of these basic compounds are usually freely soluble in aqueous solution and can be removed from the organic compounds that remain dissolved in the organic phase.
Extraction of Organic Amines
On the other hand, extraction with a dilute weak base—typically 5 percent sodium bicarbonate (NaHCO3) —results in converting carboxylic acids into their corresponding anionic salts.
Extraction of Carboxylic Acids
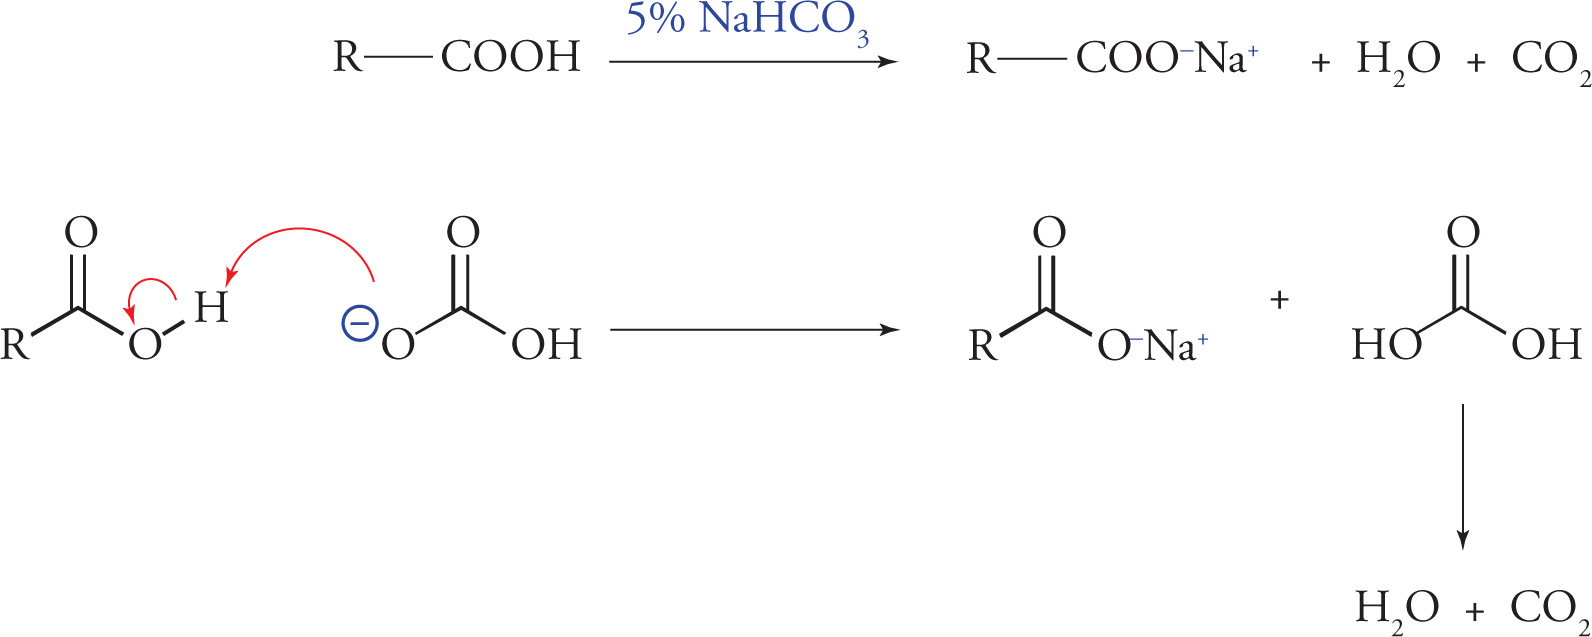
These anionic salts are generally soluble in aqueous solution and can be removed from the organic compounds that remain dissolved in the organic phase. Dilute sodium hydroxide could also be used for this kind of extraction, but it is basic enough to also convert phenols into their corresponding anionic salts. When phenols are present in a mixture of organic compounds and need to be removed, a dilute sodium hydroxide solution (usually about 10%) will succeed in converting phenols into their corresponding anionic salts. The anionic salts of the phenols are generally soluble in the aqueous phase and can therefore be removed from the organic phase.
Extraction of Phenols
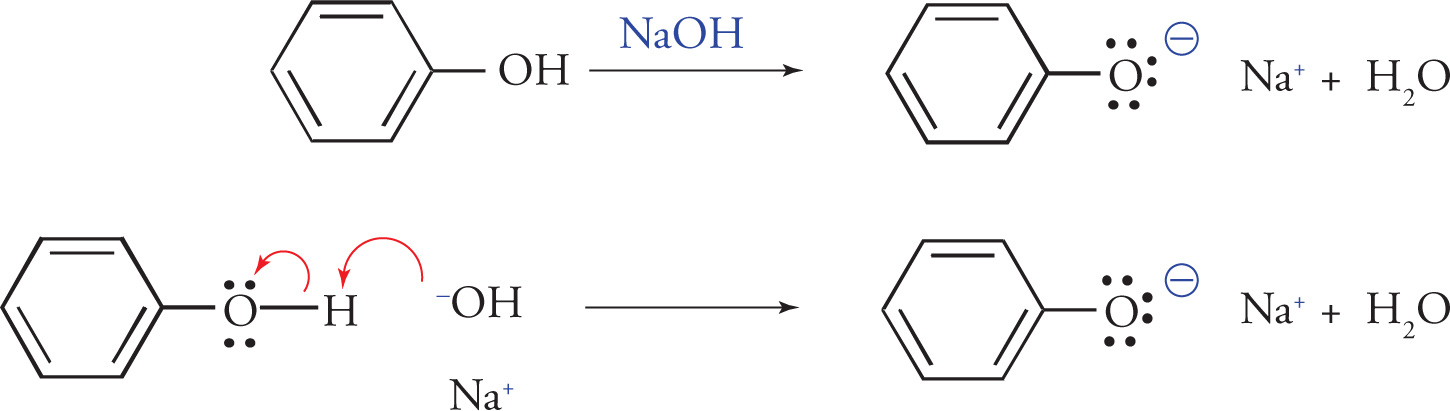
(Note: NaOH will also extract carboxylic acids.)
The apparatus in which these extractions are typically carried out is called a separatory funnel. To perform a solvent-solvent extraction, the solution containing the mixture of organic compounds and the extraction solvent of choice are poured into the separatory funnel, and the apparatus is fitted with a stopper. After mixing, the two layers may be separated from one another by removing the stopper at the top and slowly collecting each phase into separate receiving flasks by opening the stopcock at the bottom of the funnel.
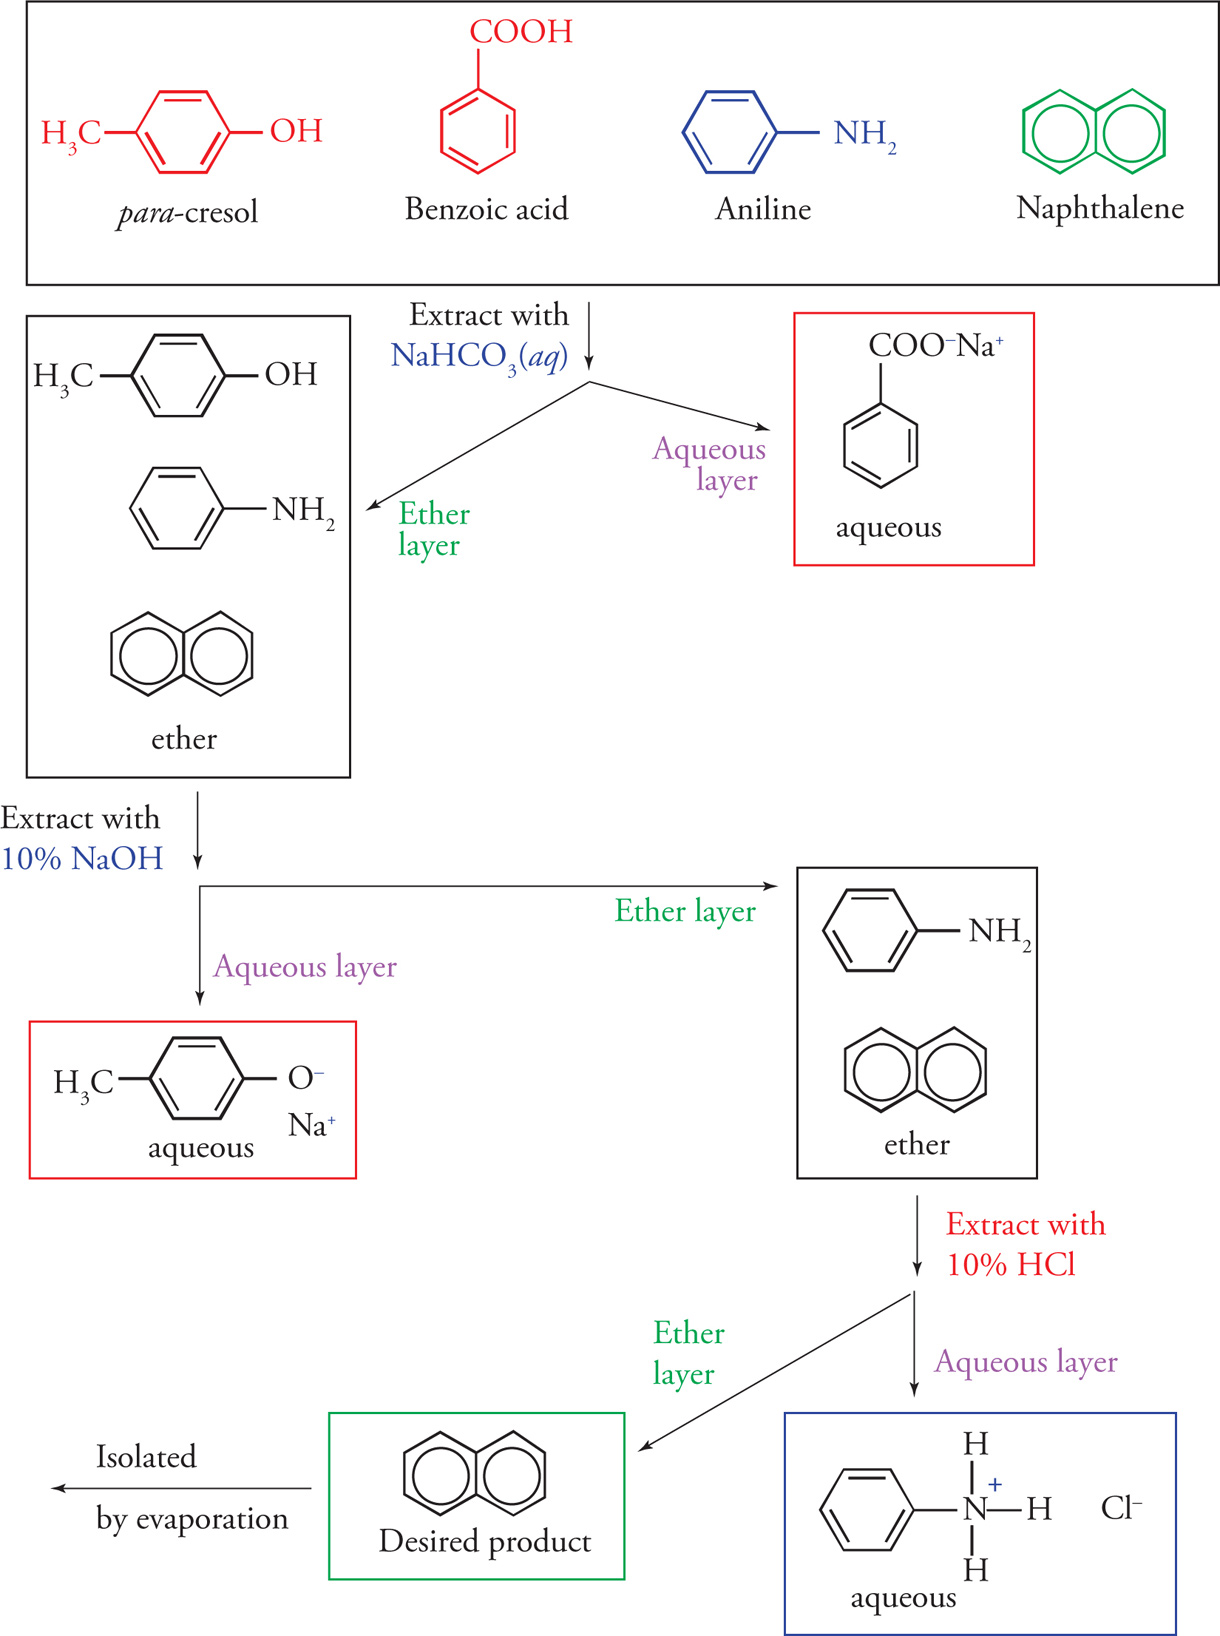
As an example, let us step through an extraction that will separate four organic compounds from one another. The original mixture consists of para-cresol, benzoic acid, aniline, and naphthalene, all of which are dissolved in diethyl ether. This mixture is first extracted with an equal volume of aqueous sodium bicarbonate. The weakly basic bicarbonate is sufficiently basic to deprotonate benzoic acid and convert it to an anionic salt, but not strong enough to deprotonate para-cresol (a phenol). Likewise, a bicarbonate extraction will not affect aniline (a base itself) or naphthalene (a hydrocarbon). Thus, para-cresol, aniline, and naphthalene will remain dissolved in the ether phase, while the benzoic acid, now in its anionic salt form, will be extracted into the aqueous layer.
The ether layer, which now contains three components, is extracted with a sodium hydroxide solution. The strongly basic hydroxide ion is strong enough to deprotonate para-cresol and convert it to its anionic salt form. The basic conditions will not affect aniline or naphthalene, so para-cresol is the only compound that is extracted into the aqueous phase. The aniline and naphthalene will remain dissolved in the ether layer.
Finally, the remaining two components can be separated from one another by an acidic extraction with a 10% HCl solution. The solution is acidic enough to protonate the lone pair of electrons of aniline and to convert aniline to its cationic salt. Naphthalene will not be affected and will remain dissolved in the ether layer. The final extraction of aniline into the aqueous phase completes the separation. Naphthalene can be isolated by evaporating off the diethyl ether.
These steps are summarized on the following page.
All four components dissolved in diethyl ether
Chromatography
While there are many types of chromatography, they all have a number of basic features in common. All types of chromatography are used to separate mixtures of compounds, though some are used mostly for identification purposes, while others are generally used as purification methods. First, we will consider thin-layer chromatography to outline the basic features. Then we will describe several other types, highlighting for each how the separation process works and the types of compounds that are most commonly separated by that method.
Thin-Layer Chromatography (TLC)
In TLC, compounds are separated based on differing polarities. Because of the speed of separation and the small sample amounts that can be successfully analyzed, this technique is frequently used in organic chemistry laboratories. Thin-layer chromatography is a solid-liquid partitioning technique in which the mobile liquid phase ascends a thin layer of absorbant (generally silica, SiO2) that is coated onto a supporting material such as a glass plate. This thin layer of absorbant acts as a polar stationary phase for the sample to interact with. To perform TLC, a very small amount (about 1 microliter) of sample is spotted near the base of the plate (about 1 cm from the bottom) before placing the plate upright in a sealed container with a shallow layer of solvent.
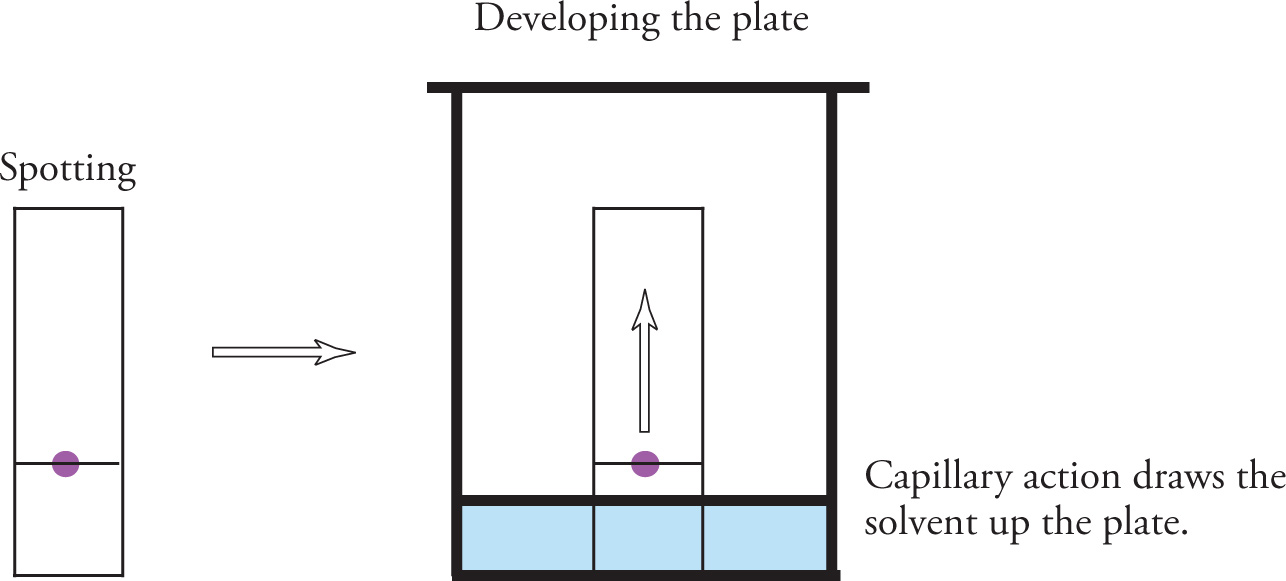
As the solvent slowly ascends the plate via capillary action, the components of the spotted sample are partitioned between the mobile phase and the stationary phase. This process is referred to as developing, or running, a thin layer plate. Each component of the sample experiences many equilibrations between the mobile and the stationary phases as the development proceeds.
Separation of the compounds occurs because different components travel along the plate at different rates. The more polar components of the mixture interact more with the polar stationary phase and travel at a slower rate. The less polar components have a greater affinity for the solvent than the stationary phase and travel with the mobile solvent at a faster rate than the more polar components. Once the solvent nearly reaches the top of the plate, the plate is removed and allowed to dry. If the compounds in the mixture are colored, we would see a vertical series of spots on the plate; however, it is more likely that the components are not colored and need to be detected by some other means. Visualization methods include shining ultraviolet light on the plate, placing the thin layer plate in the presence of iodine vapor, and a host of other chemical staining techniques.
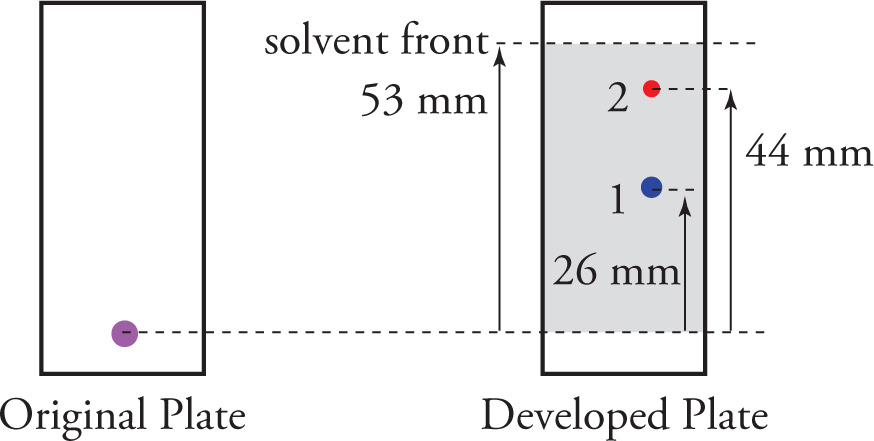
Once the separated components have been visualized, Rf values can be computed. This “ratio to front” value (Rf) is simply the distance traveled by an individual component divided by the distance traveled by the solvent front. For example, from the illustration above, we would find
Rf (Compound 1) = 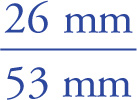 = 0.49
Rf (Compound 2) = 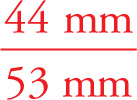 = 0.83
(Note that Rf is always positive and never greater than 1.)
Column (Flash) Chromatography
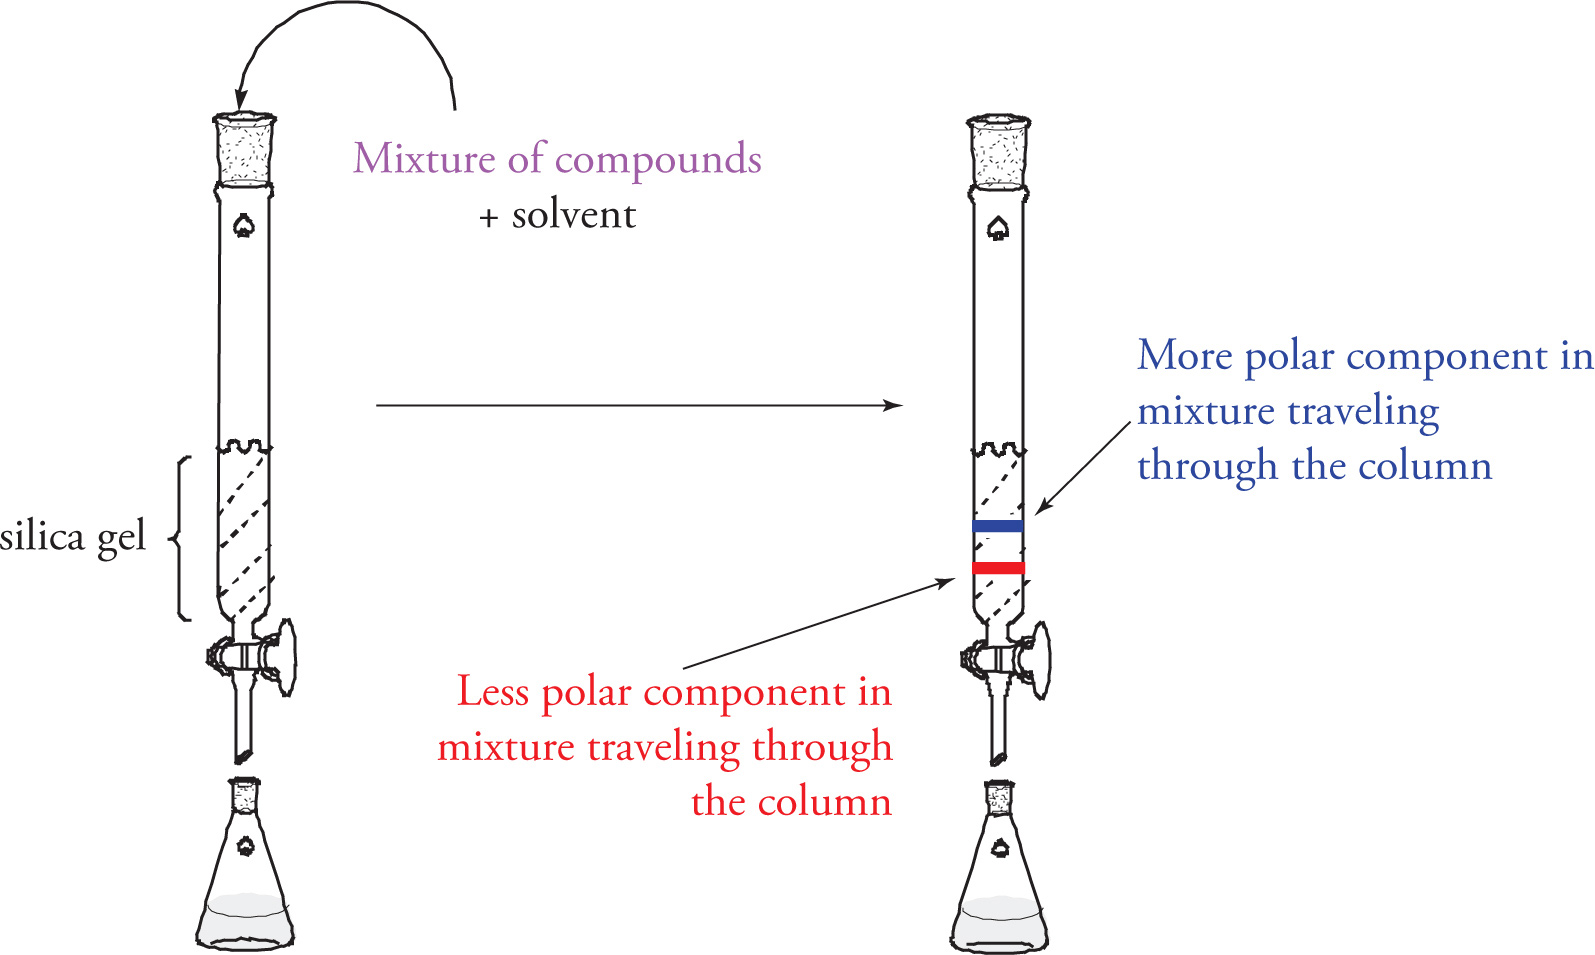
While TLC is a good technique for separating very small amounts of material in order to assess how many compounds make up a mixture, it’s not a good technique for isolating bulk compounds. A common technique known as column or flash chromatography employs the same principles behind TLC toward just such a goal. Shown below is a chromatography column. This column is filled with silica gel (predominantly SiO2, as in the TLC plate). The silica gel is saturated with a chosen organic solvent, and the mixture of compounds to be separated is then added to the top and allowed to travel down through the silica-packed column. Excess solvent is periodically added to the top of the column, and the flow of solvent (along with the separated compounds) is collected from the bottom. Just as is the case in TLC, polar compounds will spend more time adsorbed on the polar solid phase, and as such travel more slowly down the column than nonpolar compounds. Therefore, compounds can be expected to leave the column, and be collected, in order of polarity (least polar to most polar).
Column Chromatography
Ion Exchange Chromatography
In applications where the materials to be separated have varying charge states, ion exchange chromatography may be employed. This method, again involving passing a mobile liquid phase containing the analyte through a column packed with a solid stationary phase, utilizes a polymeric resin functionalized with either positive or negatively charged moieties on the polymer surface.
The schematic below depicts the passage of an analyte containing both positively and negatively charged ionic species, as well neutral molecules, through a pore of an ion exchange resin. The particular stationary phase resin depicted below is functionalized with anionic sulfonate groups, initially coordinated to sodium cations.
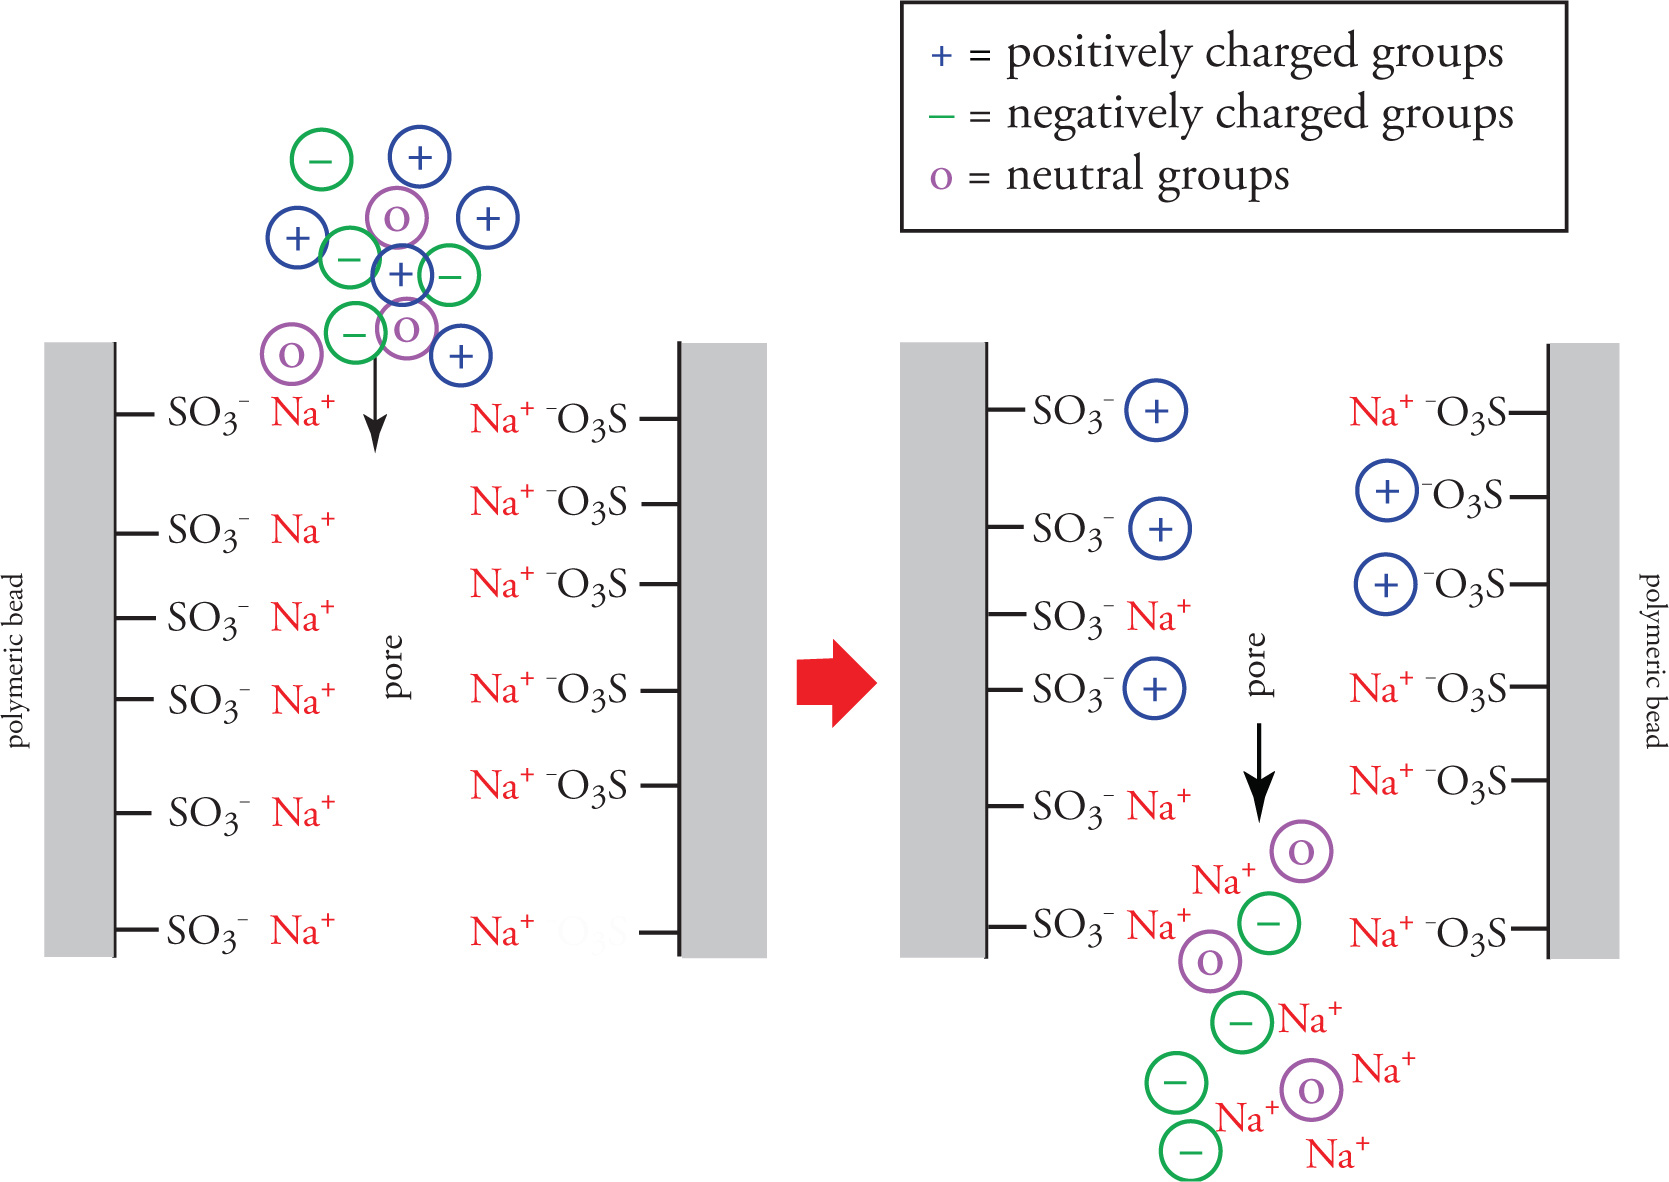
As the analyte passes through the resin, positively charged groups displace sodium ions and coordinate to the anionic functionalities tethered to the polymer surface. While these groups are retained, and their progress through the column retarded, the negatively charged groups and neutral species quickly pass through the material and are eluted first. Once all the negatively charged and neutral species have been eluted, the column can be treated with a concentrated sodium-containing solution to displace all adsorbed positively charged species.
Ion exchange chromatography is frequently used in the separation of mixtures of proteins. At any given pH, proteins within a mixture may exist in a variety of charge states (more on this in Chapter 7). If such a mixture is passed through an anionic ion exchange resin (one functionalized with negatively charged groups as shown in the figure above), those proteins with pI values greater than the pH of the mobile phase will be positively charged and elute slowly compared to those with pI values below the solution pH. If the same mixture at the same pH were passed through a cationic ion exchange resin, the opposite would be true, and proteins with pI values above the pH of the solution will elute first. If the pI values of the proteins to be separated are known, the pH of the mobile phase may be buffered to a specific pH, thereby ensuring different charge states and hence good separation.
High Performance Liquid Chromatography (HPLC)
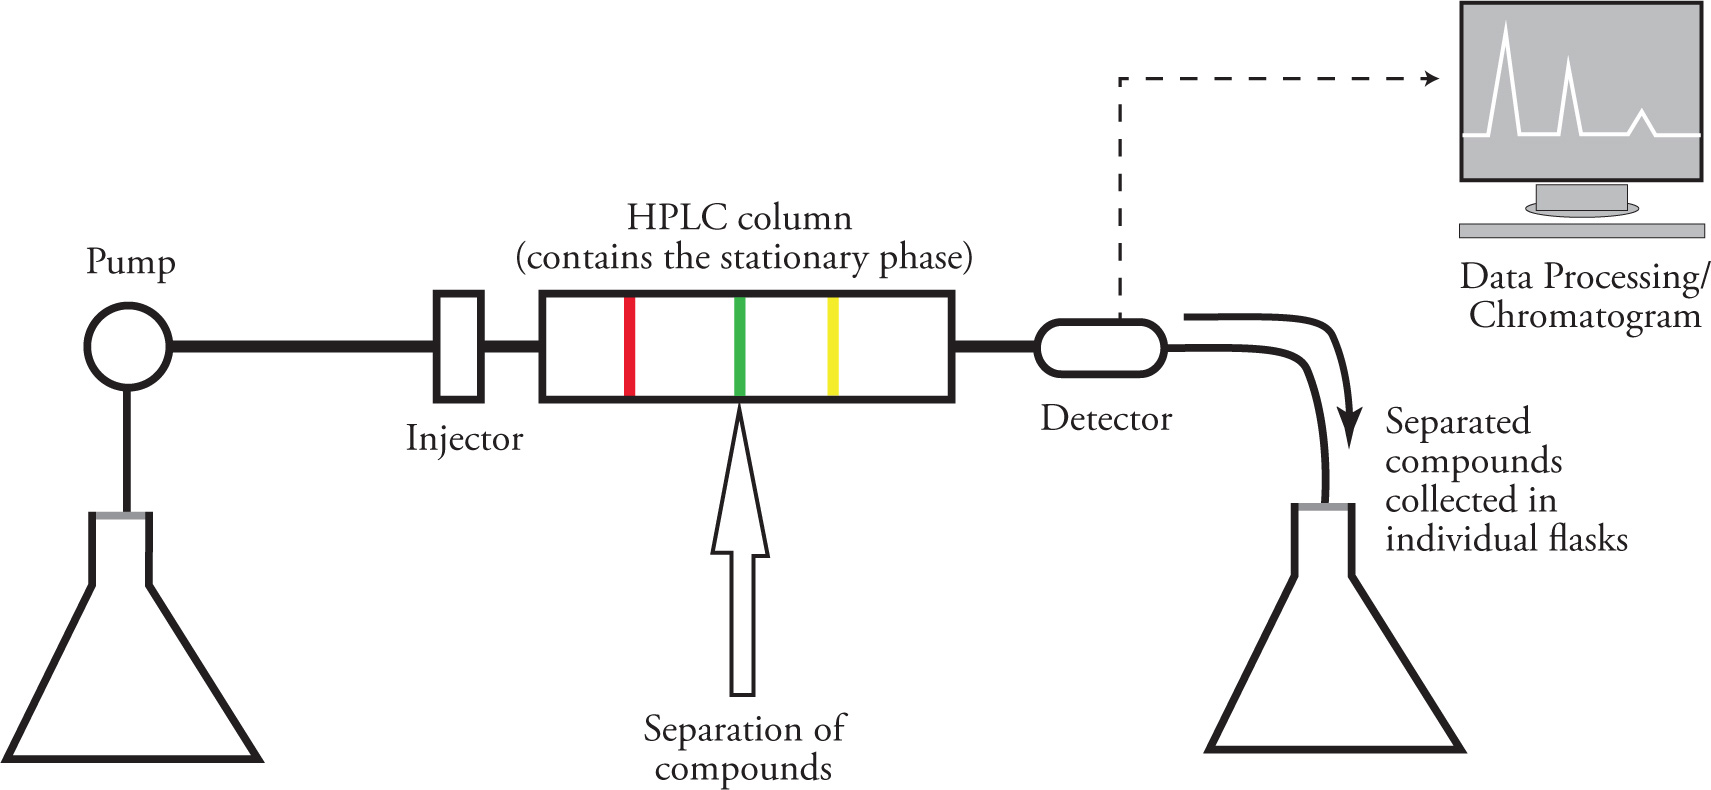
HPLC uses the same principles as all chromatographic separation techniques, and takes advantage of the differing affinities of various compounds for either a stationary phase or a mobile phase. However, because the mobile phase is forced through the stationary phase at very high pressures, both the speed and efficiency of the separation is increased, making this technique an improvement over column chromatography.
The basic configuration of an HPLC system is shown in the figure below. The pumping unit is where pressurization of the mobile phase first occurs. The sample to be separated is solubilized and injected by syringe, then the mobile phase carries the sample to the column. The sample is separated into its constituent components, which are detected and analyzed as they exit the column. The eluent is collected after detection, and the components can be isolated after evaporation of the solvent, if desired.
The elution time of any compound is dependent upon the mobile and stationary phases used. For most HPLC separations of organic compounds, the stationary phase is a silica gel that has been bonded to a nonpolar group (e.g., octadecylsilane), creating a relatively nonpolar stationary phase. This is called reverse phase HPLC. The mobile phase used is generally more polar than the stationary phase. This means the order of elution will be the reverse of what occurs on a TLC plate or in simple column chromatography. More polar compounds elute first in HPLC as they have a high affinity for the mobile phase. The less polar compounds are slowed by their interactions with the nonpolar stationary phase, and therefore elute last.
For the analysis of charged compounds, such as amino acids, the stationary phase is often an ion exchange column, usually cation exchange. The mobile phase is a polar, protic (e.g, CH3OH or H2O) or acidic solvent that ensures solubility and suppresses the dissociation of the COOH group on the amino acid. The difference in affinity to the column is attributed to the effects of the various R groups of the amino acids. Elution order can be predicted based on an analysis of the intermolecular forces of these side chains.
Size Exclusion Chromatography
Size exclusion chromatography is a technique used to separate bulk materials based on molecular size. Much like flash chromatography, the materials to be separated are dissolved in solvent, loaded onto a column packed with a stationary phase, and allowed to travel to the bottom of the column where they are collected.
In contrast to flash chromatography, which uses a polar silicate stationary phase, the stationary phase employed in size exclusion chromatography most often consists of chemically inert, porous polymer beads. The sizes of the pores in the bead are carefully controlled to allow permeation of small molecules in the eluent, while excluding larger ones. A schematic for the beads and the paths taken by large and small molecules is depicted below.
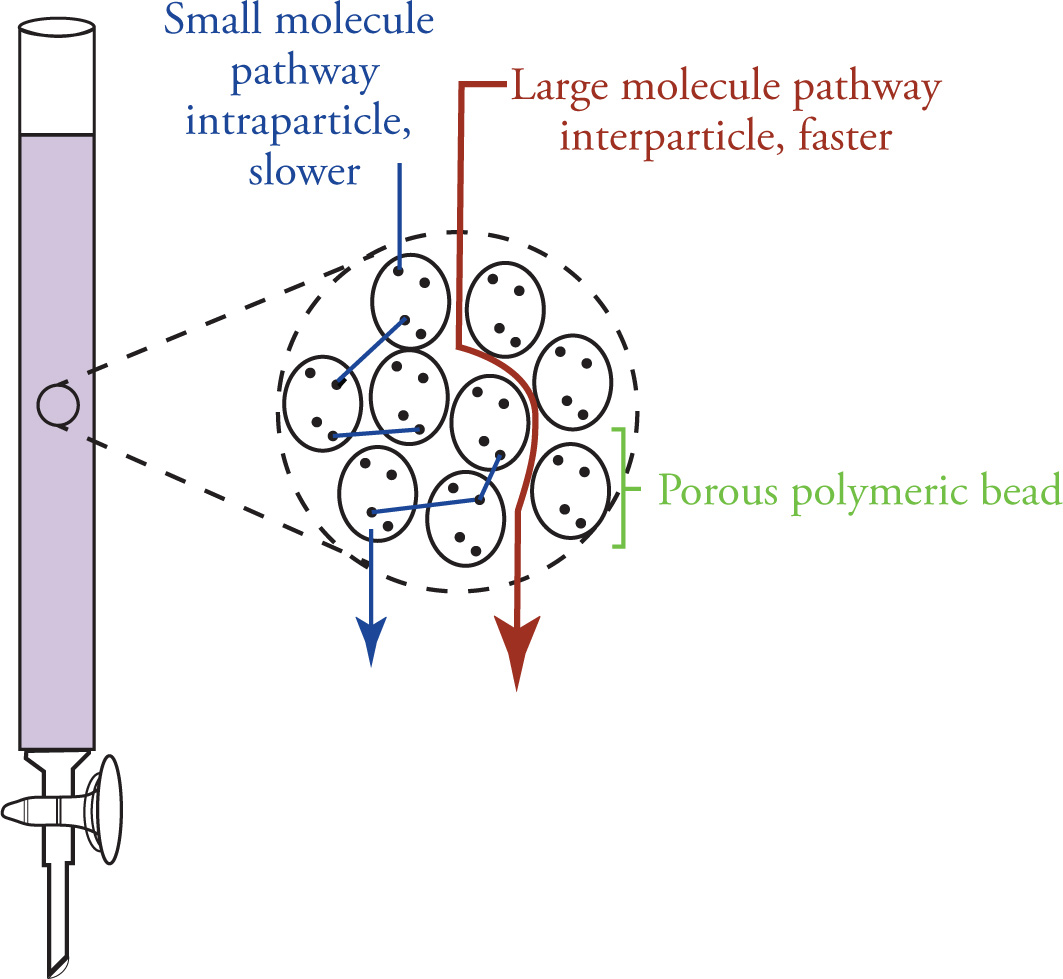
The exclusion of large molecules from the pore volume creates a more direct path down the column for large species than the more complicated intraparticle pathway taken by compounds small enough to permeate the beads. The overall result is the quick elution of large molecules and longer retention of smaller species.
Size exclusion chromatography is frequently used for the separation of large polymers from small oligiomeric fragments, or the separation of full proteins from smaller peptide chains. The lack of chemical interaction between the mobile and stationary phases results in relatively speedy elution (compared to chromatography on silica) and minimal loss of material on the column. However, though materials of very different sizes are easily separated, the technique is not particularly effective at separating different compounds of similar sizes.
Affinity Chromatography
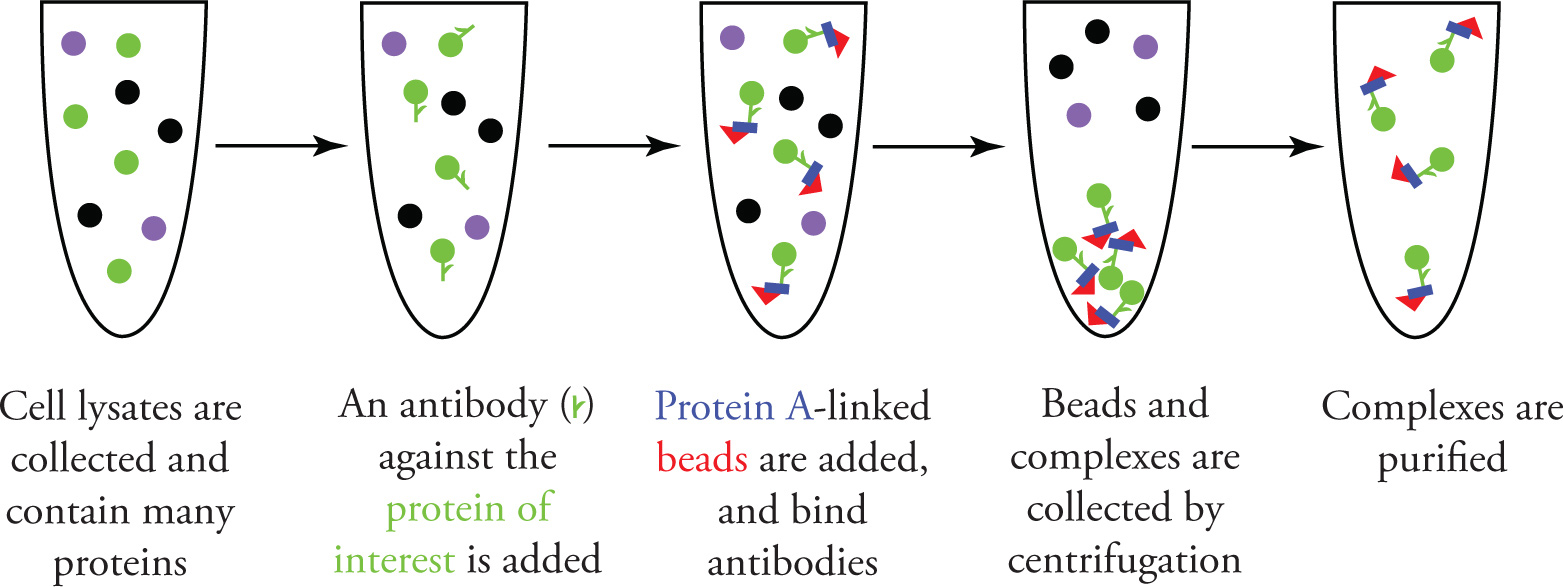
Affinity chromatography is most commonly used to purify proteins or nucleic acids from complex biochemical mixtures like cell lysates, growth media, or blood, rather than a reaction mixture. It is based on highly specific interactions between macromolecules. As a result of this specific binding, the target molecule is trapped on the stationary phase, which is then washed to remove the unwanted components of the mixture. The target protein is then released (or eluted) off the solid phase in a highly purified state.
In large-scale work, the stationary phase is a column packed with a solid resin, and the sample is poured through the column. In smaller scale experiments, the solid phase can be mixed in a small tube with the sample to allow interaction with the components of the mixture. The sample is then centrifuged (spun at high speeds) so the heavy solid resin settles to the bottom of the tube. Since the protein of interest is bound to the solid resin, the liquid (or supernatant) is simply decanted, leaving the desired compound behind.
In order to isolate a protein of interest, the highly specific interactions of antibodies can be used, as shown in the figure below. A commercially available antibody specific for the protein is added to the lysate sample. To isolate the antigen-antibody complex, one of three common microbe-derived proteins (Protein A, Protein G, or Protein L) is covalently linked to a solid support. These proteins are useful because they bind mammalian antibodies, so upon mixing, complexes made of Protein of Interest — Antibody — Protein A/G/L — Solid Support Bead form in solution. The target is then isolated after centrifuging the sample and decanting the supernatant.
Purifying a Protein of Interest using an Antibody and Protein A-linked Beads
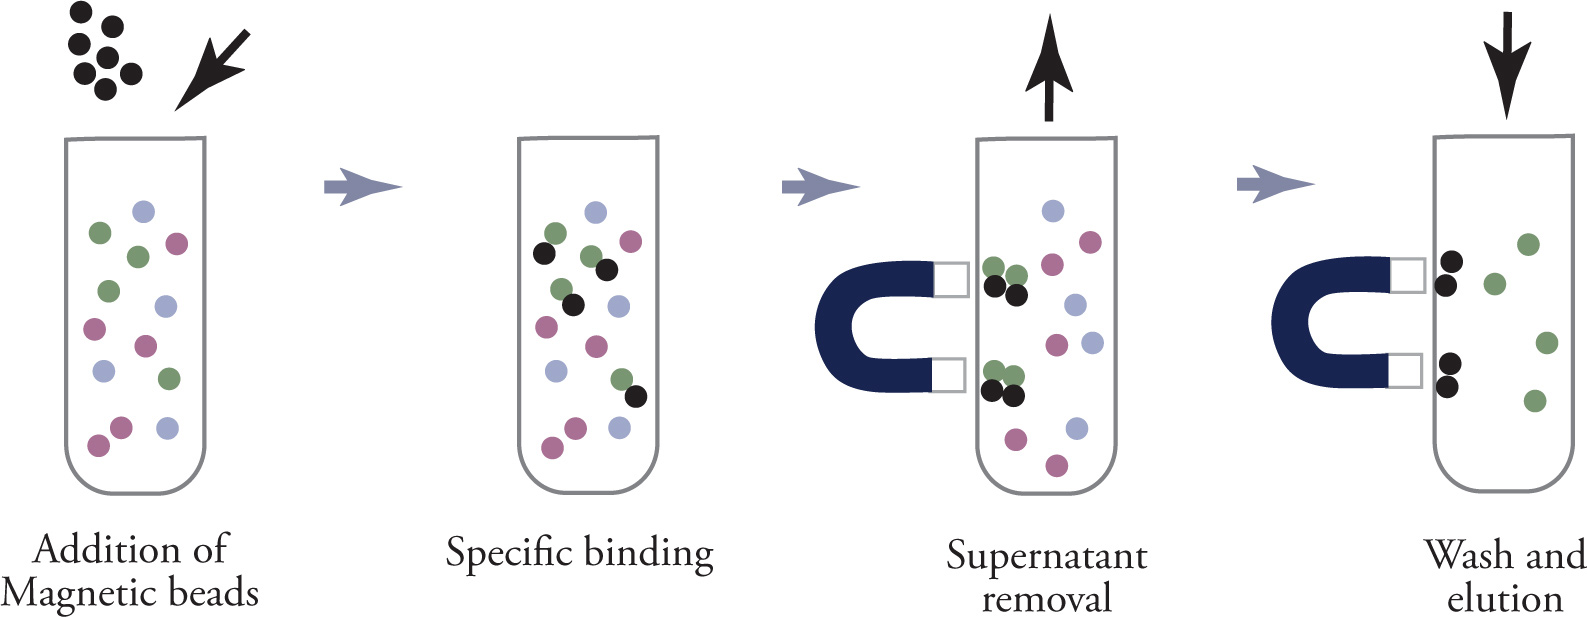
Instead of centrifugation, magnetic beads can be used as the solid phase, as shown below. The beads are isolated from solution by using a magnet to hold them (bound to the protein of interest) against the sides of the tube, while the solution containing any undesired compounds is decanted. Then the desired compound can be released from the beads in a pure state.
Using Magnetic Beads as the Solid Phase in Affinity Chromatography
Not all proteins of interest have a commercial antibody available. In this case, researchers can use an affinity tag. Using recombinant technology (described in Appendix 1 of the MCAT Biology Review), a small molecular tag is added to the N-terminus or the C-terminus of the protein. DNA sequences coding for affinity tags are well known, and these can be subcloned into a plasmid with the gene of interest. Affinity-tagged proteins can be produced in large amounts in laboratory bacteria, and the cell lysate collected is rich in tagged protein.
There are many types of affinity tags, and they are generally small enough that they don’t interfere with protein folding or function. One class of commonly used affinity tags are the His tags (made of 6-10 histidine amino acids), which bind ions such as nickel. When a cell lysate is applied to a column packed with nickel-based resin, the His-tagged proteins bind to the resin. This is done under high pH conditions, and the His-tagged protein can be eluted off the solid phase using lower pH conditions.
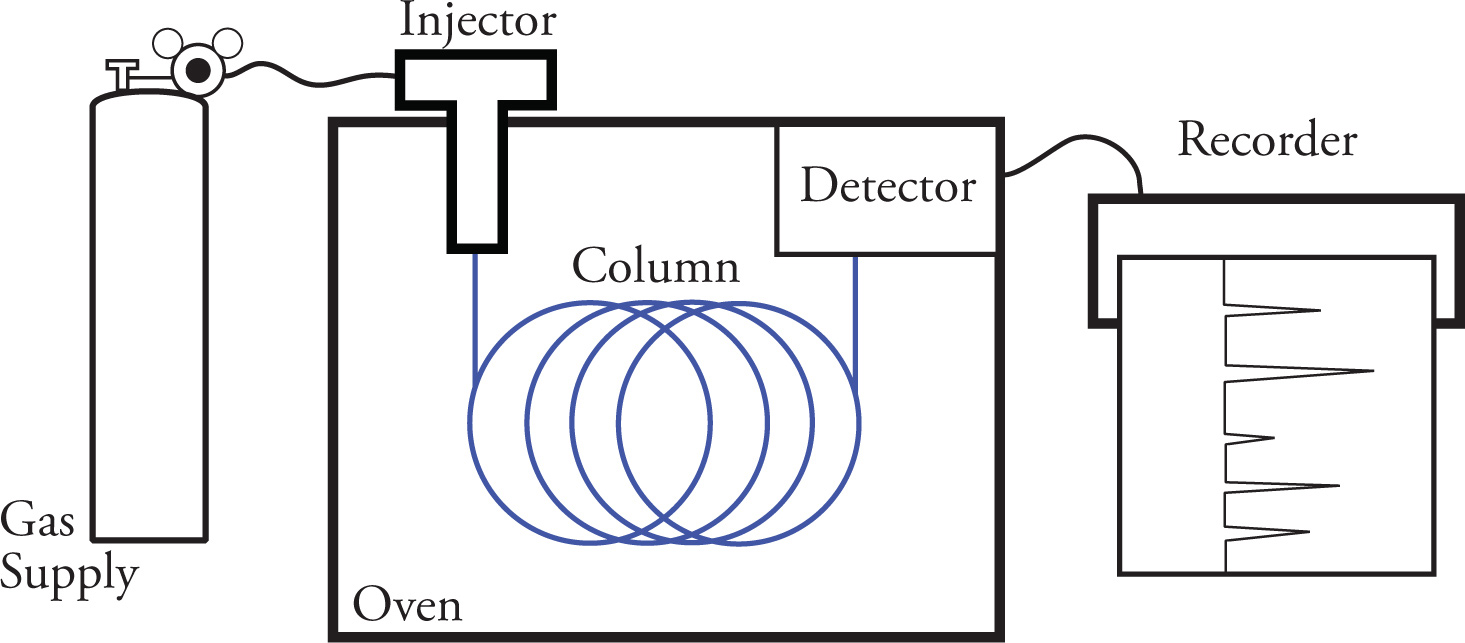
Gas Chromatography
Gas chromatography (GC) is a form of column chromatography in which the partitioning of the components to be separated takes place between a mobile gas phase and a stationary liquid phase. This partitioning, or separation, between mixtures of compounds occurs based on their different volatilities. In a typical gas chromatograph, a sample is loaded into a syringe and injected into the device through a rubber septum. The sample is then vaporized by a heater in the injection port and carried along by a stream of inert gas (typically helium). The vaporized sample is quickly moved by the inert gas stream into a column composed of particles that are coated with a liquid absorbant. As the components of the sample pass through the column, they interact differently with the absorbant based on their relative volatilities. Each component of the sample is subjected to many gas-liquid partitioning processes which separates the individual components.
As each component exits the column, it is burned, and the resulting ions are detected by an electrical detector that generates a signal that is recorded by a chart recorder. The chart recorder printout enables us to determine the number of components and their relative amounts.
Let’s now take a closer look at the separation process by examining a typical GC column. To do so, we will consider a mixture of two individual components. As the mixture enters the column, it begins to interact with the stationary phase, which is composed of support material coated with a liquid absorbant. The liquid absorbants can range from hydrocarbon mixtures that are very nonpolar to polyesters that are polar. As the mixture passes through the column, the components equilibrate between the carrier gas and the liquid phase. The less volatile components will spend more time dissolved in the liquid stationary phase than the more volatile component that will be carried along by the carrier gas at a faster rate. It is this equilibrium between the component (the absorbed liquid phase and the carrier gas mobile phase) that results in the separation of the mixture. If the interactions of the substrates with the column are similar (this is usually the case with most GC columns), the more volatile components emerge from the column first, while the less volatile components emerge from the column later.
Physical Properties of Organic Compounds
As we just discussed, it’s the volatility, or boiling point, of a compound that is most important to consider when conducting a gas chromatography experiment. Generally speaking, this technique separates only small amounts of material, whereas the next technique, distillation, does the same thing, just for larger amounts of material.
In order to best understand the principles behind distillations, as well as predict when it’s appropriate to use, we should first discuss some fundamentals about the physical properties of compounds, namely melting points and boiling points, and how they are related to the intermolecular forces of molecules.
Melting and Boiling Points
Melting point (mp) and boiling point (bp) are indicators of how well identical molecules interact with (attract) each other. Nonpolar molecules, like hydrocarbons, interact principally because of an attractive force known as the London dispersion force, one of the intermolecular (van der Waals) forces. This force exists between temporary dipoles formed in nonpolar molecules as a result of a temporary asymmetric electron distribution. Such intermolecular forces must be overcome to melt a nonpolar compound (solid → liquid) or to boil a nonpolar compound (liquid → gas). The greater the attractive forces between molecules, the more energy will be required to get the compound to melt or boil. The weaker these forces, the lower the melting or boiling point.
Many factors determine the degree to which molecules of a given compound will interact. For hydrocarbons, the most significant of these factors is branching. Branching tends to inhibit van der Waals forces by reducing the surface area available for intermolecular interaction. Thus, branching tends to reduce attractive forces between molecules and to lower both melting point and boiling point. Consider the following two constitutional isomers:
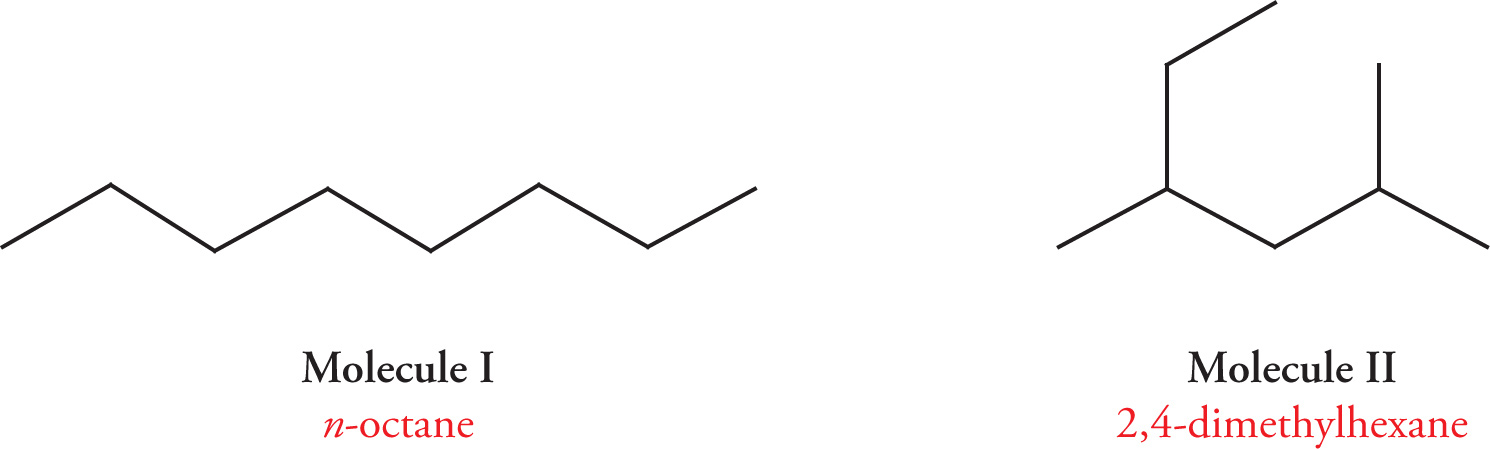
Molecule I, n-octane, is unbranched. Molecule II, 2,4-dimethylhexane, is a branched isomer of n-octane. Although each compound has the same molecular formula, C8H18, these two constitutional isomers have dramatically different melting points and boiling points. n-Octane requires much more energy to melt or boil, because unbranched, it experiences greater van der Waals forces than does the branched isomer 2,4-dimethylhexane. Therefore, n-octane has both a higher melting point and a higher boiling point than does 2,4-dimethylhexane.
The second factor influencing melting point and boiling point for hydrocarbons is molecular weight. The greater the molecular weight of a compound, the more surface area there is to interact, the greater the number of van der Waals interactions, and the higher the melting point and boiling point. Therefore, hexane—a six-carbon alkane—has a higher mp and bp than propane, a three-carbon alkane.
The influence of molecular weight on melting point and boiling point is readily seen when considering the following trends for hydrocarbons:
• Small hydrocarbons (1 to 4 carbons) tend to be gases at room temperature.
• Intermediate hydrocarbons (5 to 16 carbons) tend to be liquids at room temperature.
• Large hydrocarbons (more than 16 carbons) tend to be (waxy) solids at room temperature.
Example 5-1: Rank the following six hydrocarbons in order of increasing boiling point:
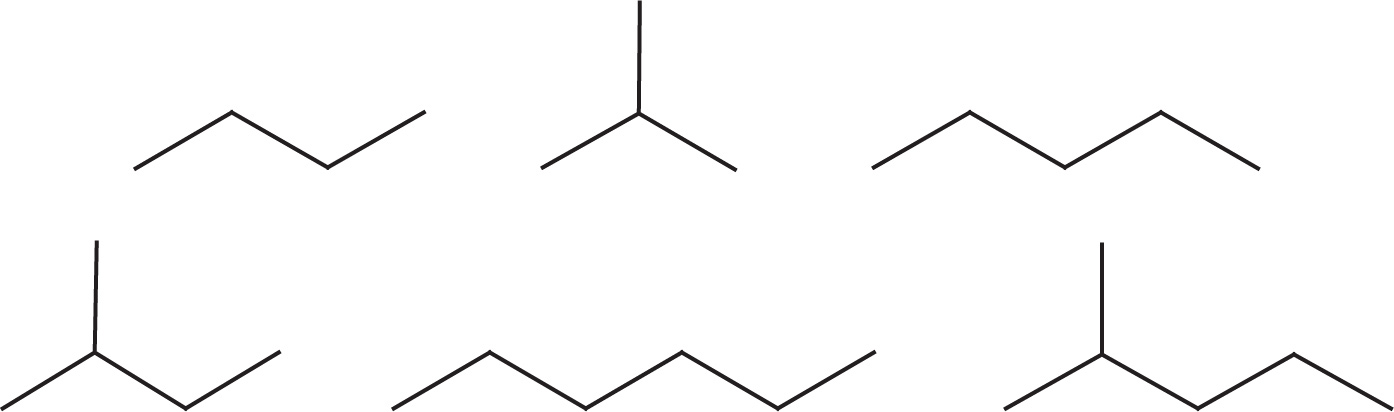
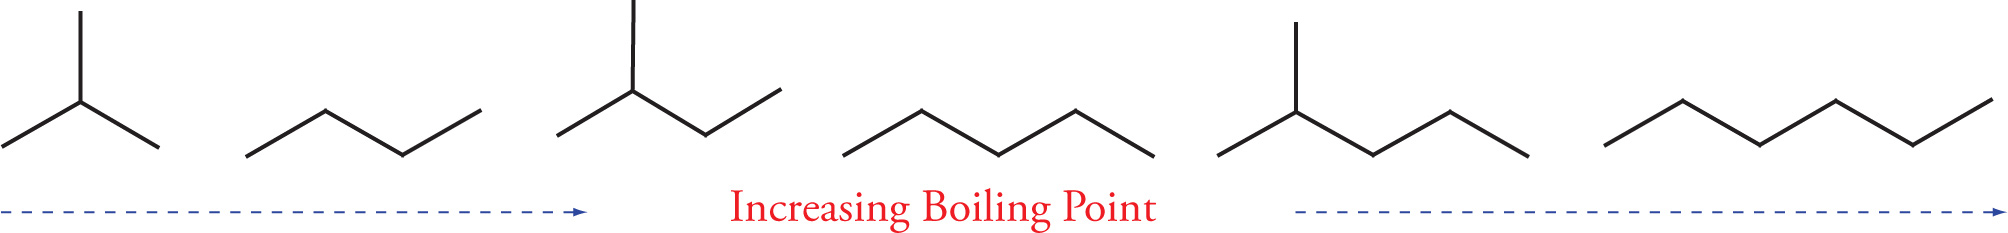
Solution: Since branching lowers the boiling point, each of the branched hydrocarbons has a lower boiling point than the unbranched hydrocarbon of the same molecular formula. Also, the larger the molecule, the greater the surface area over which van der Waals forces can act, so heavier molecules have higher boiling points. We can now put the whole sequence in order of increasing bp:
Hydrogen Bonding
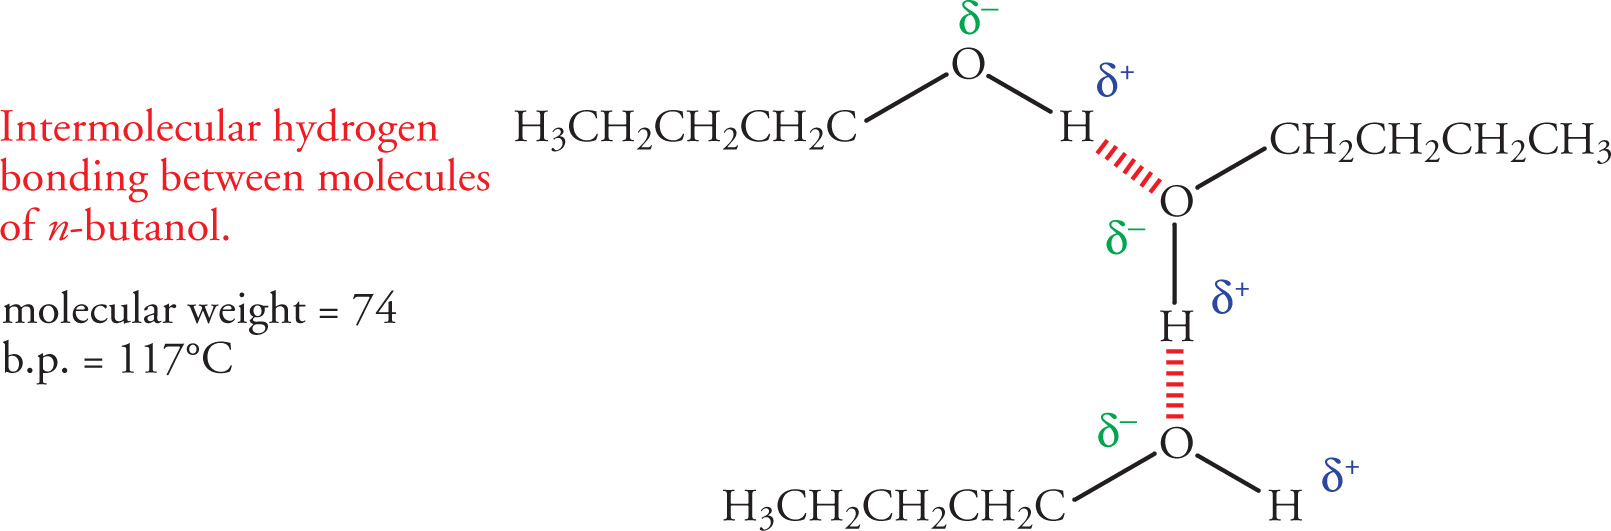
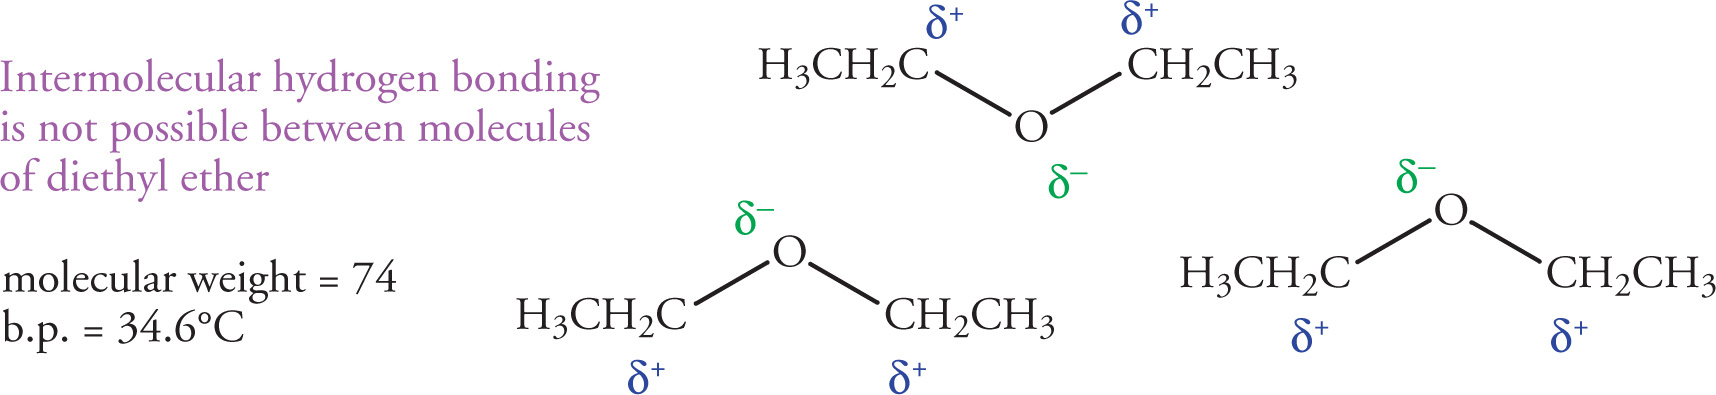
Another important type of intermolecular force that has a large effect on the physical properties of organic molecules is the hydrogen bond. In order to examine the effect of hydrogen bonding on melting or boiling points, let’s examine two molecules that are isomers of one another, n-butanol and diethyl ether. Both have the same molecular formula (C4H10O), yet there is a dramatic difference in their boiling points (117°C for n-butanol vs. 34.6°C for diethyl ether). This difference arises from the ability of n-butanol to form intermolecular hydrogen bonds, while diethyl ether cannot.
Recall from General Chemistry that hydrogen bonding occurs between a hydrogen-bond donor—a hydrogen covalently bonded to a nitrogen, oxygen, or fluorine atom, and a hydrogen-bond acceptor—a lone pair of electrons on a nitrogen, oxygen, or fluorine in another molecule, or part of the first molecule. Alcohols form intermolecular hydrogen bonds because they have hydroxyl (−OH) groups. This results from a strong dipole in which the hydroxyl group’s hydrogen acquires a substantial partial positive charge (δ+) and the oxygen acquires a substantial partial negative charge (δ−). The partial positive hydrogen can interact electrostatically with a non-bonding pair of electrons on a nearby oxygen, resulting in a hydrogen bond.
On the other hand, diethyl ether has an oxygen atom with non-bonding electrons but all hydrogen atoms are bound to carbons. Since carbon and hydrogen have similar electronegativity values, the bond is not very polarized, and these hydrogens cannot participate in hydrogen bonding. It’s important to remember that a hydrogen bond is not a covalent bond; in this case it’s an intermolecular interaction.
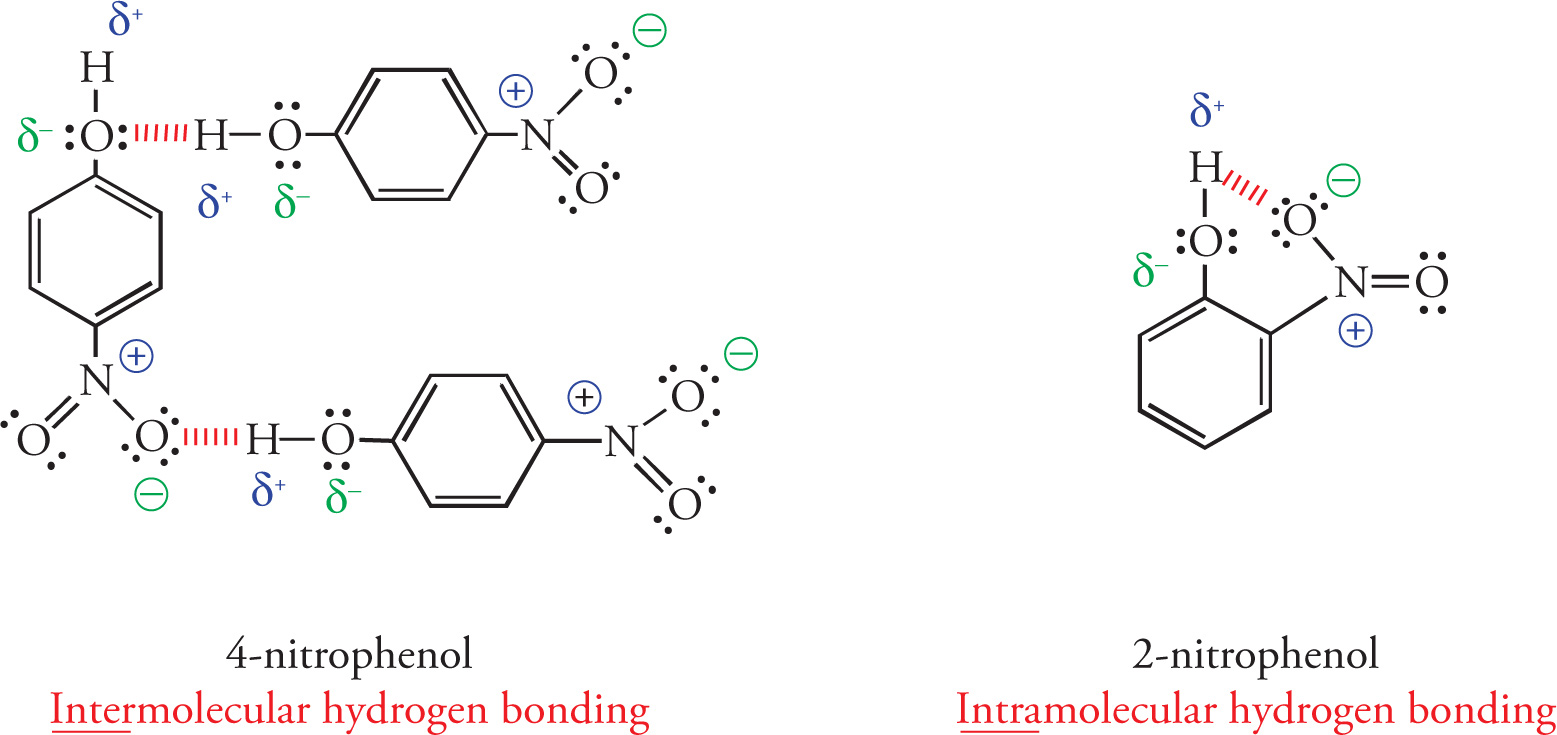
The hydrogen bonding pattern in phenols provides insight into intermolecular vs. intramolecular hydrogen bonding. Let’s consider the two isomers, 4-nitrophenol and 2-nitrophenol. First, examine the hydrogen bonding pattern in 4-nitrophenol. Notice that hydrogen bonding can occur with both the nitro and the hydroxyl groups in this molecule and that the bonding is exclusively intermolecular. That is, all hydrogen bonding takes place between individual molecules of 4-nitrophenol. These hydrogen bonding interactions hold molecules of 4-nitrophenol together and increase their boiling and melting points.
Now, examine the hydrogen bonding pattern in 2-nitrophenol. Notice that for this molecule, the nitro group and the hydroxyl group are in close proximity so that intramolecular hydrogen bonding can occur between the hydrogen of the hydroxyl group and a lone pair of electrons on the nitro group on the same molecule. These intramolecular hydrogen bonding interactions decrease the amount of intermolecular hydrogen bonding interactions that can occur between molecules thereby decreasing the melting and boiling points of 2-nitrophenol (46°C) relative to 4-nitrophenol (114°C).
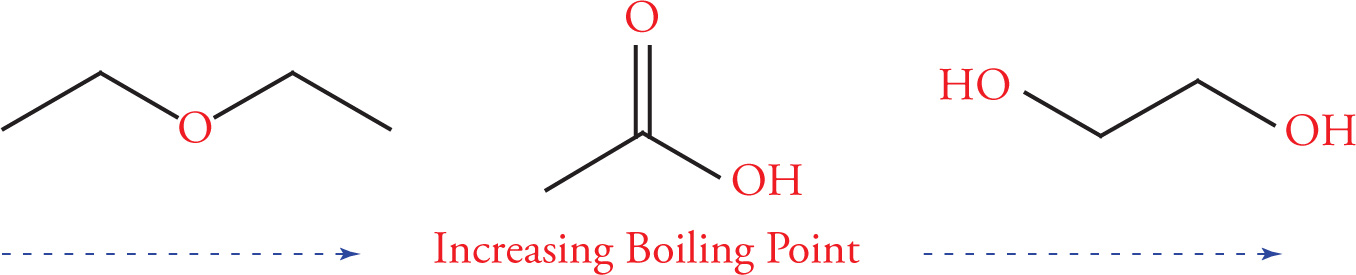
Example 5-2: Rank the following three compounds in order of increasing boiling point:
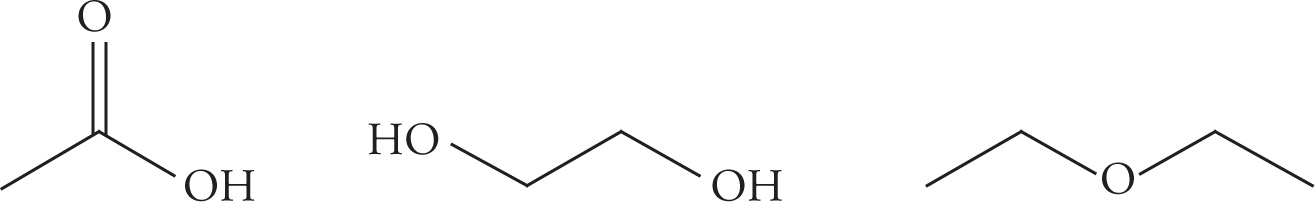
Solution: The more hydrogen-bond donors and hydrogen-bond acceptors there are in a molecule, the higher the boiling and melting points will be. This is because the hydrogen bonds, like dispersion forces, act to hold the molecules together, resisting the change to becoming either a liquid or a gas. The first molecule, acetic acid (C2H4O2), has one hydrogen-bond donor and four hydrogen-bond acceptors. The second molecule, 1,2-ethanediol (C2H6O2), has two hydrogen-bond donors and four hydrogen-bond acceptors. The third molecule, diethyl ether (C4H10O), has two hydrogen-bond acceptors, but no hydrogen bond donors. From this we can now correctly assign the order of their boiling points:
Example 5-3: For each of the following pairs of compounds, predict which molecule will have the higher boiling point.
(i) 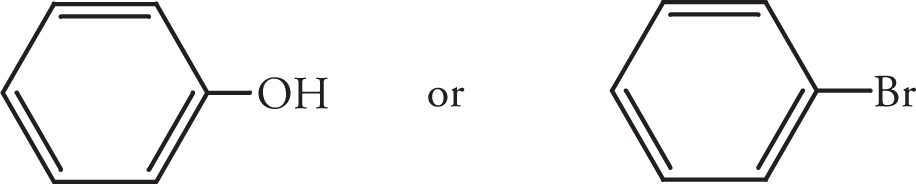
(ii) 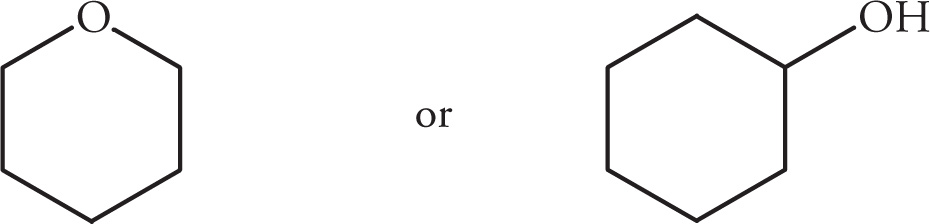
(iii) 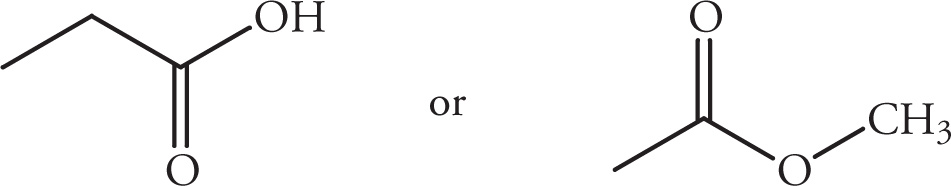
(iv) 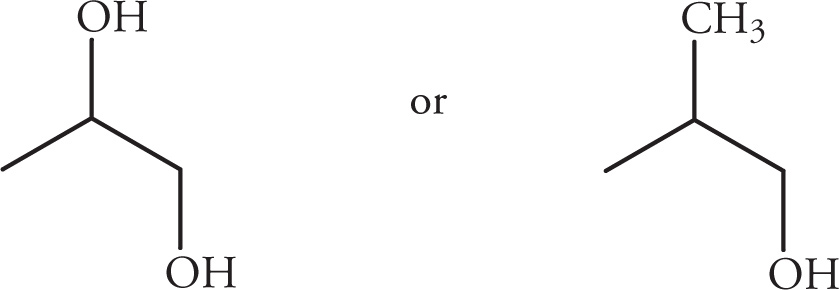
(v) 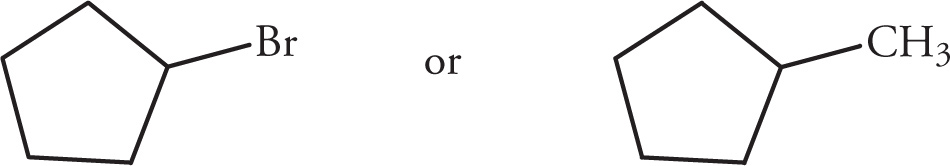
Solution:
(i) 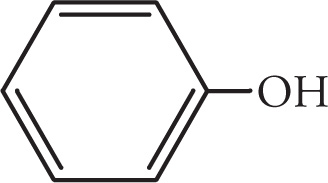
(ii) 
(iii) 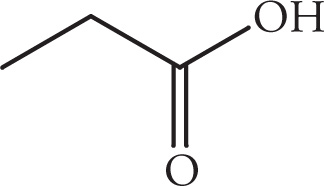
(iv) 
(v) 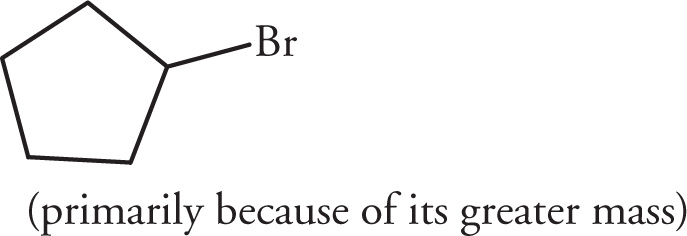
With a better understanding of what helps to determine the boiling point of an organic molecule, let’s now discuss the next important separation technique for the MCAT—distillations.
Distillations
Distillation is the process of raising the temperature of a liquid until it can overcome the intermolecular forces that hold it together in the liquid phase. The vapor is then condensed back to the liquid phase and subsequently collected in another container.
Simple Distillation
A simple distillation is performed when trace impurities need to be removed from a relatively pure compound, or when a mixture of compounds with significantly different boiling points needs to be separated. For example, an appropriate use of a simple distillation would be to purify fresh drinking water away from a salt water solution. The more volatile water can be boiled away, then condensed and collected, leaving behind the nonvolatile salts.
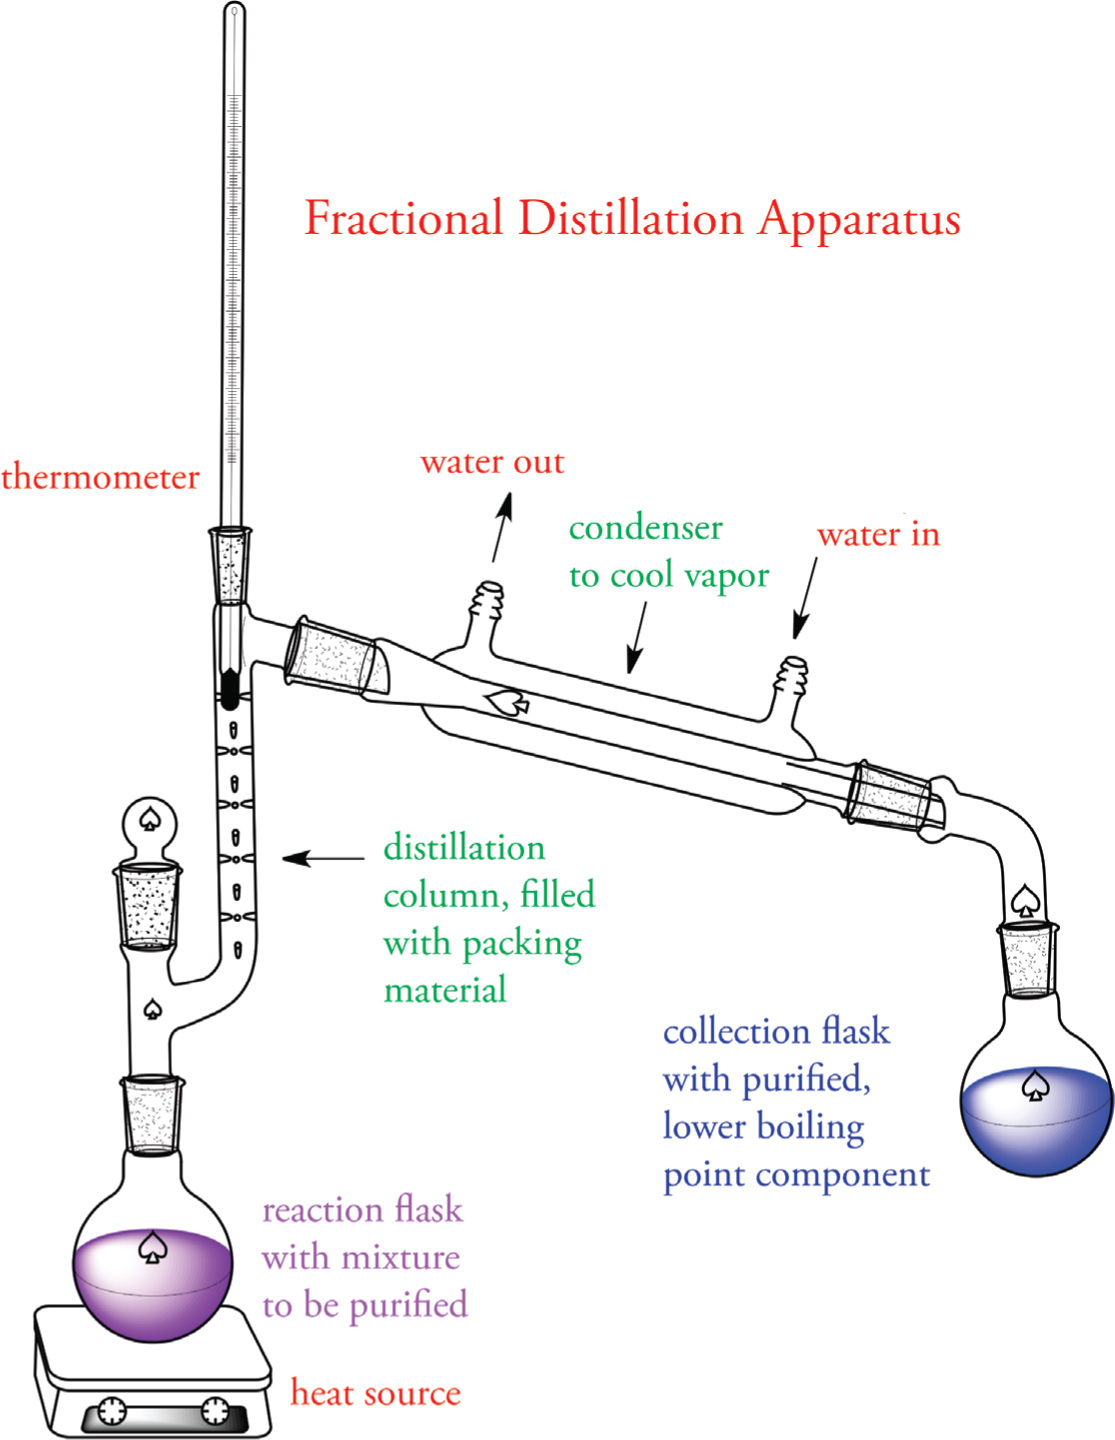
Fractional Distillation
Fractional distillation is a different type of distillation process that is used when the difference in boiling points of the components in the liquid mixture is not large. A fractional distillation column is packed with an appropriate material, such as glass beads or a stainless steel sponge. The packing of the column results in the liquid mixture being subjected to many vaporization-condensation cycles as it moves up the column toward the condenser. As the cycles progress, the composition of the vapor gradually becomes enriched in the lower boiling component. Near the top of the column, nearly pure vapor reaches the condenser and condenses back to the liquid phase where it is subsequently collected in a receiving flask.
Example 5-4: A chemist wishes to separate a mixture of Compounds A and B. He decides to distill the mixture; however, he is unsure of their respective boiling points. After several minutes of heating, he collects the distillate, takes a small sample, and injects it into a gas chromatograph. The output is:
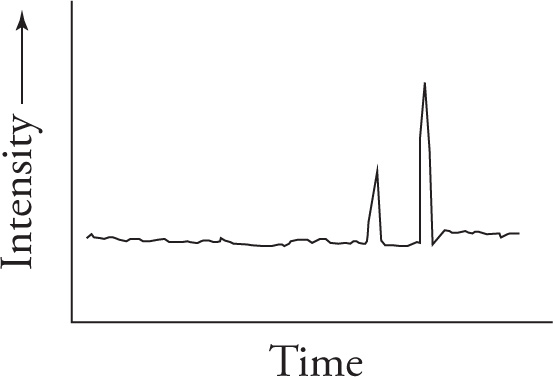
What can this chemist conclude about the separation, and how could it be improved?
Solution: Based on the data from the GC, his separation was only partial (because two different peaks are recorded). Because the second peak is larger than the first, the distillate consists primarily of one of the two compounds, but their boiling points may have been similar enough such that a complete separation was not possible. Perhaps the chemist should try fractional distillation.
5.2 SPECTROSCOPY
A basic understanding of the general principles of spectroscopy will enable you to answer important questions regarding the structure of organic molecules. In this section, we’ll examine the general principles of spectroscopy with the goal of interpreting the spectra of simple organic molecules.
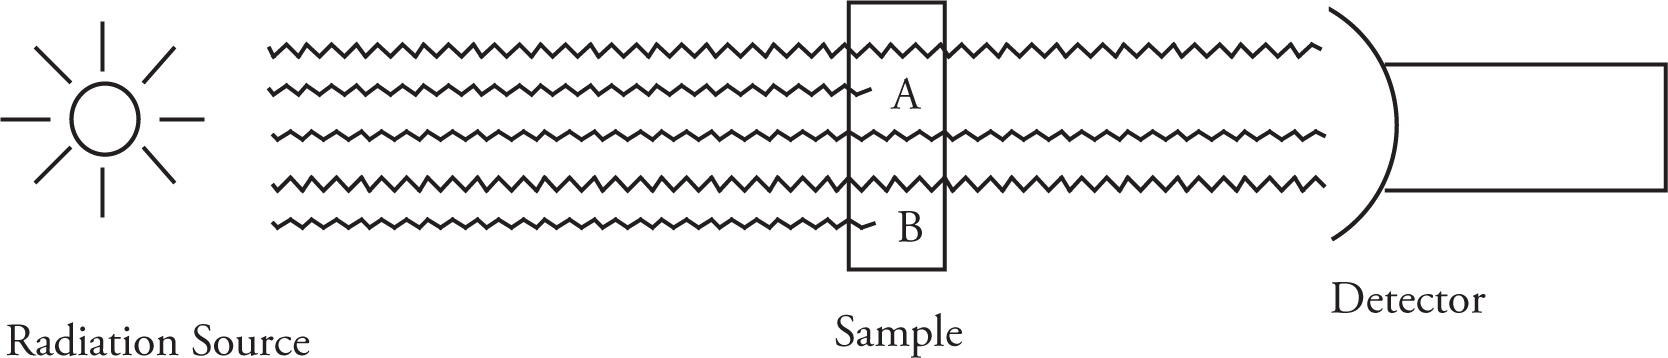
Most types of spectroscopy that we will discuss are examples of absorption spectroscopy. A short explanation of the molecular events involved in absorption spectroscopy will help you remember the details of IR and NMR spectroscopy. Molecules normally exist in their lowest energy form, called their ground state. When a molecule is exposed to light it may absorb a photon, provided that the energy of this photon matches the energy between two of the fixed electronic energy levels of the molecule. When this happens, the molecule is said to be in an excited state. Molecules tend to prefer their ground state to an excited state, but in order for them to return to their ground state, they must lose the energy they have gained. This loss of energy can occur by the emission of heat, or less commonly, light. In absorption spectroscopy, scientists induce the absorption of energy by a sample of molecules by exposing the sample to various forms of light, thereby exciting molecules to a higher energy state. They then measure the energy released as the molecules relax back to their ground state. This measured energy can reveal structural features of the molecules in the sample.
There are many different forms of light, as displayed in the electromagnetic spectrum. In principle, any of these forms of light could be used to do absorption spectroscopy on molecules, and, in fact, many are! The different forms of light induce different transitions in ground state molecules to different excited states of the molecules and allow for the acquisition of different structural information about the molecules.
Mass Spectrometry
Mass spectrometry is a very useful technique that allows researchers to determine the mass of compounds in a sample. Within the mass spectrometer, molecules are ionized in a high vacuum, usually by bombarding them with high energy electrons. Once ionized, compounds enter a region of the spectrometer where they are acted on by a magnetic field. This field causes the flight path of the charged species to alter, and the degree to which the path is changed is determined by the mass of the ion. This difference is detected and translated into a mass readout in the detector.
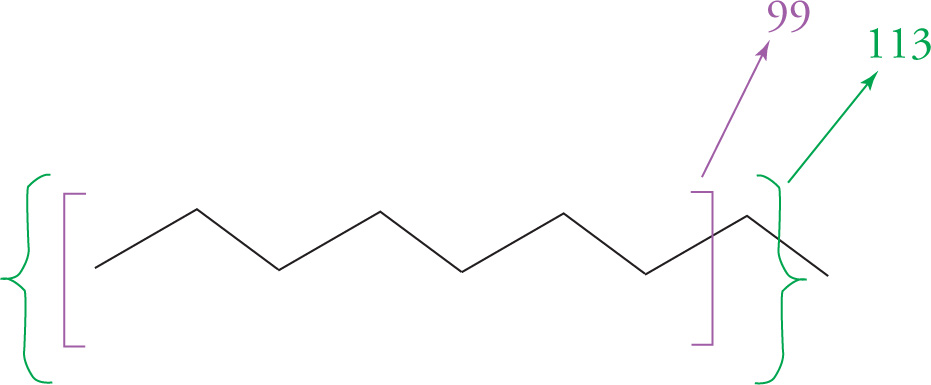
On the following page is a schematic of a portion of the mass spectrum for n-nonane (MW = 128 g/mol).
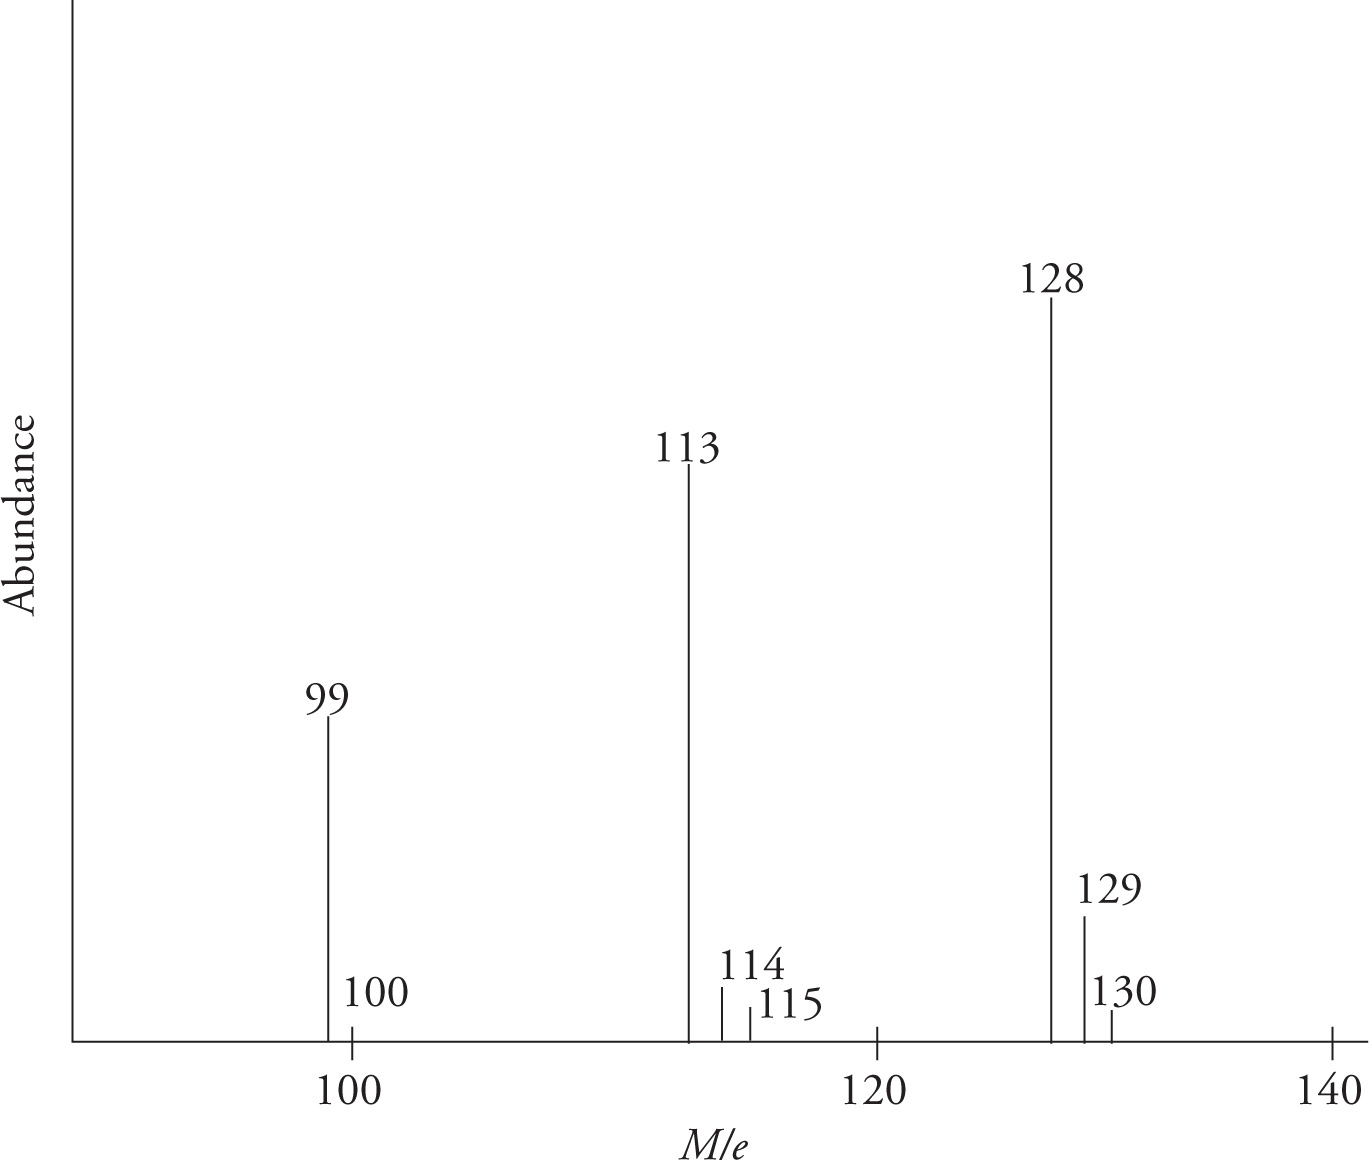
The M/e label on the x-axis represents the ratio of mass (M) to charge (e). In most cases e = +1, so peaks can simply be viewed as molecular mass. The y-axis represents the relative abundance of each species of a particular mass detected in the sample. Masses, though generally not labeled as such, are measured in amu.
Two aspects of the above spectrum may be puzzling: 1) If the molecular weight of nonane is 128 g/mol, why are there peaks greater than this value, and 2) why are there significant peaks in the sample with masses lower than 128?
Remember, atoms can come in a number of different isotopes. For example, the most prevalent mass of hydrogen in nature is 1, but deuterium has an extra neutron and weighs 2 (natural abundance = .015%). Likewise, the most abundant isotope of carbon is 12C, but 13C exists as 1.1% of all carbon atoms. So, the small peaks with masses larger than the main peak represent molecules that have one or more of these less abundant isotopes.
The masses lower than 128 in the above scan represent the masses of molecular fragments. The high energy beam of electrons used to ionize molecules in the mass spectrometer can cause the molecule to break into smaller parts. The figure below shows where n-nonane might have been broken to produce peaks with the masses found above. The outer, curved brackets represent a fragment which has lost the terminal CH3 group and hence is 15 less than the peak at 128. The inner, square brackets show a fragment weighing 99, having lost CH2CH3.
Particular atoms present in a molecule may give characteristic peaks in their mass spectra thanks to isotopic ratios. The two most important are Br and Cl. Bromine naturally occurs in two isotopes (79 and 81) of nearly identical natural abundance. This means that any mass spectrum involving a brominated compound will have two major peaks, nearly equal in height, 2 amu apart. Chlorine also occurs as two main isotopes; 35 (75% natural abundance) and 37 (25% natural abundance). Mass spectra for chlorinated molecules will have a peak 2 amu heavier than the main peak, and about one-third its height.
Ultraviolet/Visible (UV/Vis) Spectroscopy
UV/Vis spectroscopy is a type of absorption spectroscopy used in organic chemistry. It is very similar to IR (which we’ll discuss next), but instead focuses on the slightly shorter, more energetic wavelengths of radiation in the ultraviolet and visible area of the spectrum. The wavelengths in the UV and visible ranges of the electromagnetic spectrum are strong enough to induce electronic excitation, promoting ground state valence electrons into excited states.
In general, UV/Vis spectroscopy is used with two kinds of molecules. It is very useful in monitoring complexes of transition metals. The easy promotion of electrons from ground to excited states in the closely spaced d-orbitals of many transition metals gives them their bright color (by absorbing wavelengths in the visible region), and since many of these promotions involve energies in the UV range, these promotions allow study of these species.
More importantly in organic chemistry, UV/Vis spectroscopy is used to study highly conjugated organic systems. Molecular orbital theory tells us that when molecules have conjugated π-systems, orbitals form many bonding, non-bonding, and anti-bonding orbitals. These orbitals can be reasonably close together in energy, and in fact, close enough to allow promotion of electrons between electronic states through absorption of ultraviolet, or even visible photons. The wavelength of maximum absorption for any compound is directly related to the extent of conjugation in the molecule. The more extensive the conjugated system is, the longer the wavelength of maximum absorption will be. To illustrate this relationship, let’s look at a series of polycyclic aromatic hydrocarbons in Table 5.1 below.
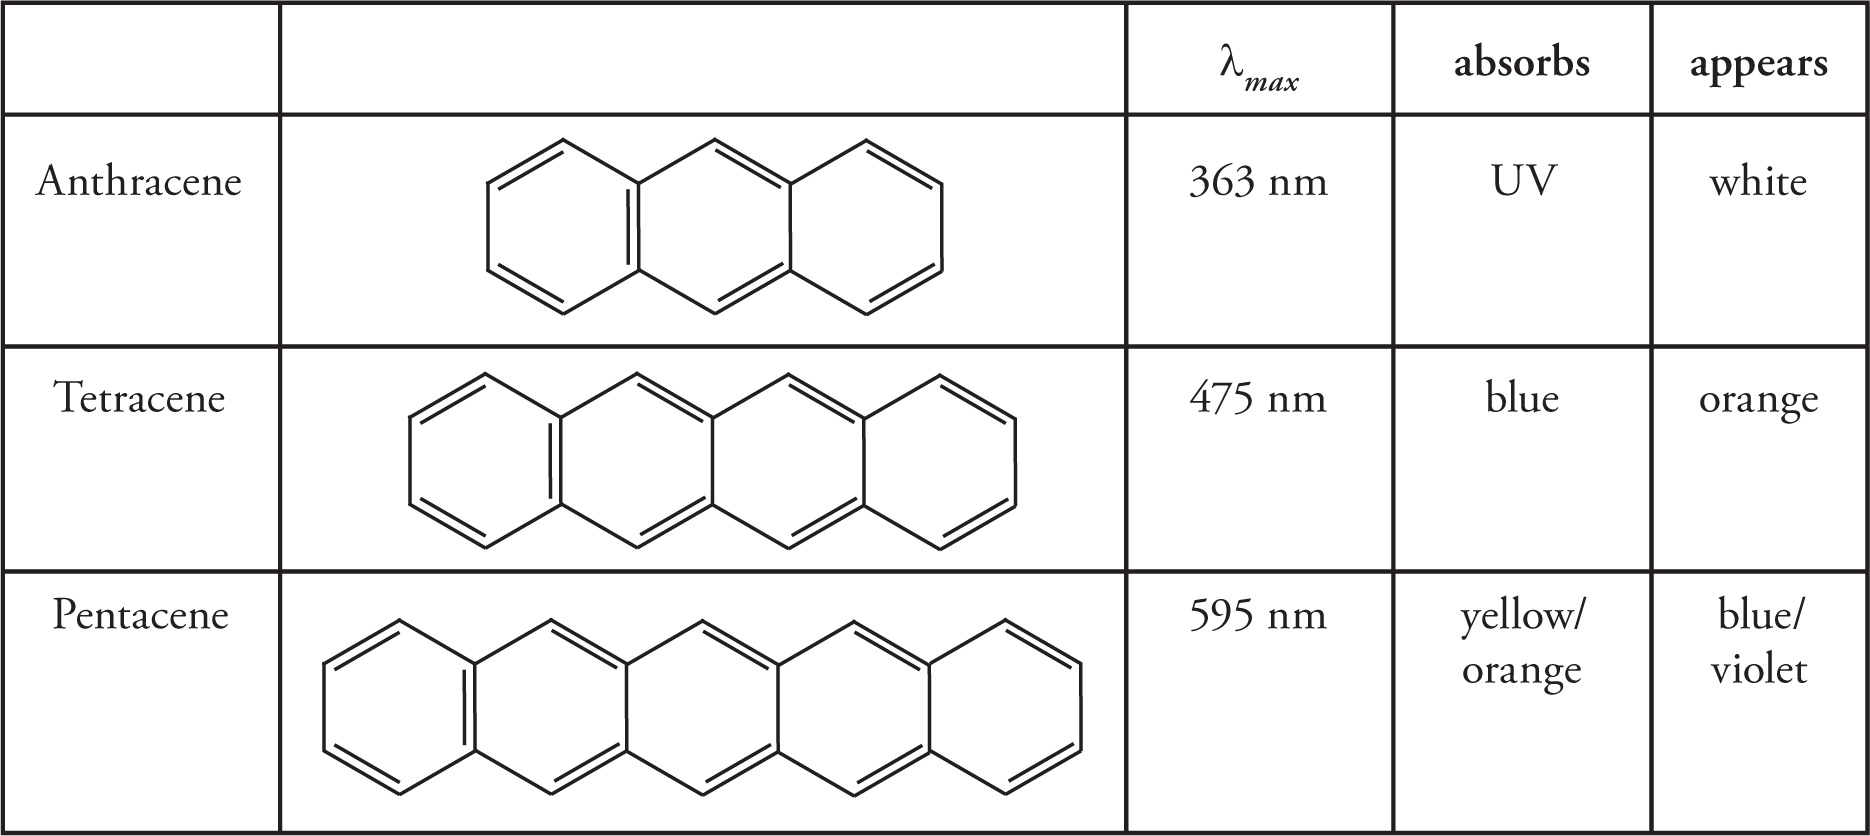
Table 5.1 UV/Vis Spectroscopic Data for Select Polycyclic Aromatic Hydrocarbons
With the addition of each aromatic ring, the conjugated system grows longer and the wavelength of maximum absorption increases. Since each λmax corresponds to a particular color of light, a simple color wheel can be used to predict the color the compound will appear. As a general rule, the color a compound maximally absorbs is complementary to the color it will appear to our eyes. For a compound that absorbs only ultraviolet radiation, ALL of the visible wavelengths will be reflected and thus the compound will appear white or colorless. However, a compound that absorbs blue light will appear to us as orange, since blue and orange are complementary colors on opposites sides of the color wheel (Figure 5.1).
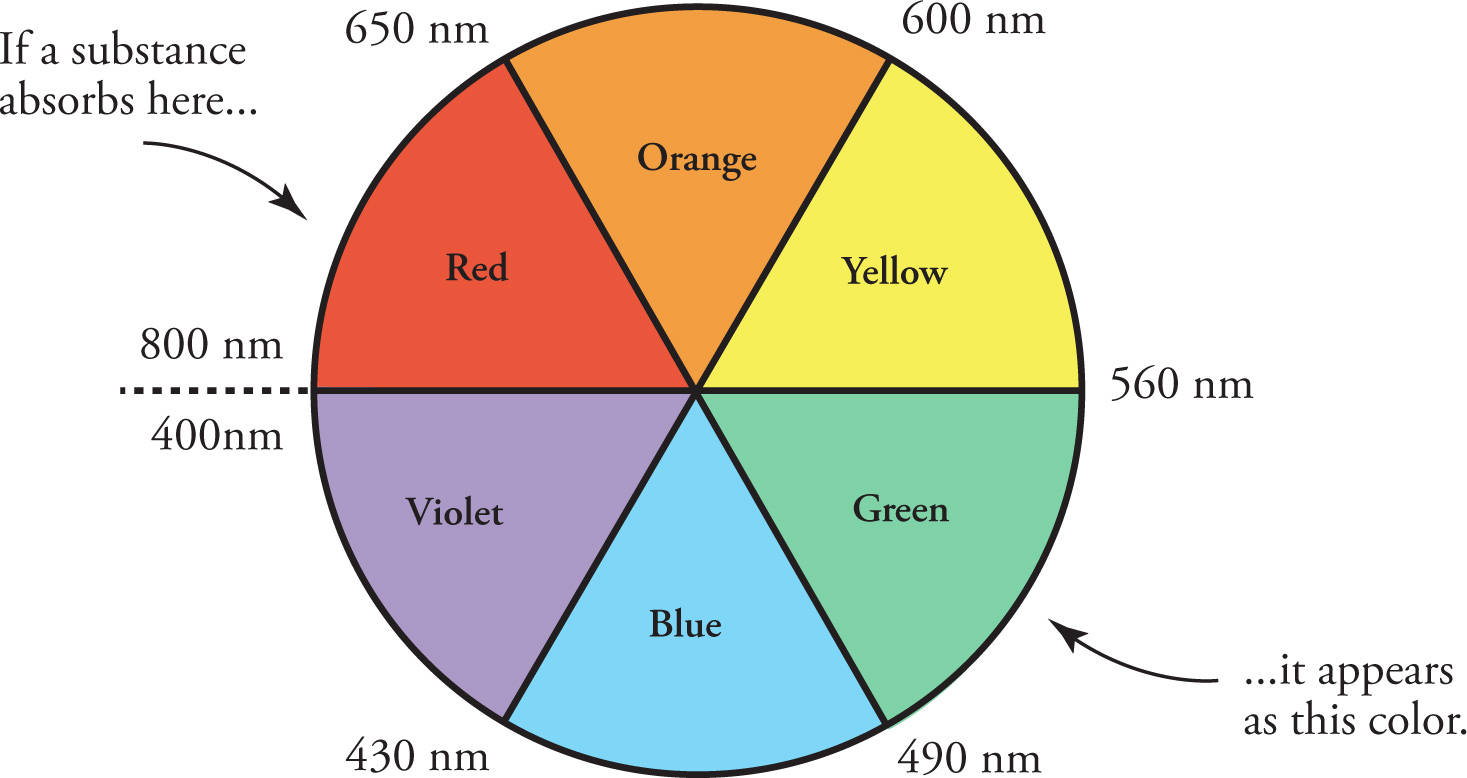
Figure 5.1 Color Wheel Showing Complementary Colors
Infrared (IR) Spectroscopy
Electromagnetic radiation in the infrared (IR) range λ = 2.5 to 20 µm has the proper energy to cause bonds in organic molecules to become vibrationally excited. When a sample of an organic compound is irradiated with infrared radiation in the region between 2.5 and 20 µm, its covalent bonds will begin to vibrate at distinct energy levels (wavelengths, frequencies) within this region. These wavelengths correspond to frequencies in the range of 1.5 × 10¹³ Hz to 1.2 × 10¹⁴ Hz. In IR spectroscopy, vibrational frequencies are more commonly given in terms of the wavenumber. Wavenumber (ῡ) is simply the reciprocal of wavelength:
ῡ = ![]() =
= ![]() v
v
and is therefore directly proportional to both the frequency (since λν = c = 3 × 1010 cm/sec) and the energy of the radiation (since E = hν). That is, the higher the wavenumber, the higher the frequency and the greater the energy. Wavenumbers are usually expressed in reciprocal centimeters, cm−1, and MCAT IR spectra will typically cover the range from 4000 to 1000 cm−1.
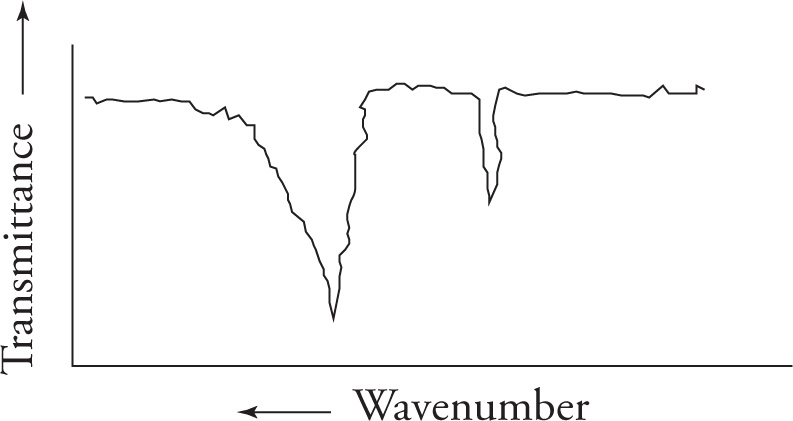
When a bond absorbs IR radiation of a specific frequency, that frequency is not recorded by the detector and is thus seen as a peak in the IR spectrum (since low transmittance corresponds, naturally, to absorbance):
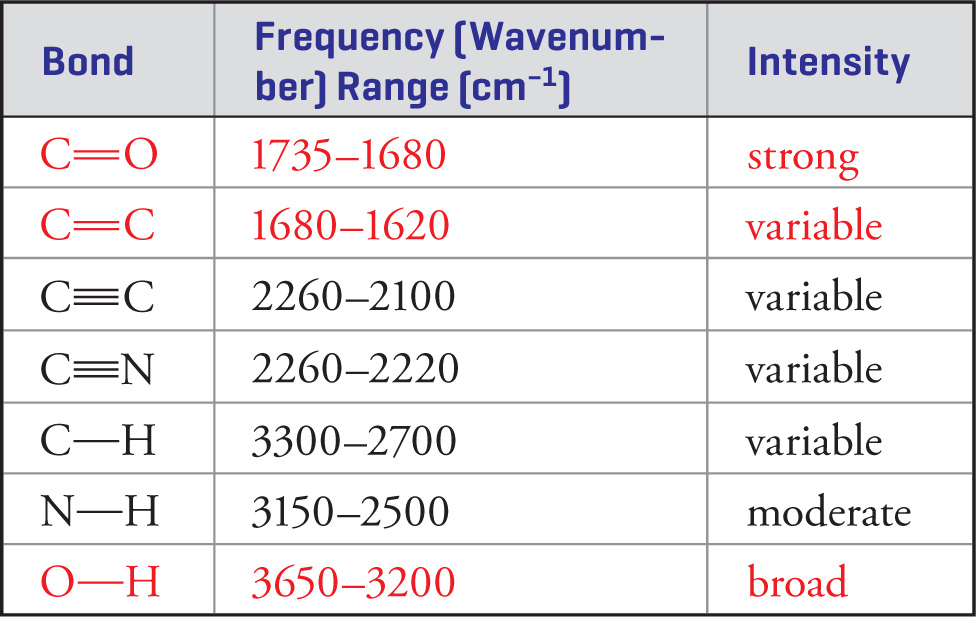
Important Stretching Frequencies
In order to do well on the MCAT, it is important that you know the stretching frequencies of the common functional groups. The most important ones are listed below.
The Double Bond Stretches
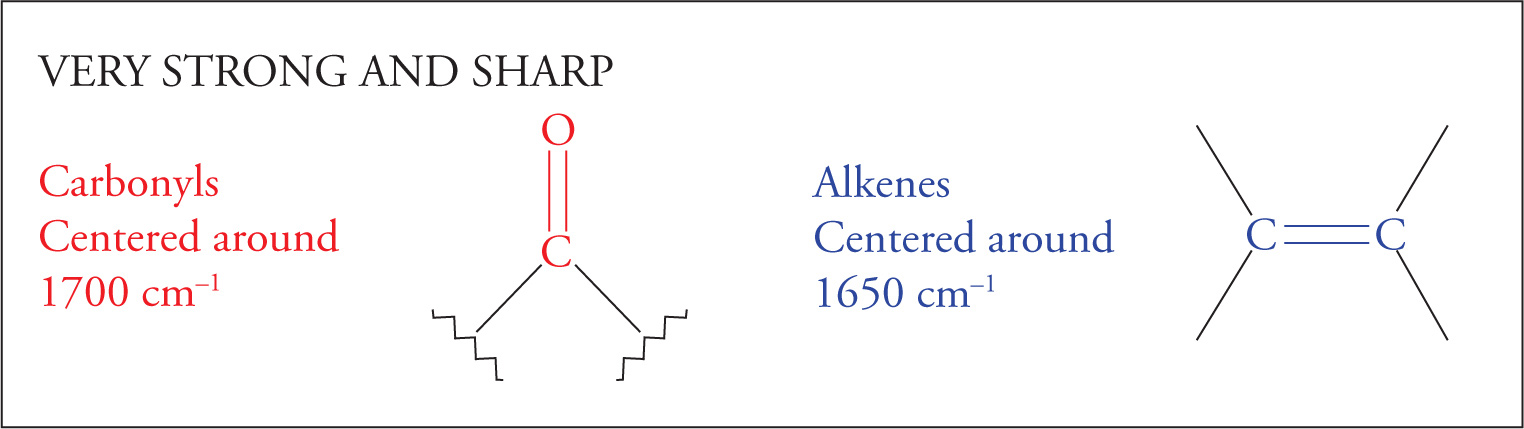
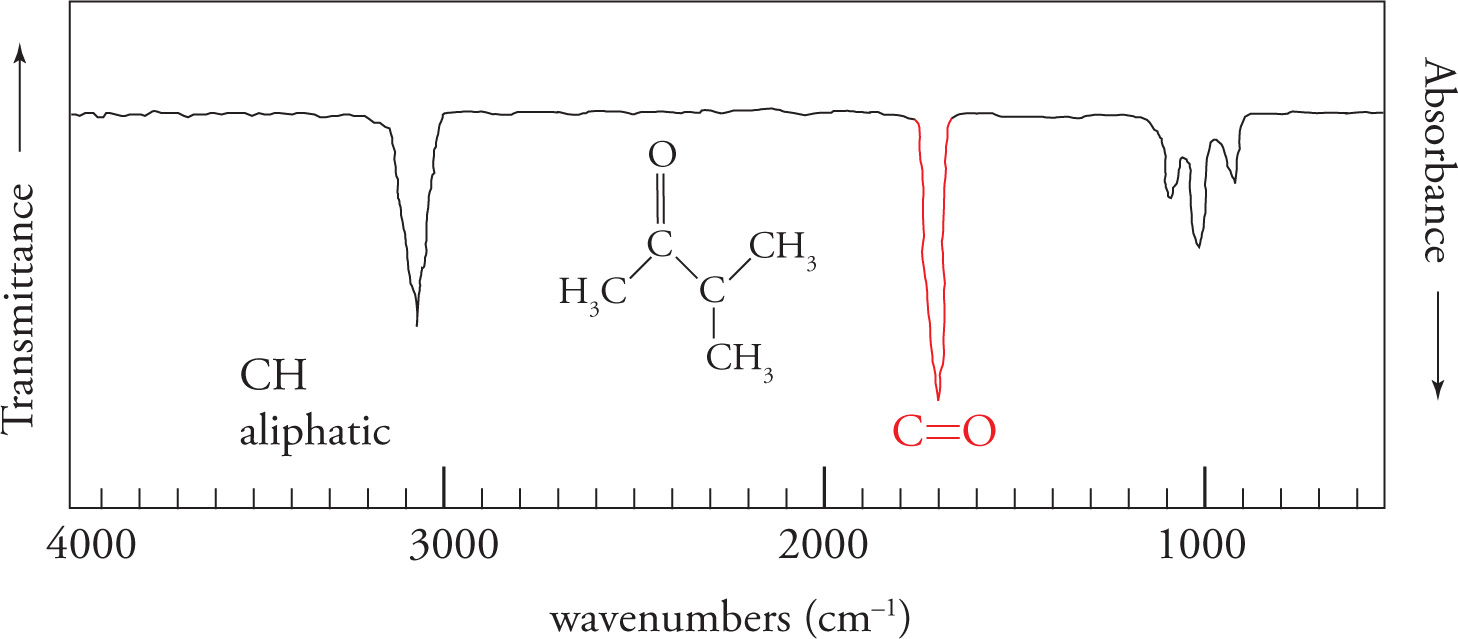
We’ll begin by examining the carbonyl, or C=O, stretch. The carbonyl stretch is centered around 1700 cm−1 and is very strong and very intense. Strength is reflected in the percent absorbance (or transmittance). Intensity is reflected in the sharpness or distinctiveness (“V” shape) of the spike appearing on the spectrum. The carbonyl stretch is one of the most important absorptions, and you should commit its location to memory. In any spectrum, always look for this stretch first. If it is not present, you can eliminate a wide range of compounds that contain a carbonyl group, including aldehydes, ketones, carboxylic acids, acid chlorides, esters, amides, and anhydrides. On the other hand, if the carbonyl stretch is present, you know that one of the carbonyl-containing functional groups is indeed present.
The C=C double bond stretch will appear slightly lower in the spectrum, near 1650 cm−1.
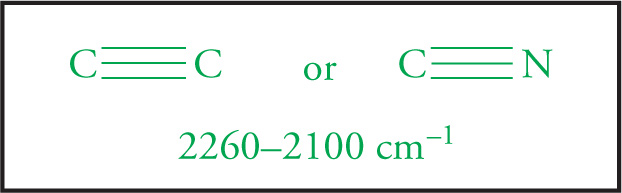
The Triple Bond Stretch The next stretch to consider is the triple bond. This is an easy one because few molecules possess these functional groups. If they are present, however, the following characteristic stretches will be seen:
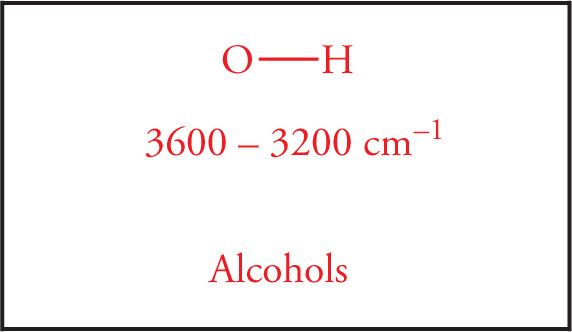
The O—H Stretch Next we come to the hydroxyl stretch. The O—H stretch is strong and very broad. Strength is reflected as the degree of absorption a peak displays in the spectrum. Broadness is reflected as a wide “U”-shaped appearance on the absorption spectrum, as opposed to a “V,” or spiked shape. The broadness is due to hydrogen bonding. Like the carbonyl stretch that occurs at 1700 cm−1, one should always look for the O—H stretch at 3600−3200 cm−1. Amines also have stretches in this region although they vary in intensity.
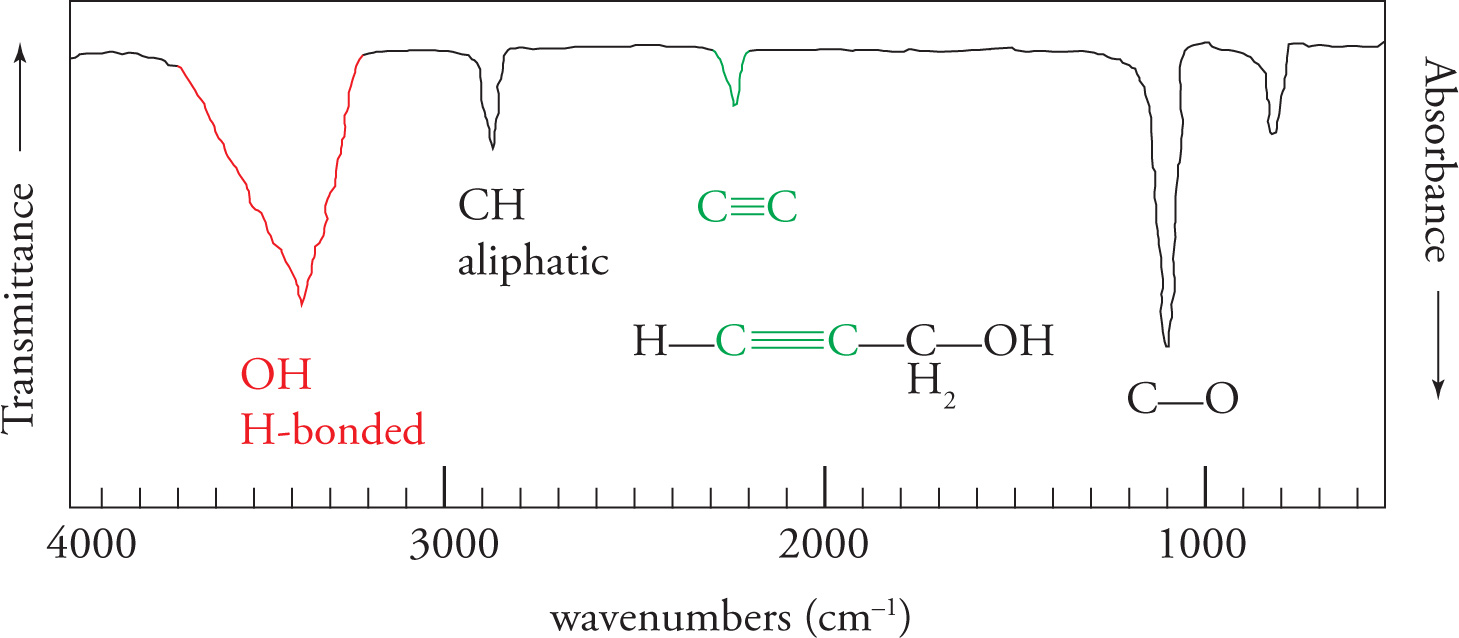
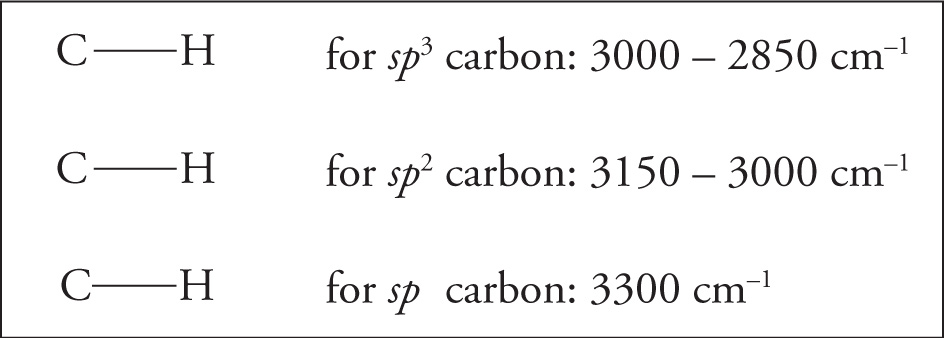
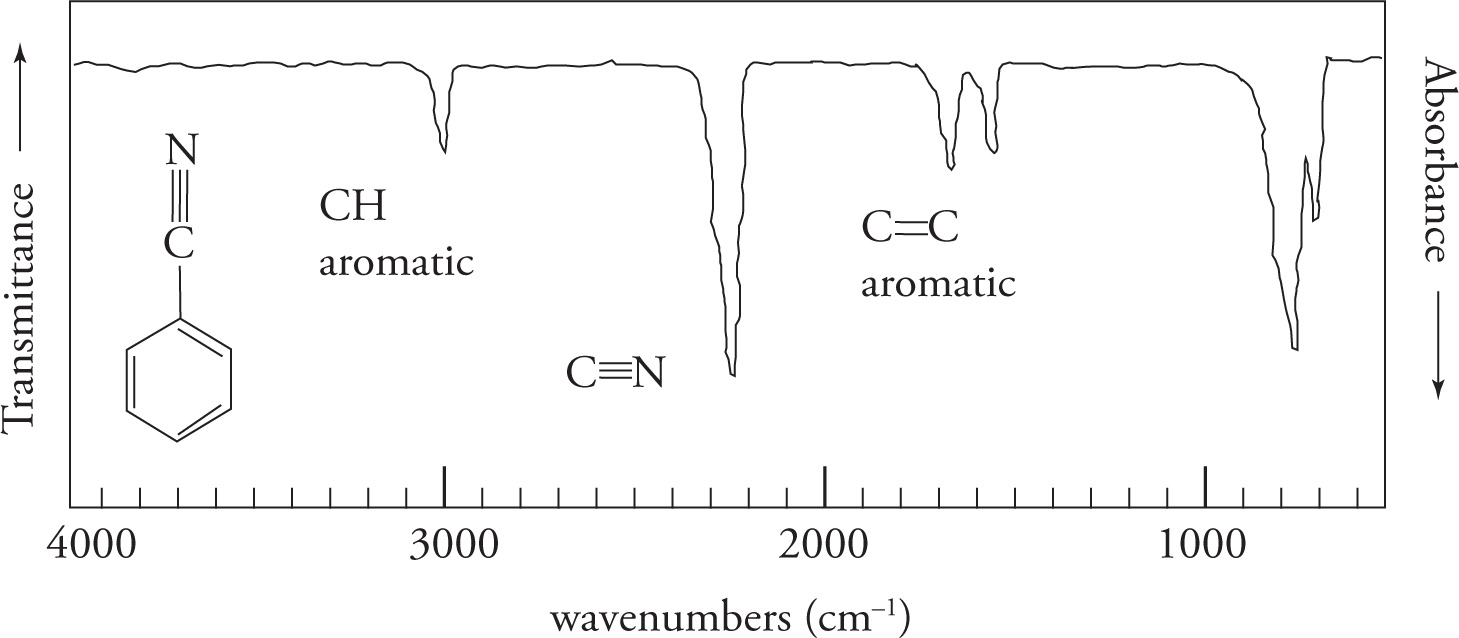
The C—H Stretches Finally we come to the C—H stretching region (3300—2850 cm−1). Since the vast majority of organic compounds contain C—H bonds, you will almost always see absorbances in this region. Note that aliphatic C—H bonds stretch at wavenumbers a little less than 3000 cm−1, and aromatic C—H bonds stretch at wavenumbers slightly greater than 3000 cm−1.
Summary of Relevant Infrared (IR) Stretching Frequencies
1H Nuclear Magnetic Resonance (NMR) Spectroscopy
1H NMR spectroscopy, commonly called proton NMR, is the third type of absorption spectroscopy that we will consider. In all types of NMR spectroscopy, light from the radio frequency range of the electromagnetic spectrum is used to induce energy absorptions. The interpretation of 1H NMR spectral data is important for the MCAT, but the theory underlying NMR spectroscopy is beyond the scope of the exam. Here, we’ll only cover the interpretation of 1H NMR spectra.
Four essential features of a molecule can be deduced from its 1H NMR spectrum, and while we’ll review all four, it is most important for the MCAT to focus on the first two. First, the number of sets of peaks in the spectrum tells one the number of chemically nonequivalent sets of protons in the molecule. Second, the splitting pattern of each set of peaks tells how many protons are interacting with the protons in that set. Third, the mathematical integration of the sets of peaks indicates the relative numbers of protons in each set. Fourth, the chemical shift values of those sets of peaks gives information about the environment of the protons in that set. These four key features of 1H NMR spectroscopy are explained in the next four sections.
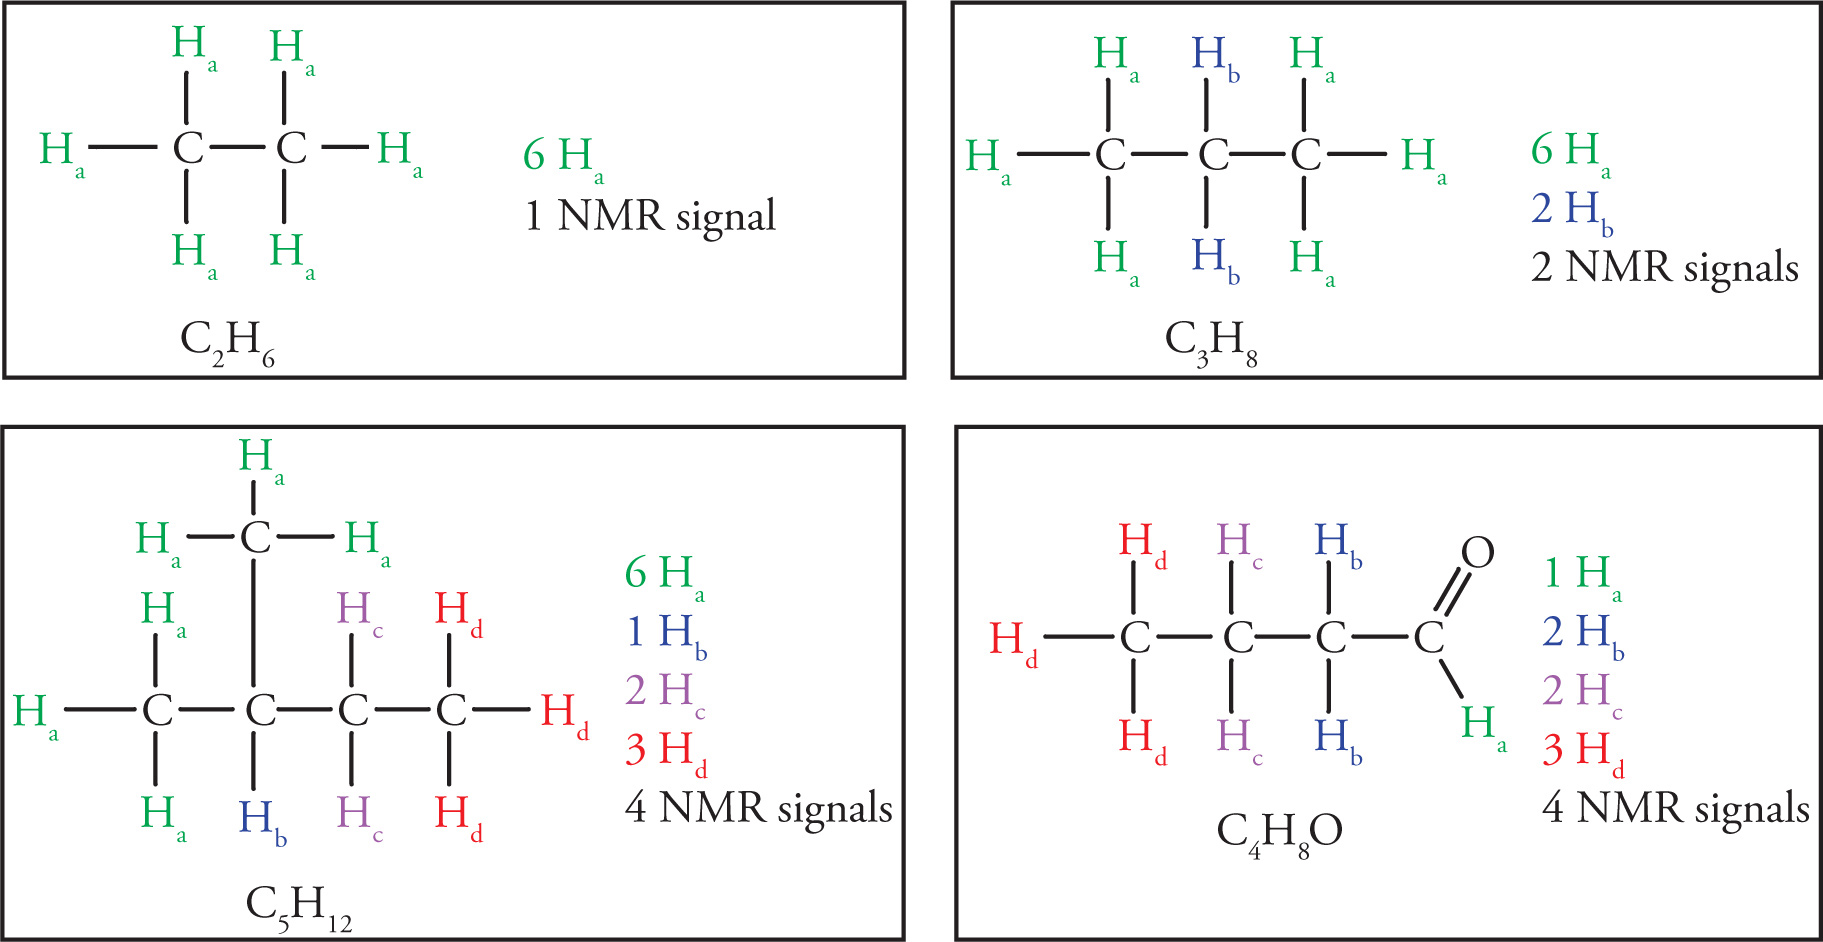
Chemically Equivalent Hydrogens
Determining which hydrogens, or protons, are equivalent in an organic molecule is the first important skill to master with respect to NMR spectroscopy. Equivalent hydrogens in a molecule are those that have identical electronic environments. Such hydrogens have identical locations in the 1H NMR spectrum, and are therefore represented by the same signal, or resonance. Nonequivalent hydrogens will have different locations in the 1H NMR spectrum and be represented by different signals. One must be able to determine which hydrogens (or, usually, groups of hydrogens) are equivalent to which other groups, so that you can predict how many distinct NMR signals there will be in any 1H NMR spectrum. Hydrogens are considered equivalent if they can be interchanged by a free rotation or a symmetry operation (mirror plane or rotational axis). Check yourself on the following examples:
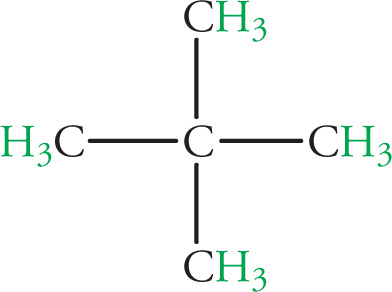
Example 5-5: A hydrocarbon C5H12 shows only one peak on its 1H NMR spectrum. Identify its structure.
Solution: Compute the degrees of unsaturation: d = [2(#C) + 2 − (#H)]/2. In this case, d = 0, so there are no double bonds or rings. Because there is only one peak in the 1H NMR spectrum, all protons are equivalent, and thus our molecule must be:
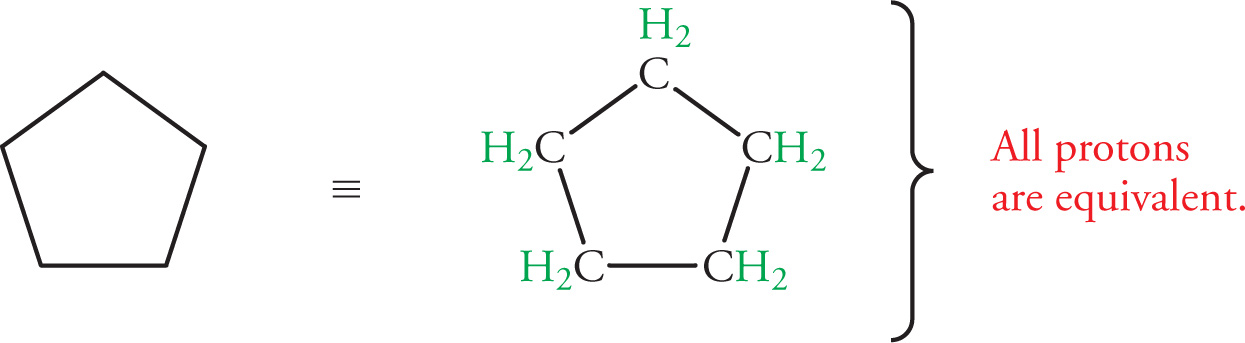
Example 5-6: C5H10 also has an 1H NMR spectrum showing only one peak. Identify its structure.
Solution: Here, d = [2(#C) + 2 − (#H)]/2 = 1, so the molecule has a double bond or ring. All C5H10 variations with a double bond have more than one type of proton. But in cyclopentane, all hydrogens are equivalent due to the presence of a five-fold axis of symmetry:
Splitting
The second aspect of NMR spectroscopy that you should be familiar with is the spin-spin splitting phenomenon. This occurs when nonequivalent hydrogens interact with each other. This interaction exists because the magnetic field felt by a proton is influenced by surrounding protons. This effect tends to fall off with distance, but it can often extend over two adjacent carbons. Nearby protons that are nonequivalent to the proton in question will cause a splitting in the observed 1H NMR signal. The degree of splitting depends on the number of adjacent hydrogens, and a signal will be split into n + 1 lines, where n is the number of nonequivalent, neighboring (interacting) protons. The important information one must determine is how a proton or a group of chemically equivalent protons will be split by their hydrogen neighbors.
This is best demonstrated by an example:
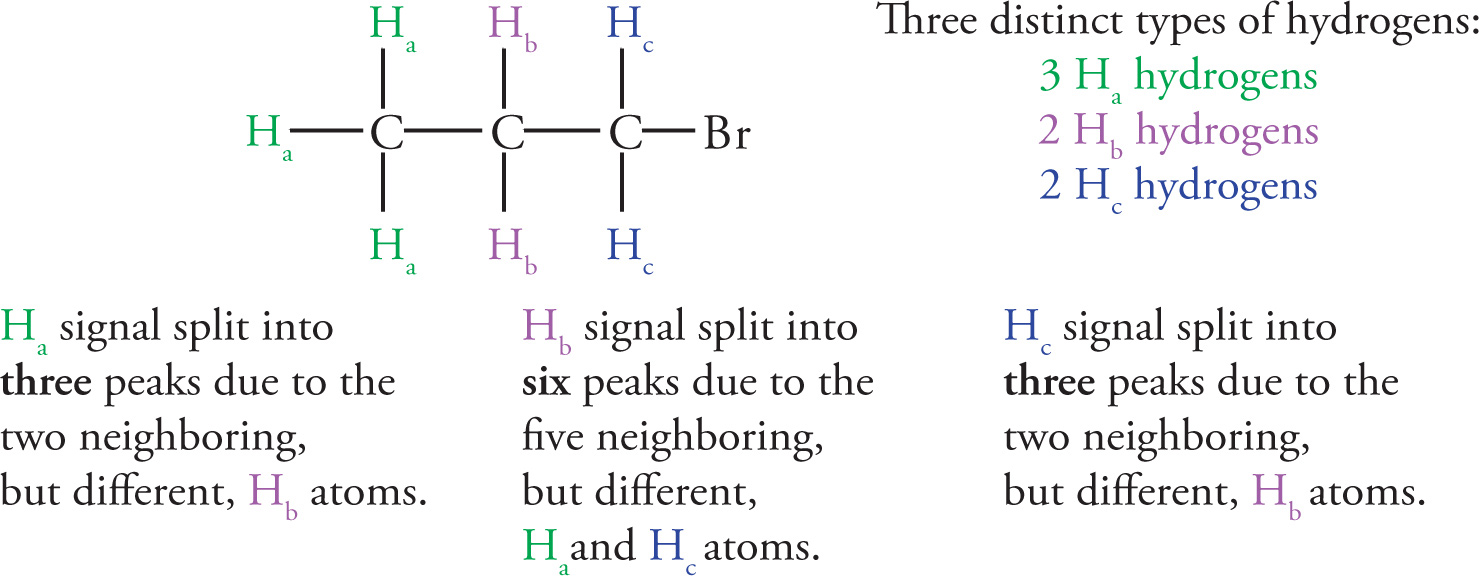
Note that, for MCAT purposes, the Ha and Hc protons neighboring Hb do not have to be equivalent in order to add them together to get n = 5.
n + 1 RULE
n = Number of neighboring nonequivalent hydrogens |
Splitting (n +1) |
0 |
1—Singlet |
1 |
2—Doublet |
2 |
3—Triplet |
3 |
4—Quartet |
4 |
5—Quintet (or multiplet) |
5 |
6—Sextet (or multiplet) |
Consider the NMR spectrum of CH3CH2I:
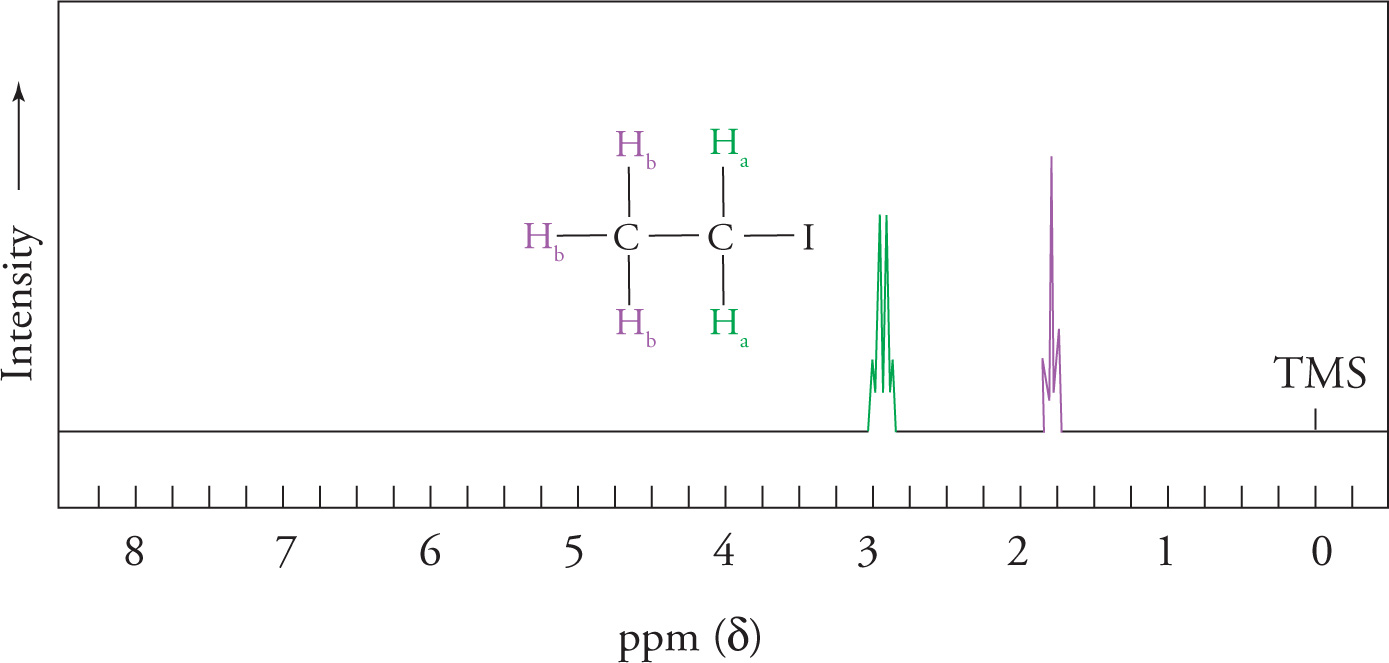
The α-hydrogens have three neighboring hydrogens and are therefore split into a quartet, according to the n + 1 rule. The β-hydrogens are split into a triplet because they have two neighboring hydrogens.
Example 5-7: How many 1H NMR signals would you expect to find for the following molecules? What is the splitting pattern of each signal?
(a) 
(b) 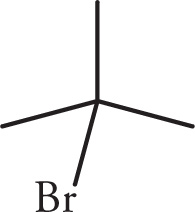
(c) 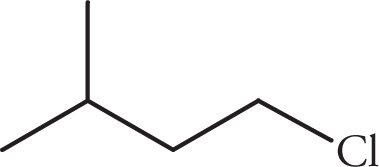
(d) 
Solution:
(a) Three signals. C1’s equivalent protons are split by two Hs on C2 to make a triplet. C2’s protons are split by a total of five Hs on C1 and C3 to make a sextet, or multiplet. C3’s protons are split by two Hs on C2 to make a triplet.
(b) One signal; all are equivalent, therefore no splitting.
(c) Four signals. C1’s equivalent protons are split by two Hs on C2 to make a triplet. C2’s protons are split by a total of three Hs on C1 and C3 to make a quartet. C3’s proton is split by eight neighboring protons to make a multiplet. C4 and C5 have equivalent protons, split by C3’s proton and forming a doublet.
(d) Three signals. The first proton signal is from the H on C3 (the one bearing the Br). It is split by three Hs on C4 to make a quartet. The Hs on C4 are split by the one H on C3 to yield a doublet. The remaining Hs on the tert-butyl group are equivalent (nine total), have no neighbors, and appear as a singlet.
Integration
The third important piece of information obtained from the 1H NMR spectrum of a molecule is the mathematical integration. As the NMR instrument obtains a spectrum of the sample, it performs a mathematical calculation, called an integration, thereby measuring the area under each absorption peak (resonance). The calculated area under each peak is proportional to the relative number of protons giving rise to each peak. Thus, the integration indicates the relative number of protons in each set in the molecule.
The Chemical Shift
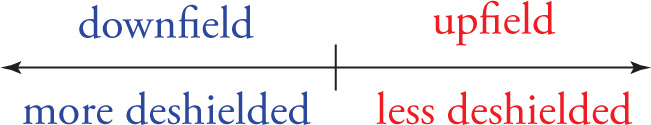
The fourth and final aspect of an NMR spectrum is the chemical shift, which indicates the location of the resonance (set of peaks) in the 1H NMR spectrum. Differences in the chemical shift values for different sets of protons in a molecule are the result of the differing electronic environments that different sets of protons experience. The magnetic field created by electrons near a proton will shield the nucleus from the applied magnetic field created by the instrument, shifting the resonance upfield. The more a proton is deshielded (i.e., the more distorted away from the atom the electron cloud is), the further downfield (to the left) in an NMR spectrum it will appear. For example, a set of protons near an electronegative group is said to be deshielded and will appear downfield (to the left) in the 1H NMR spectrum, relative to a set of protons that are farther away from the electronegative group, which is more shielded and appears more upfield (to the right) in the 1H NMR spectrum.
We now briefly examine the factors involved in proton deshielding. These include:
1. the electronegativity of the neighboring atoms
2. hybridization
3. acidity and hydrogen bonding
Electronegativity Effects on Chemical Shift Values
If an electronegative atom is in close proximity to a proton, it will decrease the electron density near the proton and thereby deshield it. This will result in a downfield shift in the chemical shift value. Examples:
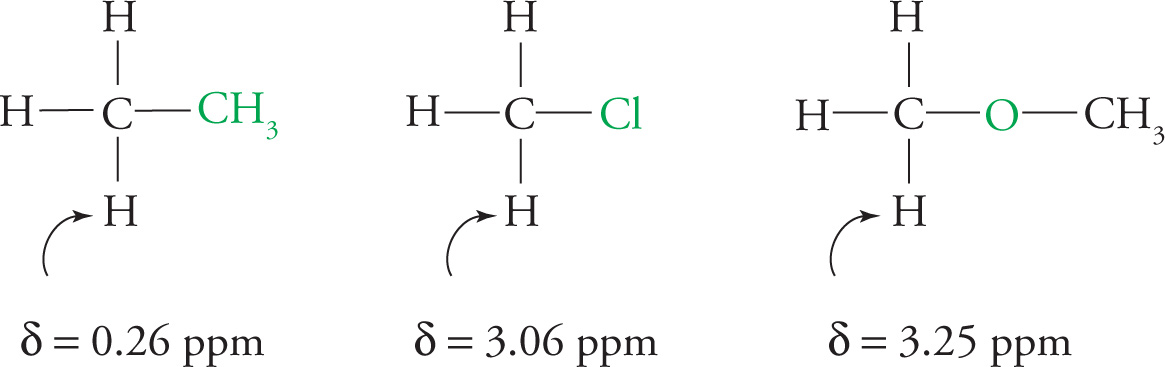
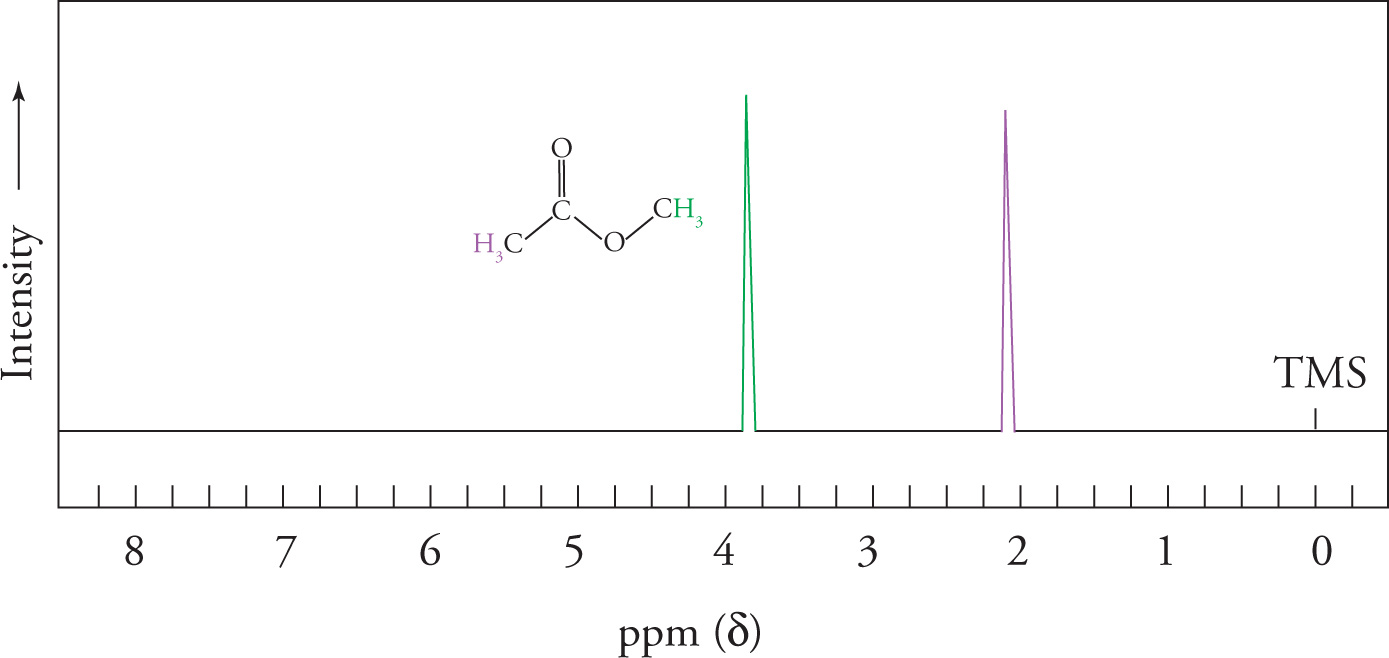
The spectrum of methyl acetate below shows how the two electronegative groups in the molecule (the O of the ester and the carbonyl) contribute to shifting both methyl signals downfield.
Hybridization Effects on Chemical Shift Values
The hybridization effect occurs as a result of the varying bond characteristics of carbon atoms connected to the hydrogens. The greater the s-orbital character of a C—H bond, the less electron density on the hydrogen. Thus, when considering the hybridization effect alone, the greater the s-orbital character, the more deshielded the set of protons is, which will result in a downfield shift for the peak corresponding to that set of protons. Here is an example:
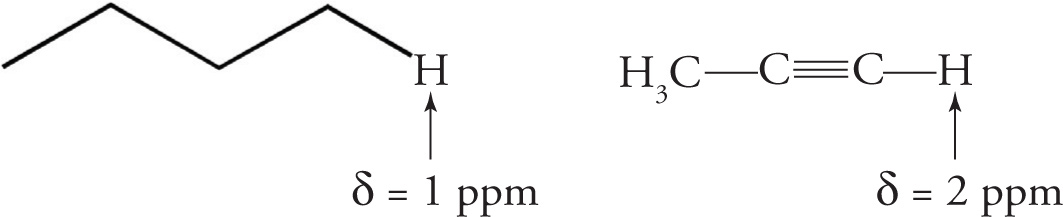
Hybridization effects alone would indicate the alkyne proton to be more deshielded than the alkene proton. However, due to a more complicated physical phenomenon, which is beyond the scope of the MCAT, this turns out not to be the case. To simplify for the MCAT, two other very characteristic chemical shifts you should be familiar with are that of the aromatic protons (δ = 6.5−8 ppm) and alkene protons (δ = 5−6 ppm).
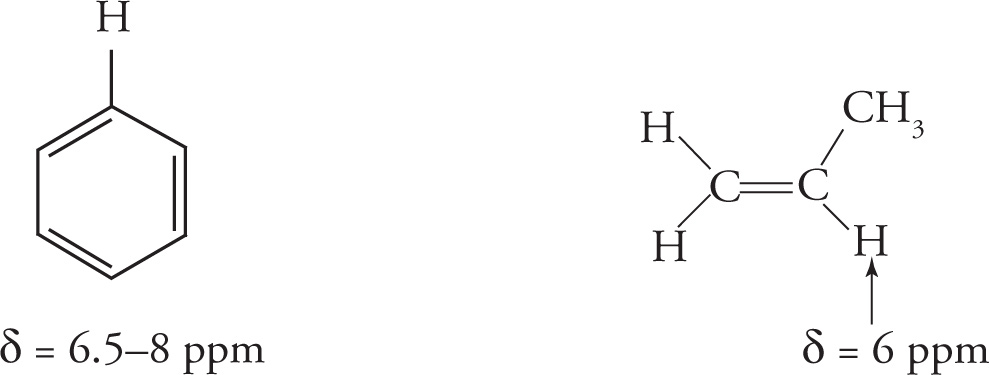
Acidity and Hydrogen Bonding Effects on Chemical Shift Values
Protons that are attached to heteroatoms (oxygen and nitrogen, for example) are quite deshielded. Acidic protons on a carboxylic acid are an extreme example of a very large downfield shift. In addition, hydrogen bonding can cause a wide variation of chemical shift. For example, the resonance of the alcohol proton in methanol varies with both solvent and temperature (different degrees of H bonding).
You should also be aware that the chemical shifts of alcohol protons are quite variable depending upon the particular compound, but are in the range of δ = 2−5 ppm.
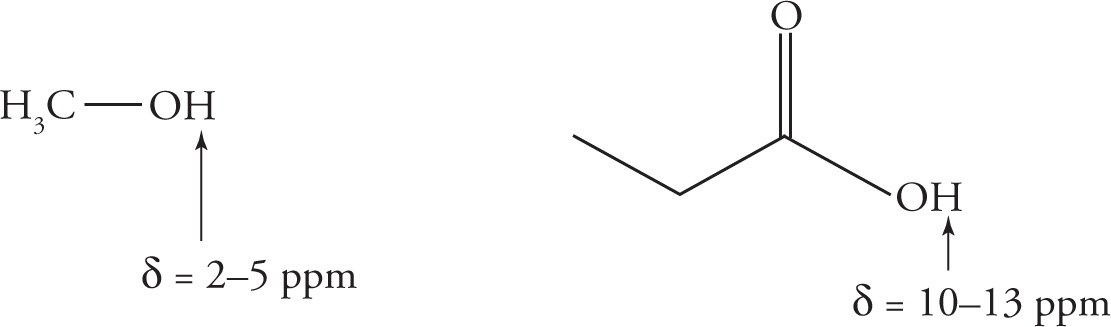
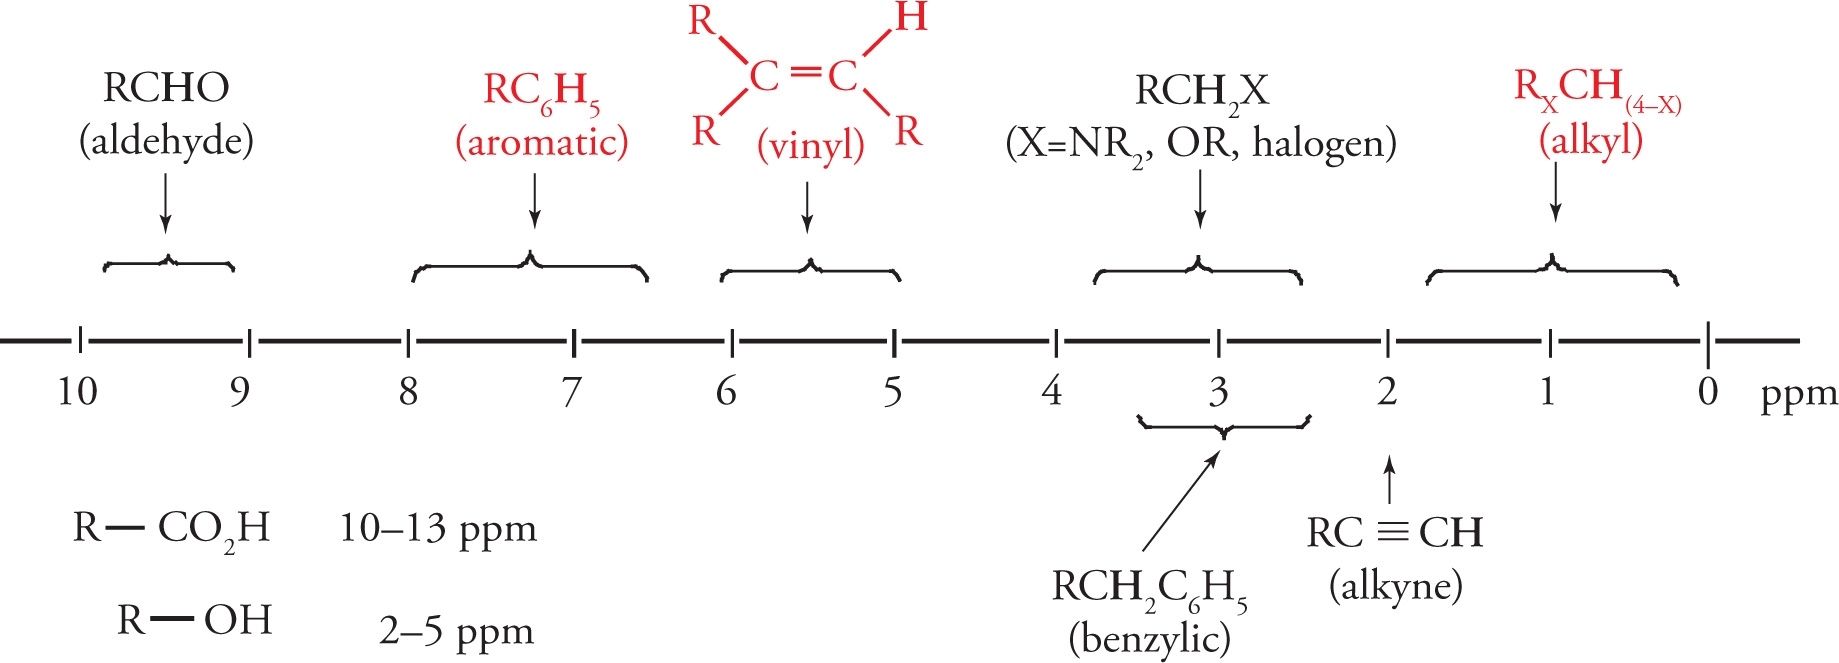
As with IR stretching frequencies, memorizing some commonly encountered 1H NMR chemical shift values will be helpful. Below is a correlation chart for some common chemical shifts, the most important of which are in red:
Chapter 5 Summary
• Organic compounds are separated via extraction based on their differing solubility in aqueous or organic solvents.
• Organic acids (COOHs and PhOHs) and bases (amines) can undergo acid-base reactions to generate ions, which preferentially dissolve in the aqueous layer during an extraction.
• Thin layer chromatography (TLC) separates molecules based on polarity; the more polar compound travels the least distance up the plate and has the lowest Rf value.
• Ion exchange, HPLC, size exclusion, and affinity chromatography are similar in nature to column chromatography and generally use a mobile and stationary phase for separating compounds. They are generally used to separate bio-molecules like amino acids, proteins, or nucleic acids.
• Distillation and gas chromatography separate compounds based on boiling point.
• UV/Vis spectroscopy indicates the presence of a conjugated π system in a molecule, whereas IR spectroscopy identifies the functional groups present in molecules.
• The most common IR resonances tested on the MCAT are the C=O bond (≈1700 cm−1), the C=C bond (≈1650 cm−1) and the O—H bond (≈3600 cm−1).
• The number of resonances in a 1H NMR spectrum indicates the number of non-equivalent hydrogens present in a molecule.
• Splitting in a 1H NMR spectrum occurs when one H has nonequivalent protons located on an adjacent atom (signal will be split into n + 1 lines; n = # of nonequivalent adjacent hydrogens).
• The number of Hs each signal represents is determined by the integration of the peak.
• Protons that are more deshielded (near electronegative groups) will be further downfield (at higher ppm), and protons that are more shielded (near electron donating groups) will be more upfield (at lower ppm).
CHAPTER 5 FREESTANDING PRACTICE QUESTIONS
1. The 1H NMR spectrum for Compound X shows one peak at 7.4 ppm. If elemental analysis shows that the compound has an empirical formula of CH, how many possible stereoisomers could Compound X have?
A) 0
B) 1
C) 2
D) 4
2. How many resonances would appear in a 1H NMR spectrum of the following compound?
A) 3
B) 5
C) 7
D) 13
3. Consider the following reaction:
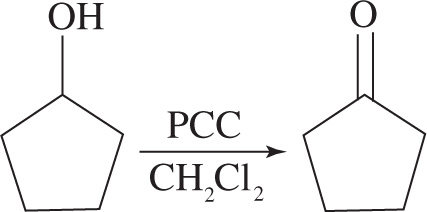
Which of the following observations about the infrared spectrum of the reaction mixture would indicate that the reaction above went to completion yielding the expected product?
A) The appearance of a stretch at 1700 cm−1.
B) The disappearance of a stretch at 3300 cm−1.
C) The disappearance of a stretch at 3300 cm−1 and the appearance of a stretch at 1700 cm−1.
D) The disappearance of a stretch at 1700 cm−1 and the appearance of a stretch at 3300 cm−1.
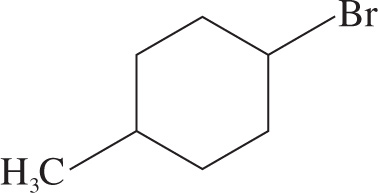
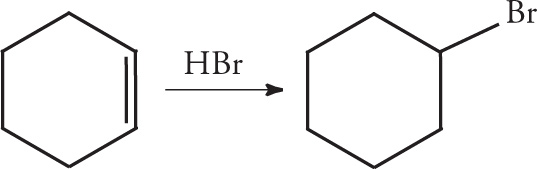
4. For the following reaction, how would the Rf value of the product compare to that of the starting material if monitored by TLC on a normal silica gel plate?
A) The Rf value of the product would be greater than that of the reactant because the product is more polar.
B) The Rf value of the product would be greater than that of the reactant because the product is less polar.
C) The Rf value of the product would be smaller than that of the reactant because the product is more polar.
D) The Rf value of the product would be smaller than that of the reactant because the product is less polar.
5. What will the 1H NMR spectrum of isobutane show?
A) One 6 H triplet and one 4 H quartet
B) Two 3 H triplets and two 2 H quartets
C) One 9 H doublet and one 1 H multiplet
D) One 6 H triplet, one 2 H multiplet, and one 2 H triplet
6. Which of the following fatty acids has the highest melting point?
A) (3E, 5E)-octa-3,5-dienoic acid
B) (3E, 5E)-deca-3,5-dienoic acid
C) (3Z, 5Z)-octa-3,5-dienoic acid
D) (3Z, 5Z)-deca-3,5-dienoic acid
7. Infrared spectroscopy could be used to discern which two molecules from each other?
I. An amine and an imine
II. An alcohol and a carboxylic acid
III. Glucose and fructose
A) II only
B) I and II only
C) I and III only
D) I, II, and III
CHAPTER 5 PRACTICE PASSAGE
The insecticide dichlorodiphenyltrichloroethane, more commonly known as DDT, was a great aid in slowing the spread of malaria during the 1940s and 1950s. However, it proved to be an environmental threat because it contaminated soils and had toxic effects on wildlife that fed on the crops and insects treated with the pesticide.
The toxin has been shown to be lethal to many animals and has been linked to diabetes and asthma in humans. To assess contamination in wildlife, levels of DDT are determined by taking samples of blood from the animals, treating them with 60% sulfuric acid, then extracting them with hexane, a non polar solvent with a boiling point of 69°C.
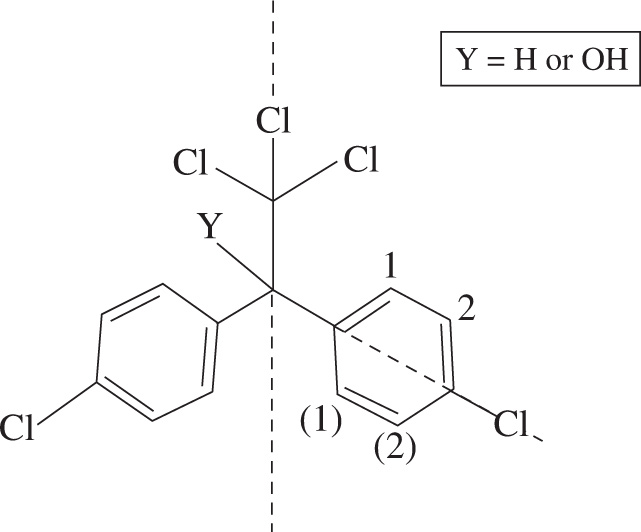
Dicofol is a synthetic analog of DDT and is commonly used as an insecticide targeting red spider mites. Like DDT, it has been shown to be mildly toxic to humans and other animals. However, dicofol is still a widely used pesticide in California and Florida.
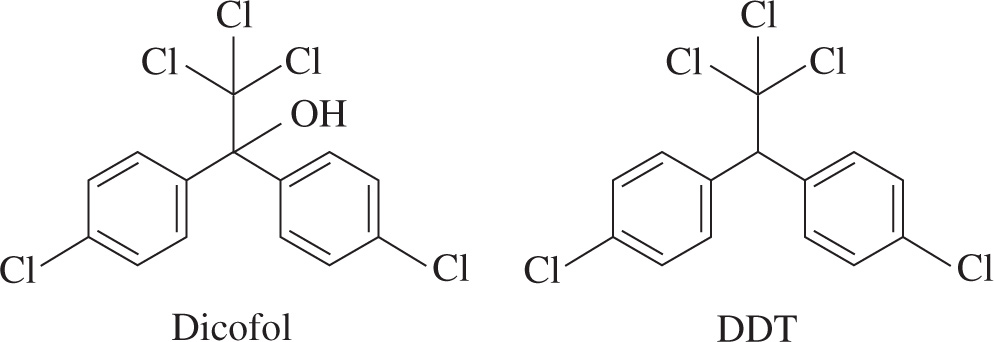
Figure 1 Dicofol and DDT
1. A scientist took a sample of blood from a bird to determine the level of toxins in the ecosystem. In which layers did she find DDT and dicofol after extraction of the blood with hexane?
A) The aqueous layer would contain dicofol, and the organic layer would contain DDT.
B) The aqueous layer would contain DDT, and the organic layer would contain dicofol.
C) Both compounds would be found in the aqueous layer.
D) Both compounds would be found in the organic layer.
2. How would the Rf values of DDT and dicofol differ when tested via TLC?
A) The Rf value of DDT would be larger than that of dicofol.
B) The Rf value of dicofol would be larger than that of DDT.
C) The Rf value would be negative for DDT and positive for dicofol.
D) The Rf values would be equal.
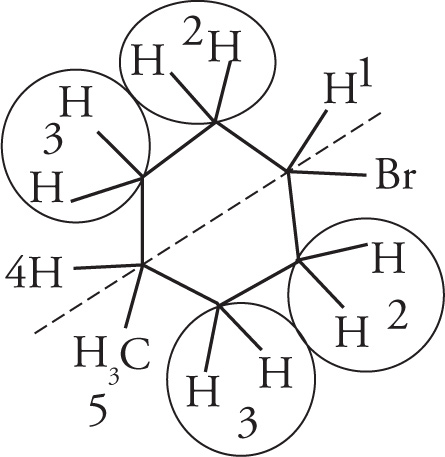
3. How many signals would you expect to see in the 1H NMR spectra of DDT and dicofol?
A) 5 and 9 signals, respectively
B) 3 signals in each spectrum
C) 5 signals in each spectrum
D) 9 signals in each spectrum
4. Which of the following methods of identification would most conclusively determine the presence of DDT in a blood sample after extraction with hexane?
A) Mass spectrometry
B) IR spectroscopy
C) Flash chromatography
D) Simple distillation
5. DDT and dicofol have melting points of 109°C and 79°C, respectively, and both compounds decompose before reaching their boiling points. Which of the following methods should be avoided when purifying the compounds?
I. Column chromatography
II. Gas chromatography
III. Fractional distillation
A) I only
B) I and II only
C) II and III only
D) I, II, and III
SOLUTIONS TO CHAPTER 5 FREESTANDING PRACTICE QUESTIONS
1. A One signal on the 1H NMR spectrum tells us that the molecule has only one type of hydrogen. Since the empirical formula of Compound X is CH and the molecule contains no electronegative elements to shift the signal downfield, the single peak, located in the region common for aromatic hydrogens (7−8 ppm), must represent an aromatic H. Any compound with only aromatic Hs must have carbons that are all sp2 hybridized, and as such will have no stereoisomers. In this case, the compound is benzene (C6H6).
2. B By showing the hydrogens, one would expect the molecule to have five resonances in a 1H NMR spectrum. Note the plane of symmetry through the molecule (as shown with the dotted line). Both sets of CH2 hydrogens on the carbons adjacent to the bromo and methyl substituents are chemically equivalent to each other.
3. C The reaction is a transformation from an alcohol to a ketone. In an infrared spectrum, this can be noticed by the disappearance of the broad O—H stretch around 3300 cm−1, and the appearance of the C=O stretch at 1700 cm−1. Choices A and B are incorrect because the appearance of the C=O stretch does not automatically translate that the oxidation reaction went to completion and the disappearance of the O—H stretch doesn’t mean that the desired product is formed. In order for the reaction to be complete, one must disappear as the other appears. Choice D is incorrect as the stretches that would appear and disappear are incorrect for the corresponding functional group transformation.
4. C TLC separates compounds based on their polarities. The more polar a compound is, the more it adheres to the silica gel plate, giving it a smaller Rf value. Choices A and D are inconsistent with this type of interaction. The product for this reaction is bromocyclohexane, which is more polar than the reactant due to the presence of the halogen.
5. C The structure of isobutane is shown below. All three terminal CH3 groups are chemically identical, and will show up as one resonance. More specifically, they will correspond to a doublet as they are split by the sole proton on the central carbon. The proton on the central carbon will show up as a multiplet, as it is split by 9 equivalent H atoms. Thus, one 9H doublet and one 1H multiplet is the correct answer.
6. B In general, larger molecules have higher melting points due to increased London dispersion forces. Eliminate choices A and C since they have eight carbons (octa), while the molecules in choices B and D have ten carbons (deca). The remaining difference between B and D is the presence of E or Z double bonds. Z double bonds introduce kinks in the fatty acid chain, making it more difficult for the molecules to pack together, therefore reducing their melting point. This eliminates choice D.
7. B Infrared spectroscopy identifies functional groups. Since all Roman numeral items refer to molecules with different functional groups, choice D is a tempting answer. Item I refers to a molecule with a C—N bond (amine) and a molecule with a C=N bond (imine) which will generate different resonances. Since Item I is true, choice A can be eliminated. Item II compares an alcohol with an −OH group to a carboxyl group (−COOH). While this compound will have an −OH signal in its spectrum, it will also have a peak for the carbonyl making it distinguishable from the alcohol. Since Item II is true, choice C can be eliminated. However, Item III is false, because even though glucose is an aldose (contains an aldehyde), these functional groups both have the C=O bond and their possible regions in the IR spectrum overlap. Thus these molecules would be difficult to distinguish using infrared spectroscopy, making choice B the correct answer.
SOLUTIONS TO CHAPTER 5 PRACTICE PASSAGE
1. D While the carbon-chlorine bonds do have dipole moments, they are not sufficiently large enough to overcome the effects of the nonpolar phenyl rings in DDT, so this compound is highly insoluble in water, eliminating choices B and C. Although the alcohol group present in dicofol makes it more polar than DDT, the effect does not override the nonpolar characteristics of the aromatic rings, so choice A can be eliminated.
2. A Rf values are never negative as they are a ratio of the distance the compound travels compared to the distance the solvent travels, so choice C can be eliminated. The Rf values of polar molecules are lower than the Rf values of nonpolar molecules because they travel a shorter distance up the plate. Dicofol has a hydroxyl group that allows it to interact more strongly with the stationary phase and results in a lower Rf value compared to DDT. Therefore, choices B and D can be eliminated.
3. B Both DDT and dicofol have a mirror plane that runs vertically along the molecule (see below).
This makes the hydrogens on both phenyl rings equivalent to each other, so you can eliminate choice D. You might expect to see four signals in the aromatic region. However, because there is also symmetry within each aromatic ring, the two sets of labeled carbons (C1, C(1)) and (C2, C(2)) on each ring are equivalent to each other, making the Hs attached to them equivalent as well. Instead of seeing four unique signals in the aromatic region of the spectrum, you would only see two. This would give each compound three unique hydrogens when the H on the tertiary C or the hydroxyl hydrogen are accounted for.
4. A Choices C and D are techniques used only for separating molecules, so they can be eliminated. IR spectroscopy is not the best option to conclusively identify a compound since it simply indicates the presence of functional groups. However, mass spectrometry would indicate the exact mass of DDT, and is therefore the best choice.
5. C Since the compounds will decompose before reaching their boiling points, purification methods that require converting these compounds into the gas phase should be avoided. Distillation is a common purification technique that separates compounds based on their boiling points, so if Item III is a correct answer, you can eliminate choices A and B. It should then be clear that gas chromatography, which also converts compounds into the gas phase before separating them, must also be avoided as it appears in both remaining answers. Chromatography of both DDT and dicofol is possible at temperatures below the melting points of the compounds, and there is no need to heat them close to their boiling points, so choice D can be eliminated.