Organic Chemistry: Concepts and Applications - Headley Allan D. 2020
Spectroscopy Revisited, A More Detailed Examination
13.4 Infrared Spectroscopy
Energy of the IR region of the electromagnetic spectrum causes molecular vibrations within the molecules. The bonds in a molecule can be described as springs, which hold the atoms of the molecule together and that there is a constant vibration of the bonds similar to the vibration of a spring. As a result, the energy required to vibrate a strong bond in a molecule is less than the energy required to vibrate a weaker bond. The energy needed for bond vibrations come from the IR region of the electromagnetic spectrum. Thus, a scan of a molecule in the IR region of the EM spectrum gives an indication of the strengths of the different bonds, and hence the type of bonds and functional groups that are present in a molecule.
The bond spring-like vibrations described above are one form of molecular vibration, molecular vibrations can take many forms. Most organic molecules have many atoms, and hence a number of different bonds resulting in different modes of possible molecular vibrations. For a particular molecule, the number of possible molecular vibrations can be calculated. A molecule with N atoms has 3N − 6 normal vibrational modes, and if the molecule is linear, there are 3N − 5 modes since there is a rotation about the linear axis, which cannot be observed. Thus, rotation about a linear axis of a linear molecule, such as CO2, cannot be observed. As a result, the number of possible vibrations for CO2 is 3(3) − 5 = 4, these four vibrational modes for CO2, along with the energy required for each vibrational, are illustrated in Figure 13.7.
The IR spectrum of carbon dioxide is shown in Figure 13.8. It should be pointed out that vibrations that do not result in a net dipole change do not show in IR spectra. As a result, there are only three IR signals shown for CO2 since the vibration at 1340 cm−1 as shown in Figure 13.7 will not give rise to an IR signal.
Water is triatomic molecule and is nonlinear; hence, water has 3(3) — 6 = 3 molecular vibrations. The IR spectrum of water was given in Figure 3.4 of Chapter 3. You will recall that there is a noticeable broad band around 3500 cm−1, which represents two vibrational modes of water and another band around 1600 cm−1, which represents the third vibrational mode of water.
Table 13.2 gives the regions of the IR spectrum where the different functional groups occur in the IR region of the electromagnetic spectrum.
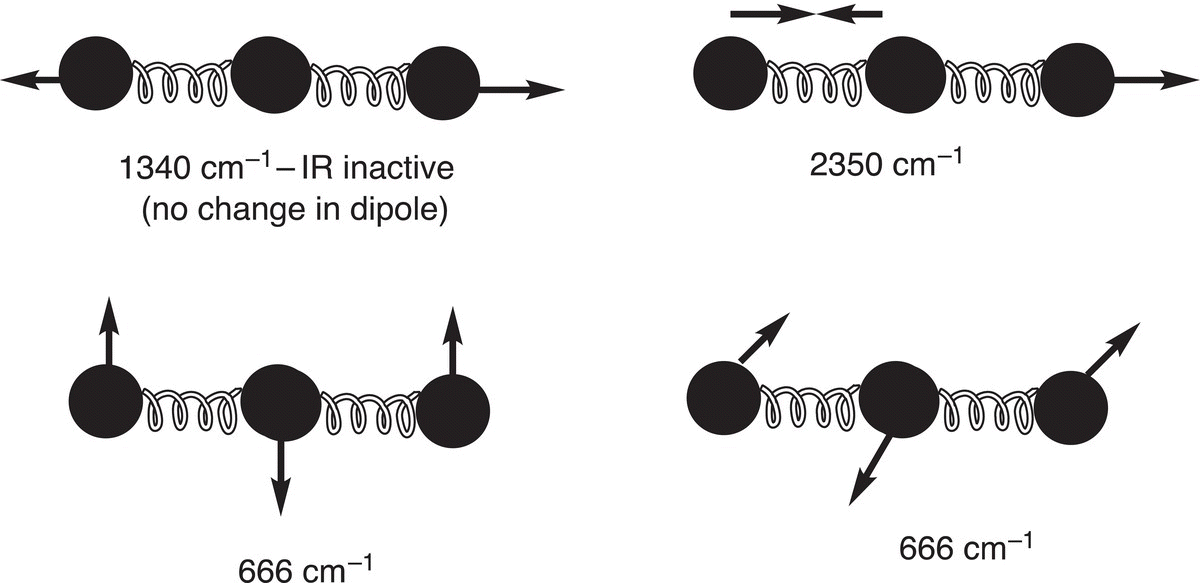
Figure 13.7 Vibrational modes and IR frequencies of carbon dioxide, which is a linear molecule.
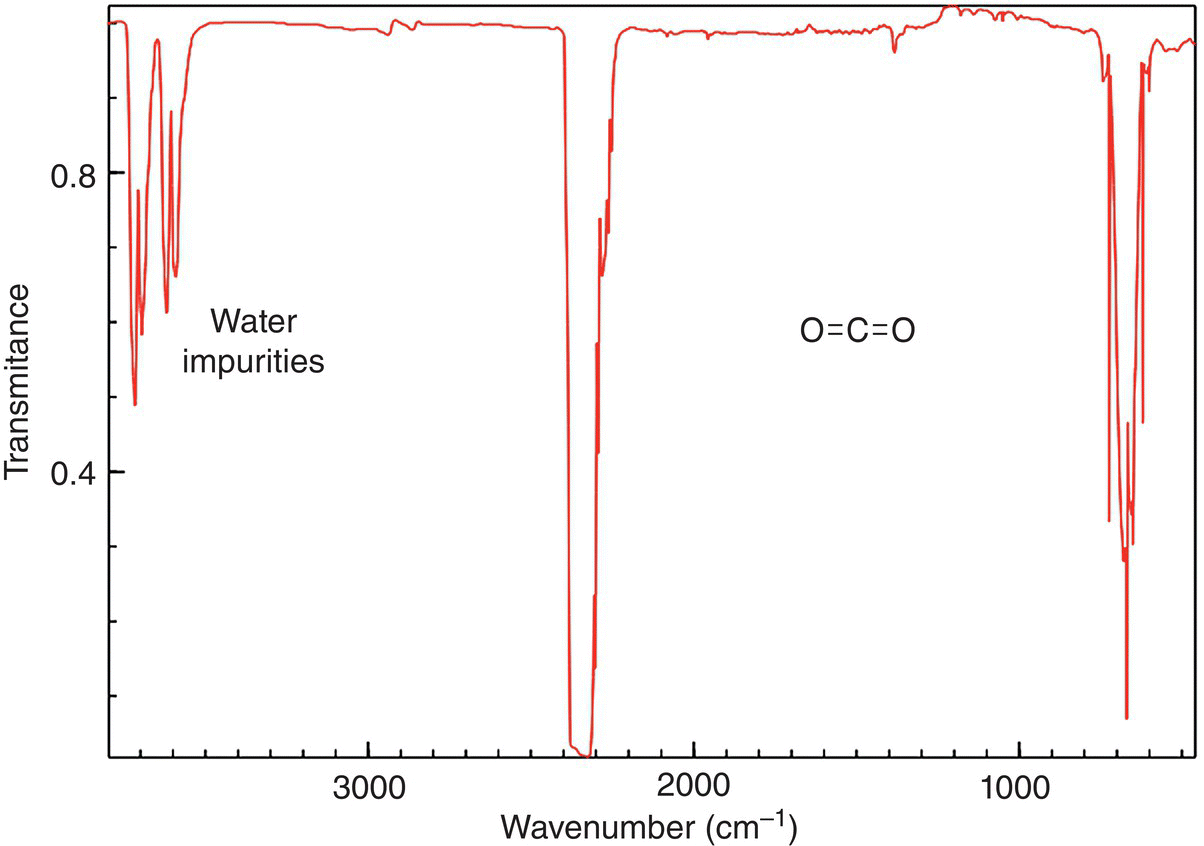
Figure 13.8 IR spectrum of carbon dioxide showing the two vibrational modes.
Source: with permission from NIST.
Table 13.2 IR frequencies of various functional groups.
Bond |
Functional group |
Type vibration |
Frequency (cm−1) |
Intensity |
C─H |
Alkane |
Stretch |
3000—2850 |
s |
CH3 |
Bend |
1450 and 1375 |
m |
|
—CH2— |
Bend |
1465 |
m |
|
Alkenes |
Stretch |
3100—3000 |
m |
|
Out-of-plane bend |
||||
Aromatics |
Stretch |
3150—3050 |
s |
|
Out-of-plane bend |
900—690 |
s |
||
Stretch |
w |
|||
C≡C |
Alkyne |
Stretch |
~3300 |
s |
C═O |
Aldehyde |
1740—1720 |
s |
|
Ketone |
1725—1705 |
s |
||
Carboxylic acid |
1725—1700 |
s |
||
Ester |
1750—1730 |
s |
||
Amide |
1670—1640 |
s |
||
Anhydride |
1810—1740 |
s |
||
Acid chloride |
1800 |
s |
||
C─O |
Alcohol, ethers, esters, carboxylic acids, anhydrides |
1300—1000 |
s |
|
O─H |
Alcohols, phenols |
3650—3600 (free) |
m |
|
Carboxylic acid |
3400—2400 |
m |
||
N─H |
Primary and secondary amines and amides |
Stretch |
2500—3100 |
m |
Bend |
1640—1550 |
m—s |
||
C─N |
Amines |
1350—1000 |
m—s |
|
C═N |
Imines and oximes |
1690—1640 |
m—s |
|
C≡N |
Nitriles |
2260—2240 |
m |
|
X═C═Y |
Allenes, ketenes, isocyanates, isothiocyanates |
2270—1950 |
m—s |
|
N═O |
Nitro (—NO2) |
1550—1350 |
s |
|
S─H |
Thiols |
2250 |
w |
|
S═O |
Sulfoxides |
1050 |
s |
|
Sulfones, sulfonyl chlorides, sulfates, sulfonamides |
1375—1300 |
s |
||
C─X |
X = fluorine |
1400—1000 |
s |
s, strong; m, medium; w, weak.
The information given in Table 13.2 can be used to determine different types of functional groups present in organic molecules. For example, formaldehyde has one functional group (a carbonyl), and based on the information gained from Table 13.2, there should be an IR absorption band around 1700 cm−1. The IR spectrum of formaldehyde is shown in Figure 13.9.
As shown in Figure 13.9, the carbonyl functional vibration is shown at 1717 cm−1. The other signal that is prominent occurs around 3000 cm−1 and represents the C—H vibrations.
The IR spectrum of formic acid is shown in Figure 13.10, note that there are a few prominent bands below 1000 cm−1. There is the expected carbonyl frequency around 1700 cm−1 similar to the carbon—oxygen double bond in the previous molecule, formaldehyde; there is also a band around 2900 cm−1, which indicates the presence of C—H vibrations. There is an obvious broad band that occurs around 3400—3100 cm−1, which indicates the presence of the O—H frequency. Thus, based on the information from the IR spectrum, one conclusion is that the molecule probably has a carboxylic acid functionality. Of course, extreme caution must be exercised since the molecule could be a difunctional molecule with a ketone or aldehyde and an alcohol. We will see later in the chapter, that another type of spectroscopy can be used to gain more specific information about the nature of the functional group that is actually present in the molecule.
As we have demonstrated in the previous section, the correlation of the wavenumbers for the bands of the IR spectrum of an unknown compound with the values given in the table for functional groups can give important information about the type of functional groups that are present in an unknown molecule. This approach can be used for the analysis of larger and more complex molecules. Shown in Figure 13.11 is an IR spectrum for benzoic acid, which has more functional groups, than the ones mentioned earlier.
Note the prominent broad band around 3300−3100 cm—1, which is an indication of the presence of an OH group. There is another prominent band around 1700 cm−1, which is an indication of a carbon−oxygen double bond. There are also some bands below 1000 cm−1. These bands represent carbon−carbon and carbon−hydrogen bond vibrations of the benzene ring.
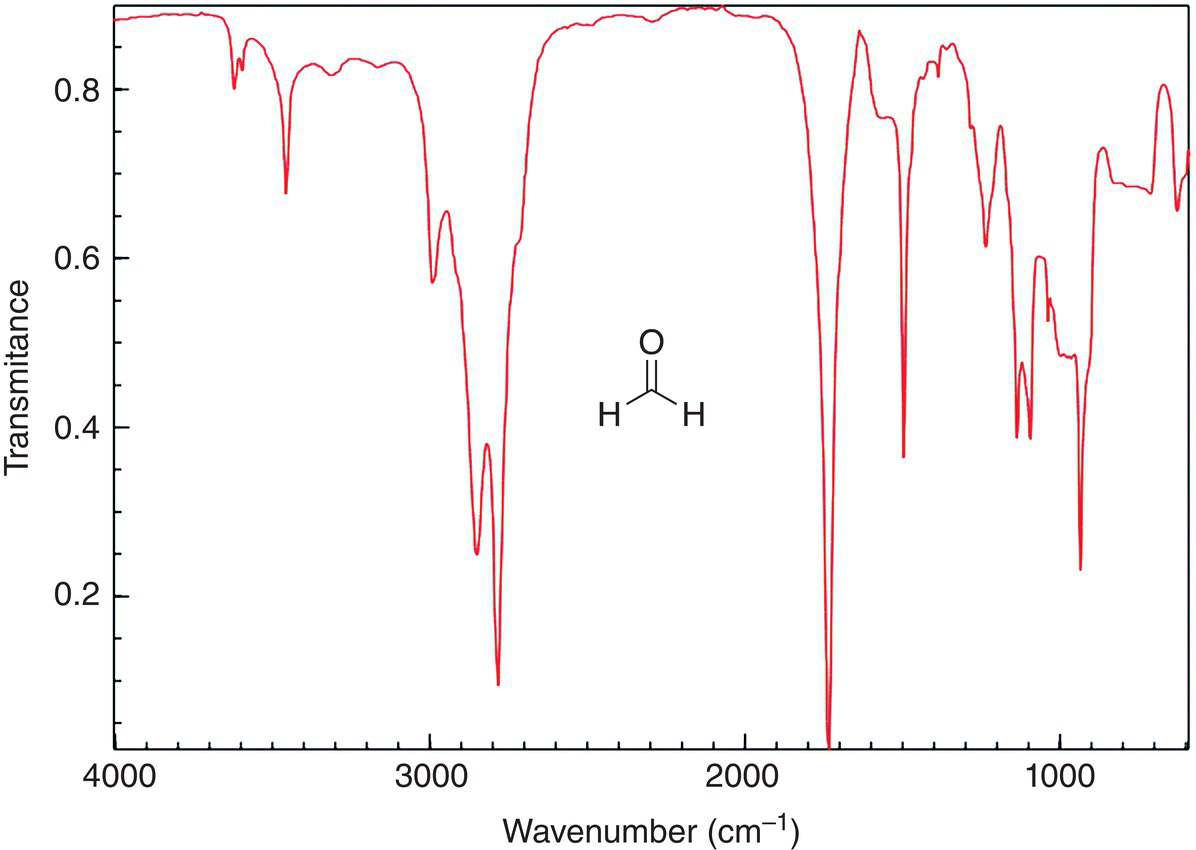
Figure 13.9 IR spectrum of formaldehyde (HCOH).
Source: with permission from NIST.
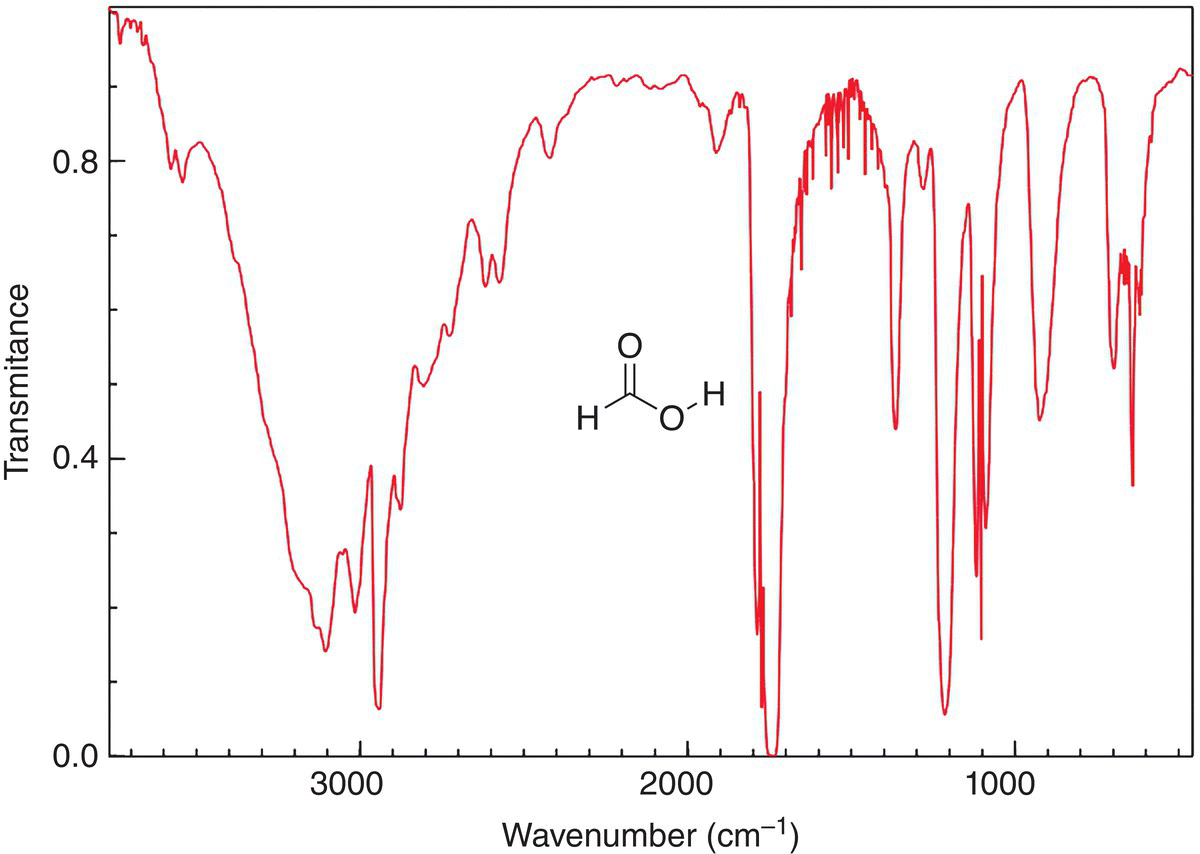
Figure 13.10 IR spectrum of formic acid (HCO2H), showing the O─H and carboxylic acid carbonyl double bond.
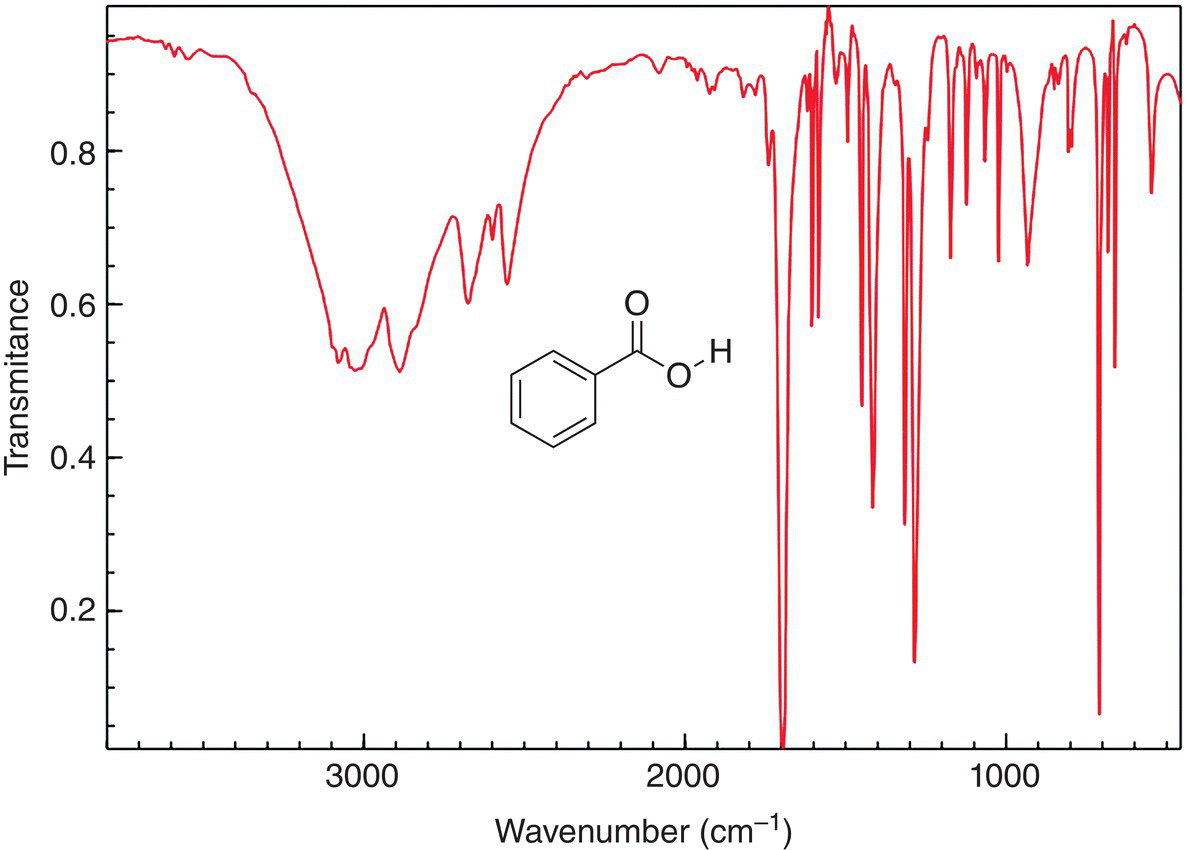
Figure 13.11 IR spectrum of benzoic acid, showing the OH and carboxylic acid carbonyl frequencies.
Figure 13.12 shows the IR spectrum of benzylamine. Note carefully the frequency, which occurs in the region of 3200 cm−1, this band appears with a slight overlap of two bands, which is indicative of a primary amine. Note also that since there is not a carbonyl present in this compound, there is not a band around 1700 cm−1. The bands above 1000 cm−1 represent the carbon−carbon and carbon−hydrogen vibration of the benzene ring.
Figure 13.13 shows the IR spectrum of benzyl alcohol. Note carefully the frequency, which occurs in the region of 3200 cm−1, is slightly different for the benzylamine. For benzyl alcohol, this band is broader and represents the OH stretch. Note also that since there is no carbonyl present in this compound, there is not a band around 1700 cm−1. The bands above 1000 cm−1 represent the carbon—carbon and carbon—hydrogen vibration of the benzene ring. The slight difference between the spectra of benzylamine and benzyl alcohol can be used to identify these compounds.
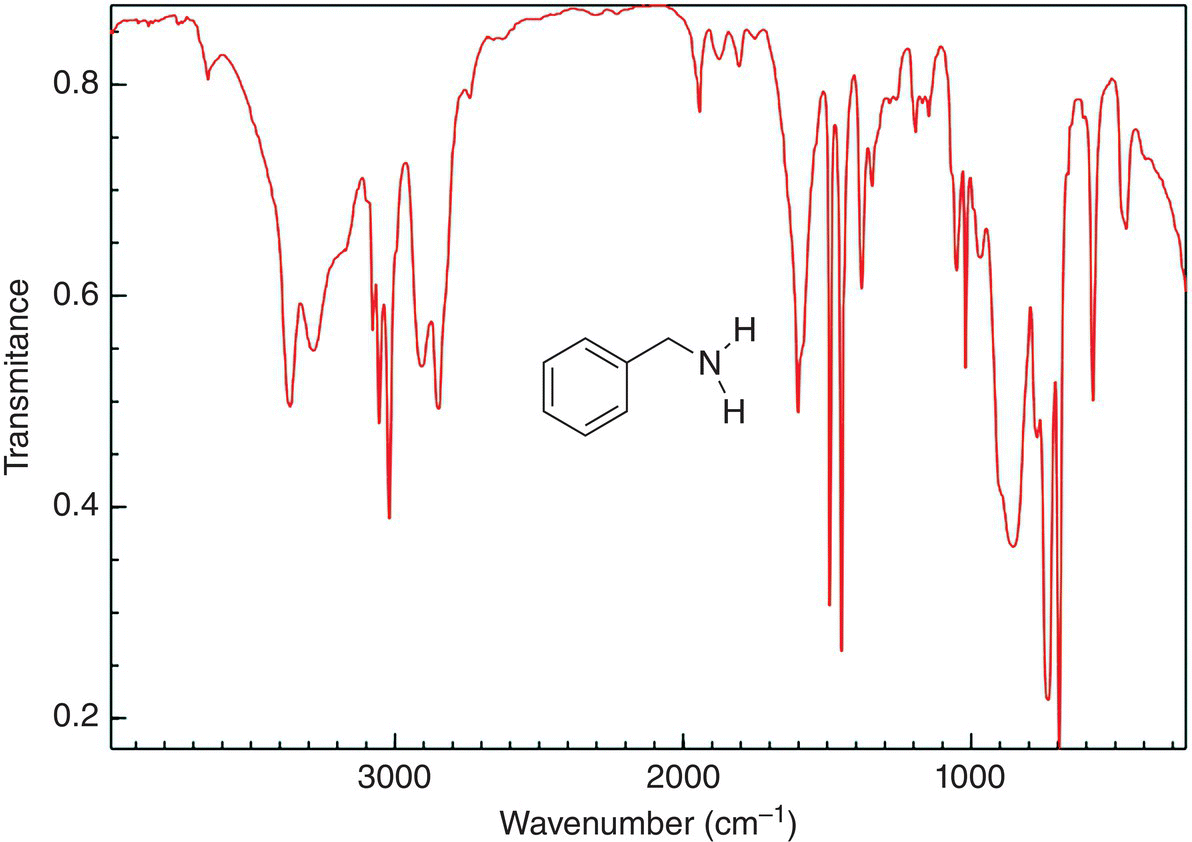
Figure 13.12 IR spectrum of benzylamine, showing the N—H frequencies. Note that there is no frequency in the region of 1710 cm−1 since this molecule does not have a carbonyl group.
Source: with permission from NIST.
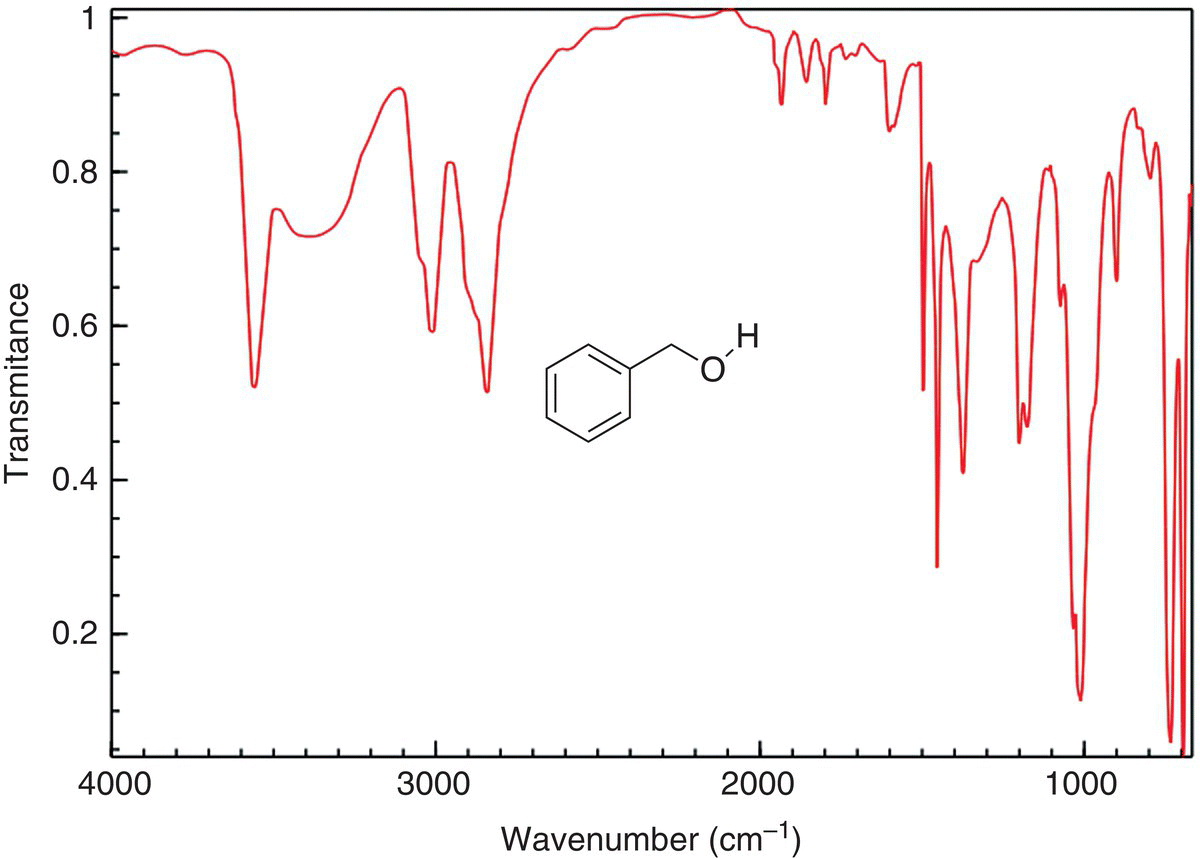
Figure 13.13 IR spectrum of benzyl alcohol, showing the O—H frequency. Note that there is no frequency in the region of 1710 cm−1 since this molecule does not have a carbonyl group.
Source: with permission from NIST.
Problem 13.2
An unknown compound is acyclic and has a molecular formula of C5H10O and a prominent frequency in the IR spectrum occurs around 1710 cm−1. Give a likely structure of this unknown compound.