Organic Chemistry: Concepts and Applications - Headley Allan D. 2020
Spectroscopy Revisited, A More Detailed Examination
13.6 Nuclear Magnetic Resonance (NMR) Spectroscopy
NMR spectroscopy is one of the most important types of spectroscopy that is used to assist in the determination of the structure of organic compounds. This technique is nondestructive to the compound and gives very detailed information about the structure of an unknown compound. In order to determine the complete structure of an unknown, a combination of the various types of spectroscopy is typically used. For NMR spectroscopy, the connectivity of the different atoms in a molecule can be determined; these atoms include H, C, N, F, and P. The most commonly used type in NMR spectroscopy is the 1H or proton, hence known as proton NMR spectroscopy, or just simply 1H NMR. Another type of NMR spectroscopy that is commonly used to examine the structure of compounds is 13C NMR spectroscopy. In this section, both 1H NMR and 13C NMR spectroscopies will be covered.
13.6.1 Theory of Nuclear Magnetic Resonance Spectroscopy
A nucleus with an odd number of electrons (odd atomic number) has a nuclear spin that can be observed in the NMR spectrometer. As mentioned earlier, the most popular ones are the following: H, C, N, F, and P. The simplest nucleus of course is the hydrogen (the proton) NMR. A hydrogen atom with one electron can be visualized as a rotating sphere of positive charge. This rotation generates a magnetic field (magnetic moment), which looks like a small bar magnet (with two poles) as illustrated in Figure 13.18.
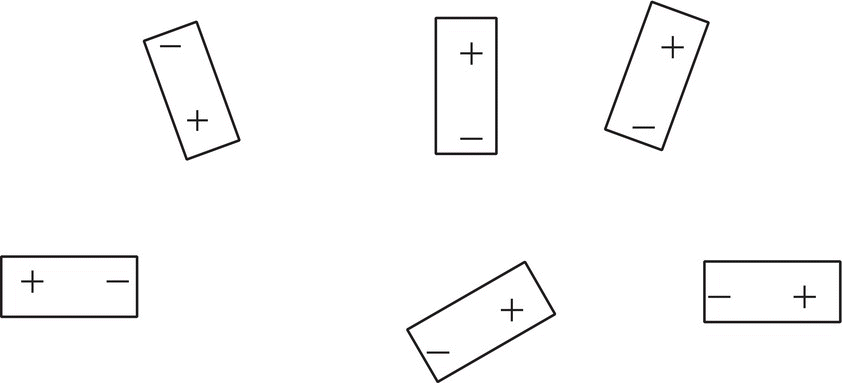
Figure 13.18 Representation of spinning protons, which give rise to tiny magnetic bar-like magnets.
Notice that these tiny bar representations of the protons have random orientations. When these small bar magnets (the protons) are the presence of an external magnet (H0), they are aligned with the external magnetic field as illustrated in Figure 13.19.
There are two possible modes of alignments (orientations) of the tiny magnetic bars with the external magnetic field, H0, as shown in Figure 13.20.
There is one orientation, in which the magnets are aligned and it is the more favored orientation. Hence it is lower in energy, compared to the other orientation, which is higher in energy. A specific amount of energy is required for the transition from the more favored lower energy alignment to the excited state for each proton (here represented by tiny bar magnets). The energy required for this transition is in the radio frequency range of the electromagnetic spectrum. This concept is illustrated in Figure 13.21.
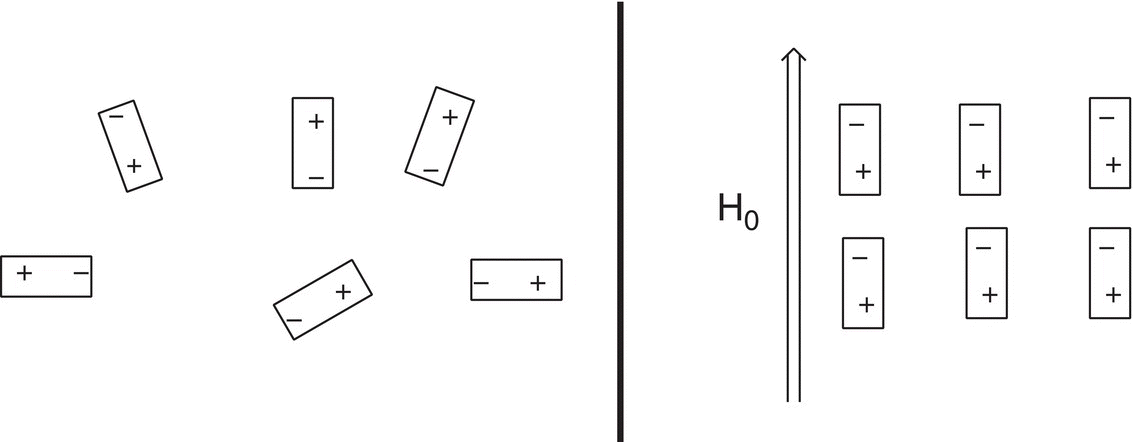
Figure 13.19 Nonaligned nuclear spins in the absence of an external magnetic field (left) and aligned nuclear spins in the presence of an external magnetic field, H0.
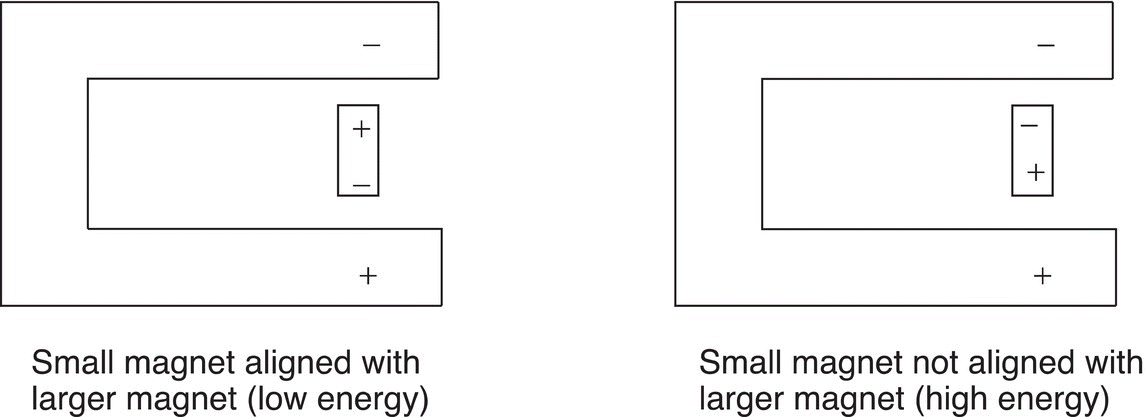
Figure 13.20 Representation of two possible orientations of a small bar magnet in the presence of a larger external magnet field.
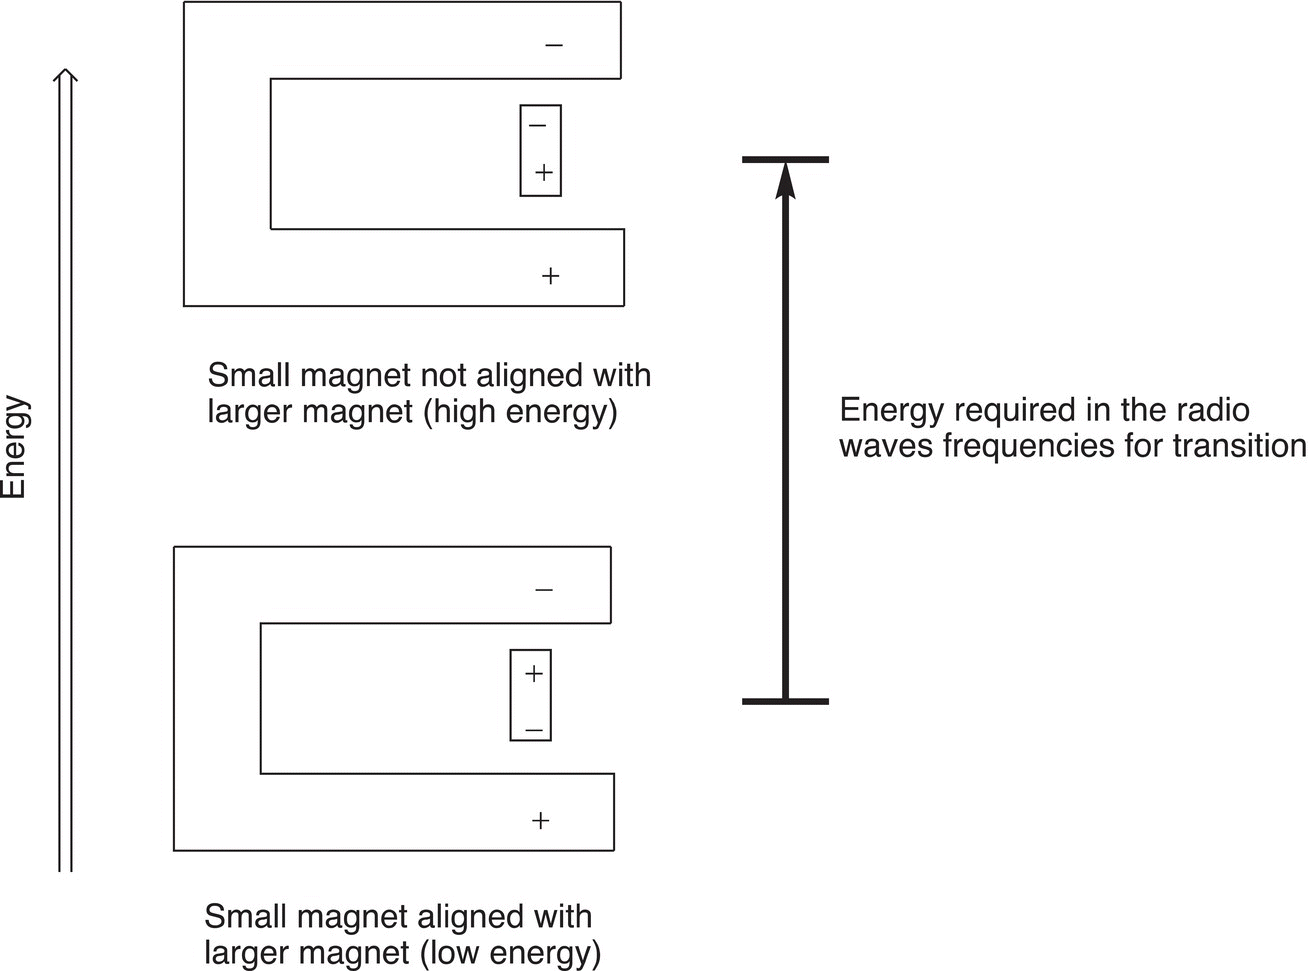
Figure 13.21 Illustration of energy requirement for transition of various orientations of protons (represented as tiny bar magnets) in the presence of a larger magnetic field.
13.6.2 The NMR Spectrometer
The major component of an NMR instrument is a very strong magnet; also required is a radio frequency transmitter, a method to detect signals, and a recorder (printer). The schematics of the NMR instrument are shown in Figure 13.22.
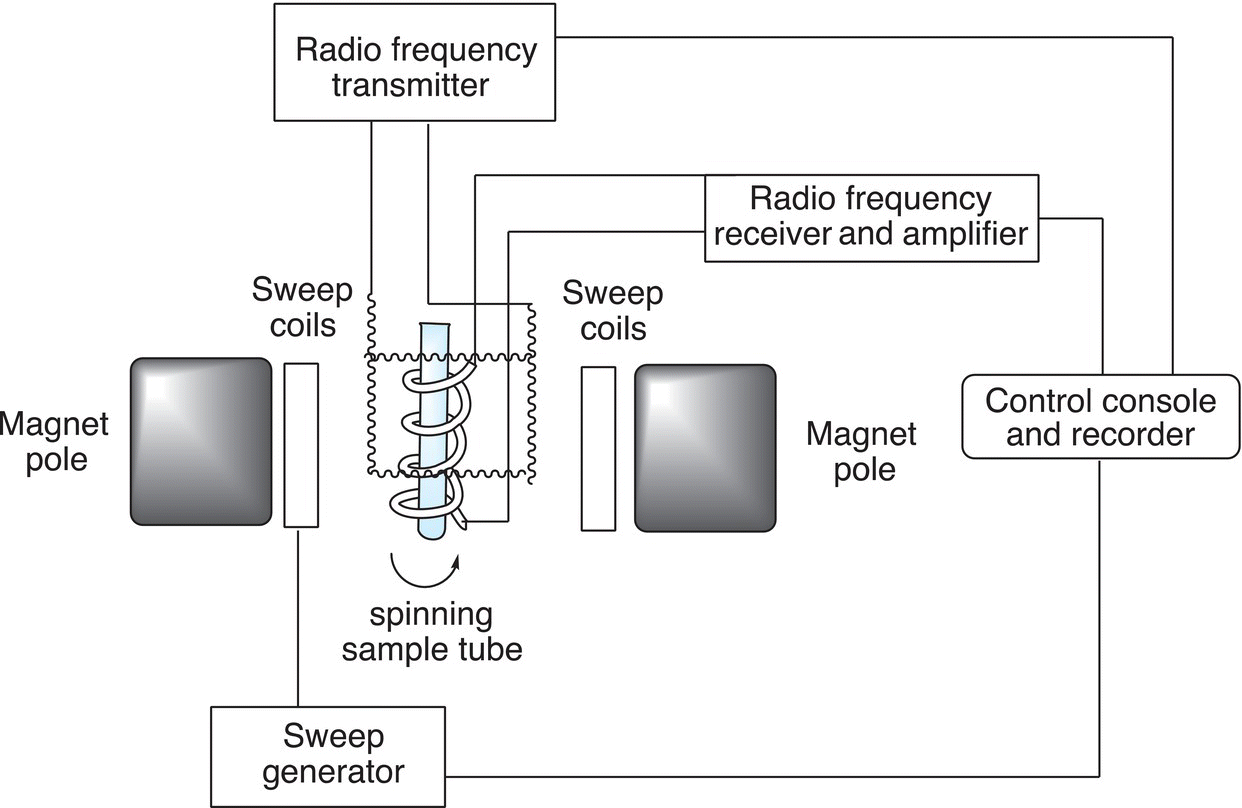
Figure 13.22 Schematics of the nuclear magnetic resonance (NMR) spectrometer.
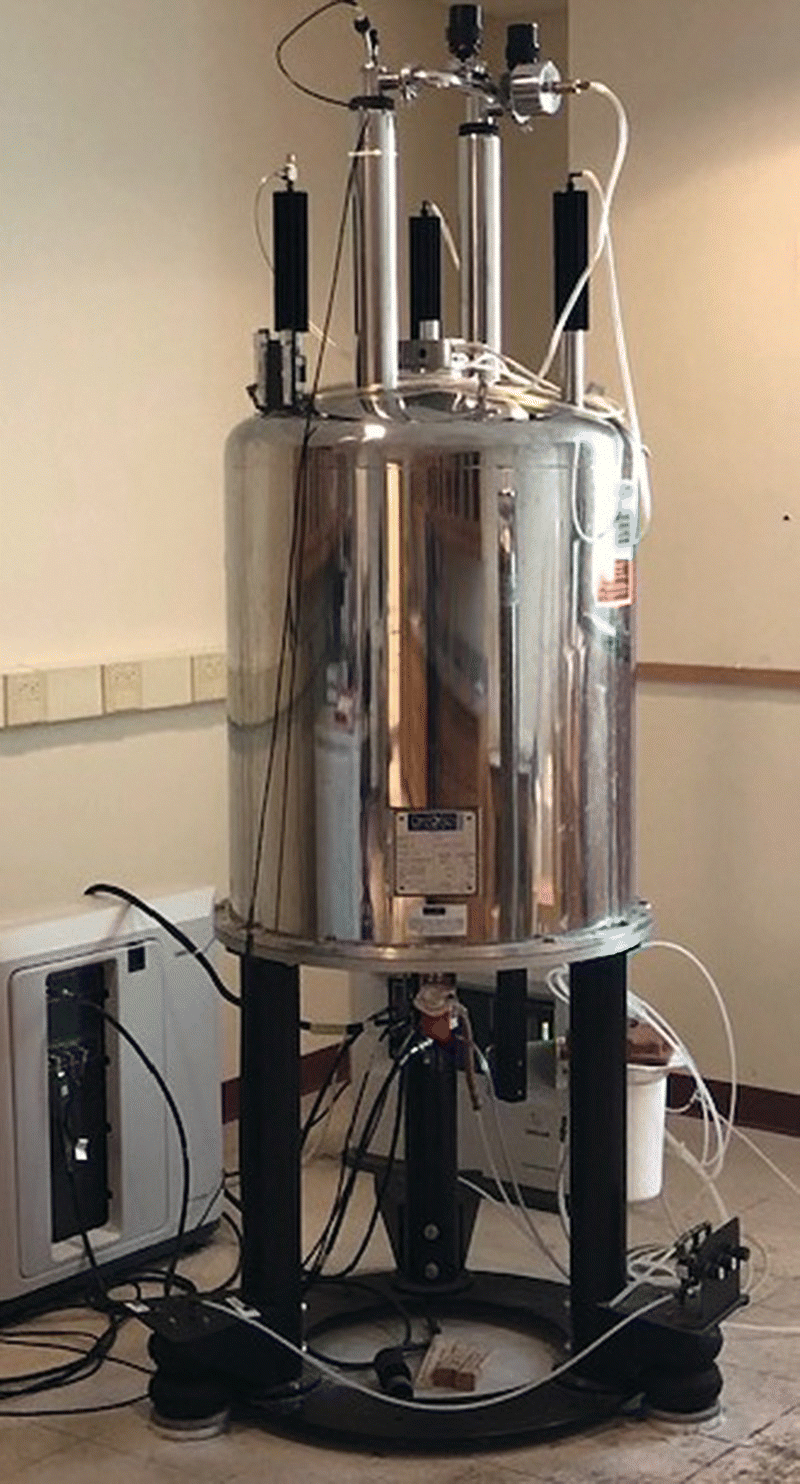
Figure 13.23 300 MHz nuclear magnetic resonance (NMR) instrument.
The sample is inserted within the field of a very strong magnet, typically an electromagnetic, which uses a combination of liquid helium and liquid nitrogen to keep it cool. Once the sample is in the magnetic field, energy is supplied to the sample in the form of radio frequency. The range of radio frequency is typically scanned and signals are detected based on the environment of the different protons. A picture of an NMR instrument is shown in Figure 13.23.
13.6.3 Magnetic Shielding
Imagine that each bar magnet is a proton on an organic molecule that has a number of other atoms and that this molecule is placed in the presence of an external magnet, H0. The surrounding atoms of that proton, which also have electrons, will produce small electric fields, which will shield the proton on the molecule from the external field. As a result, the proton under consideration is considered to be more shielded from the effect of the external field, H0. The opposite possibility also exists where the surrounding environment of a proton is less shielded from the effect of the external magnet. Protons that are more shielded are excited at smaller frequencies, compared to protons that are less shielded, which are excited at larger frequencies. Remember that the larger the frequency, the greater the energy. Methanol, which has two different sets of protons, is shown in Figure 13.24.
DID YOU KNOW?
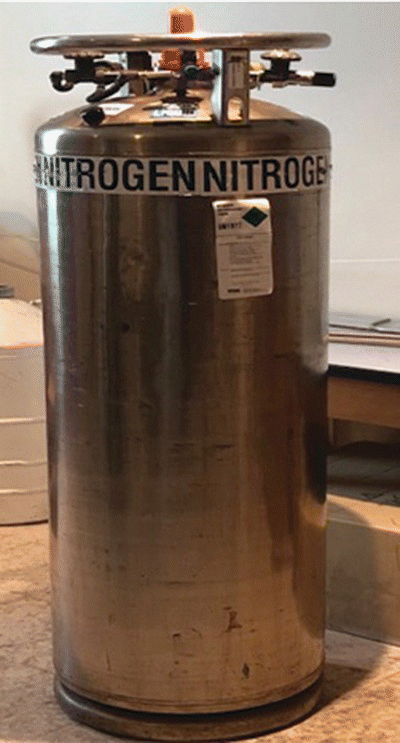
The very powerful electromagnet required for NMR spectroscopy has to be kept extremely cold. This is accomplished by using liquid nitrogen, which has a temperature of −196 °C. Liquid nitrogen is stored and transported under pressure. In order to achieve an even lower temperature, liquid helium, which is extremely expensive, but is colder than liquid nitrogen is also used to keep the magnet cool, its temperature is −270 °C. For efficiency, the liquid helium keeps the magnet cool, and the liquid nitrogen keeps the liquid helium from evaporating too fast.
Since the environments of each proton on a molecule are different, it is possible for NMR spectroscopy to detect different types of hydrogens in a molecule based on the specific frequency or energy required for excitation in the presence of an external magnetic field. The question now becomes how to distinguish different hydrogens that are in different environments. For the molecule given in Figure 13.24, the three hydrogens of the methyl carbon of methanol are all in the same environment, and hence the energy required to excite these three hydrogens is the same. On the other hand, the hydrogen of the alcohol functionality is in a different environment, and hence the energy required to excite that proton is different from the energy required to excite the three methyl hydrogens. Thus, it is expected in the NMR spectrum that there should be two signals for methanol, one for the excitation of the three methyl hydrogens and another for the excitation of the hydrogen bonded to the oxygen.
13.6.4 The Chemical Shift, the Scale of the NMR Spectroscopy
As mentioned in the previous section, there are different environments that protons of organic molecules exist in and, as a result, require different energies for each transition. In order to standardize the energy requirements for the protons in the many different environments of an organic molecule, a specific compound is needed. That specific compound is tetramethylsaline (TMS), and the structure of TMS is shown below.
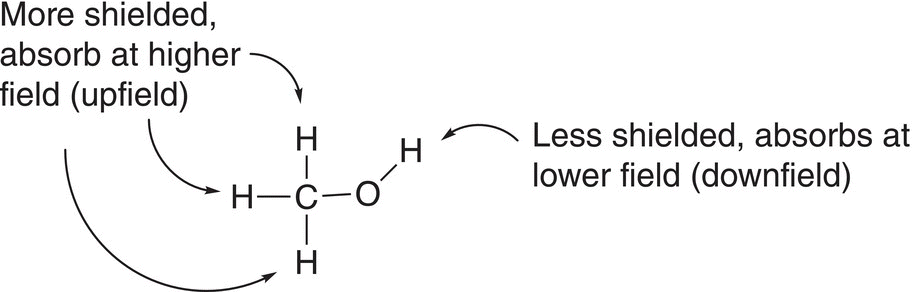
Figure 13.24 Methanol showing the different types of protons in different environments.
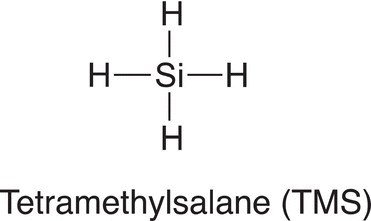
Note that all the protons are in the same environment (environmentally equivalent). and in the NMR instrument. These protons will appear as a single signal and are assigned a zero on a ppm scale. Using TMS as a reference signal, the NMR spectrum of methanol, which was discussed earlier in Figure 13.24, is shown in Figure 13.25. As pointed out earlier, methanol has two environmentally different types of protons, and hence the NMR spectrum should show two different signals, as shown in NMR the spectrum for methanol in Figure 13.25.
The different signals in a NMR spectrum are due to the different environments that protons exist in a molecule, such as methanol. The terms upfield and downfield are often used to describe the relative locations of signals in the NMR spectrum. A signal that is upfield is to the right of another signal that is downfield. Thus, the signal at 3.35 ppm is considered to be upfield to the signal that is at 4.80 ppm. Another way of stating the same observation is that the signal that is at 4.80 is downfield, relative to the signal at 3.35 ppm. There is a chemical shift table, which gives estimates of different types of hydrogens in molecules, based on the surrounding environments. These values and environments are shown in Table 13.3.
Thus, it is possible to use the values shown in this chemical shift table to approximate the environment of each proton on a molecule and assist in the determination of its structure.
13.6.5 Significance of Different Signals and Area Under Each Signal
In principle, each type of hydrogen will give a single signal in the NMR spectrum. For example, tert-butyl methyl ether will give only two different signals: one for the three protons of the methyl group and one for the nine protons of the tert-butyl group, as shown in Figure 13.26. As expected, these signals will have different chemical shifts, due to shielding.
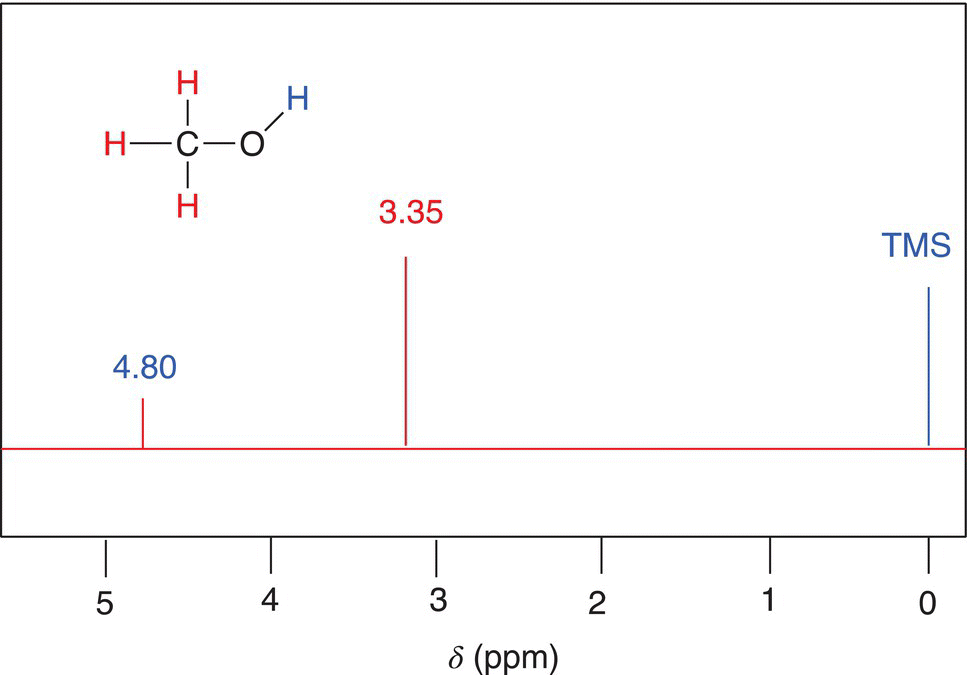
Figure 13.25 NMR spectrum of methanol, showing TMS as zero on the ppm or δ scale.
Table 13.3 Chemical shifts of different protons based on different environments.
Type of proton |
Type of compound |
Chemical shift range (ppm) |
R─CH3 |
1° aliphatic |
0.9 |
R2CH2 |
2° aliphatic |
1.3 |
R3 CH |
3° aliphatic |
1.5 |
|
Vinylic |
5.5—7.5 |
|
Acetylenic |
2—3 |
|
Aromatic |
6—8.5 |
|
Benzylic |
2.2—3 |
|
Allylic |
1.7 |
R─COOCH |
Ester |
3.3—4 |
HC─COOR |
Ester |
2—2.2 |
R─COH |
Aldehyde |
9—10 |
R─COCH |
Ketone |
2—2.7 |
R─COOH |
Carboxylic acid |
10—13.2 |
|
Phenolic |
4—12 |
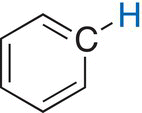
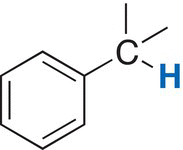
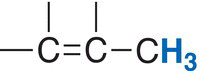
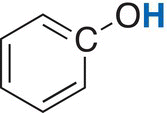
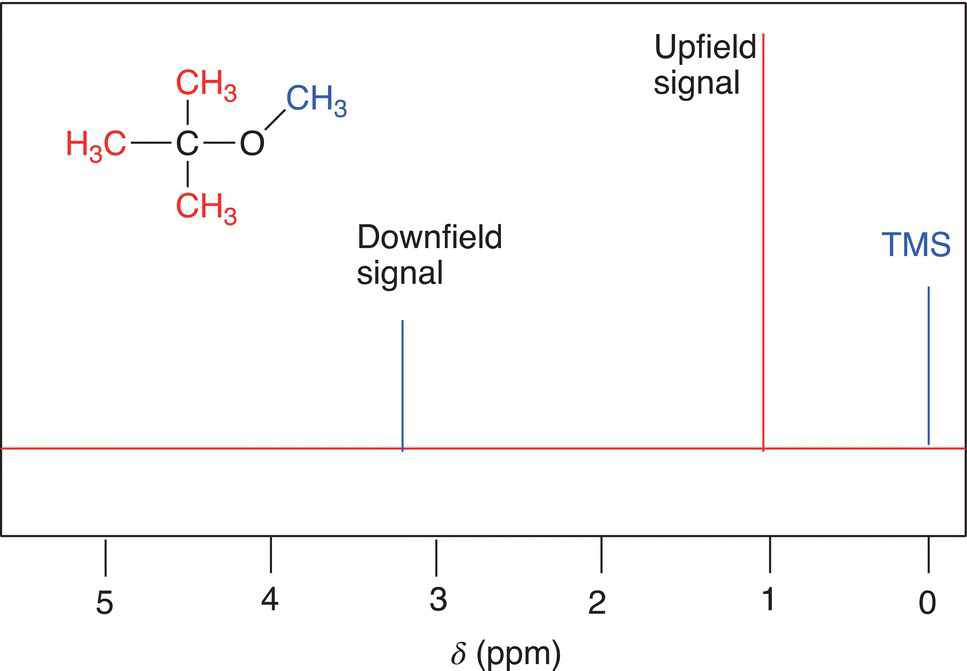
Figure 13.26 Proposed NMR spectrum of tert-butyl methyl ether.
The intensities for the signals shown in Figure 13.27 are not the same, one signal is larger than the other signal. The area under each signal corresponds to the number of protons that give rise to that signal. The instrument has an application, which integrates the relative areas under the peaks and the integrations may not necessarily correspond to exact number of hydrogens in a molecule. The actual NMR spectrum of tert-butyl methyl ether is shown in Figure 13.27.
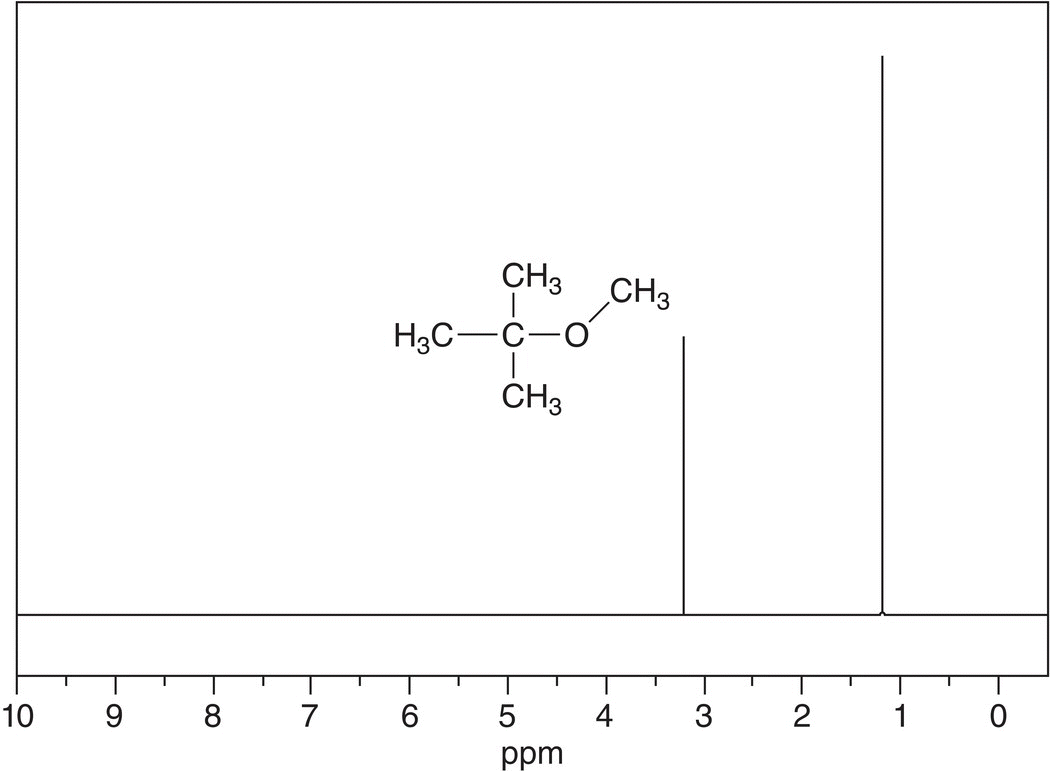
Figure 13.27 300 MHz 1H NMR spectrum of tert-butyl methyl ether in CDCl3 as solvent. Chemical shifts values are 3.212 ppm (downfield) and 1.189 ppm (upfield).
Source: with permission from AIST.
Note that the signal that is upfield (1.0 ppm) is three times larger than that of the signal at 3.1 ppm. The upfield signal has three times as many protons giving rise to that signal, compared to the signal downfield (3.1 ppm). One conclusion is that the signal upfield comes from nine hydrogens and the signal downfield comes from three hydrogens. This approach to determine the relative number of protons per signal in the use of NMR spectra to analyze the structures of molecules will be very important in trying to deduce the structure of unknown compounds.
13.6.6 Splitting of Signals
For two adjacent protons in a molecule that are in different environments, the signals for these two protons will not appear as two single signals, but as split signals. The splitting of the signals typically follows a N + 1 rule, where N is the number of protons on the adjacent carbon. Consider the molecule, 1,1,2-trichloroethane, which has three protons, two that are equivalent (or in the same environment) and they are labeled as Hb. The other proton is in a different environment, and it is labeled as Ha (structure shown below).
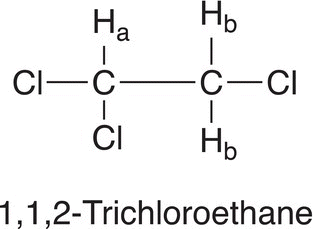
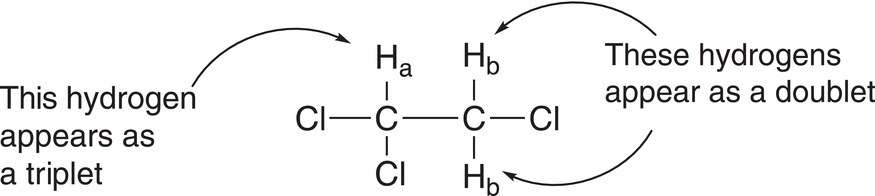
Since these two types of protons (Ha and Hb) are in different environments, it is expected that there should be two signals: a smaller signal downfield for Ha since that carbon is bonded to two electronegative chlorine atoms. The other signal, which has two protons (Hb), should be upfield to the signal for Ha. Since these two types of protons are adjacent to each other, they will not appear as two simple signals, but will appear as split signals. Since there are two hydrogens (Hb) on the carbon that has one chlorine atom, the signal on the adjacent carbon will follow the N + 1 rule and appear as a triplet (2 + 1 = 3). On the other hand, there is one hydrogen (Ha) on the carbon that has the two chlorine atoms, hence the signal of the proton on the adjacent carbon will appear as a doublet (1 + 1 = 2). For 1,1,2-trichloroethane, the splitting of signals is illustrated below.
Based on this information, the splitting pattern is illustrated in the proposed NMR spectrum shown in Figure 13.28.
Shown in Figure 13.29 is an actual NMR spectrum for 1,1,2-trichloroethane.
Let us look at the different isomers of butanol to better understanding splitting patterns observed in 1H NMR spectra. The first spectrum to be examined is tert-butanol (2-methyl-2-propanol) along with the signal assignments, which are shown in Figure 13.30.
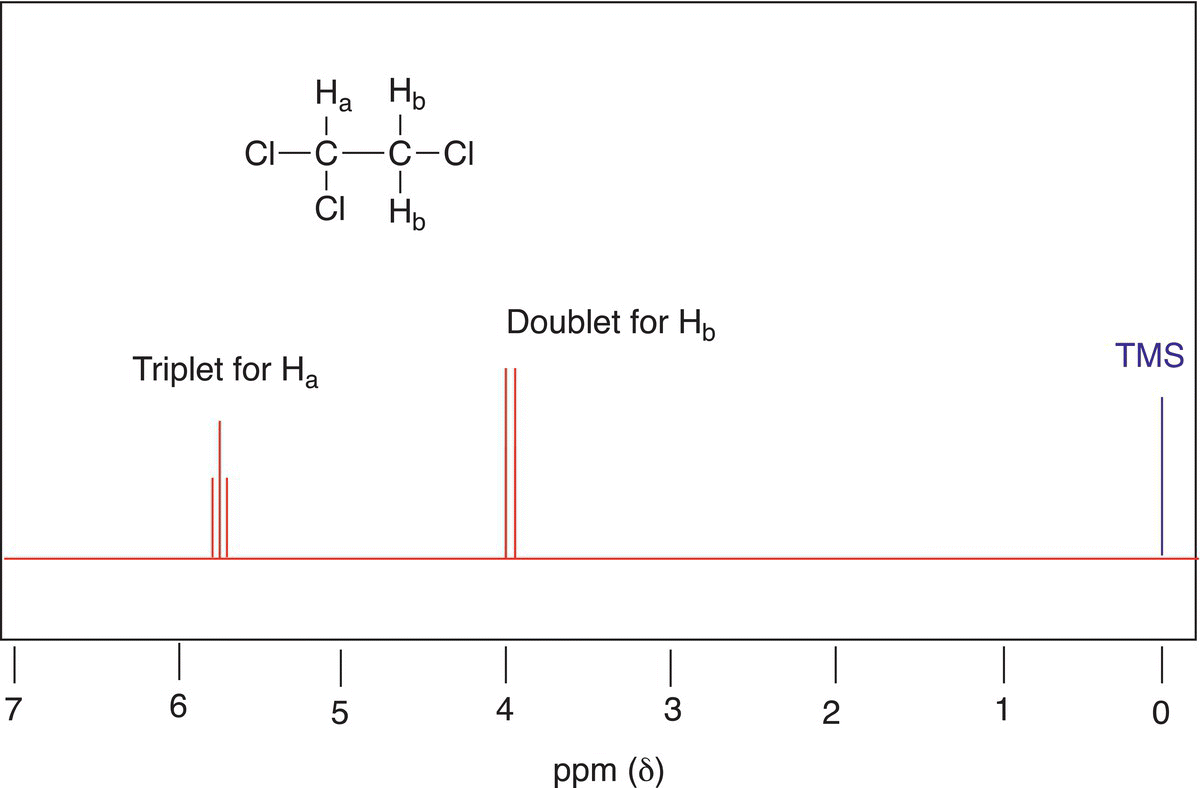
Figure 13.28 Proposed NMR spectrum for 1,1,2-trichloroethane showing the different splitting pattern of the signals.
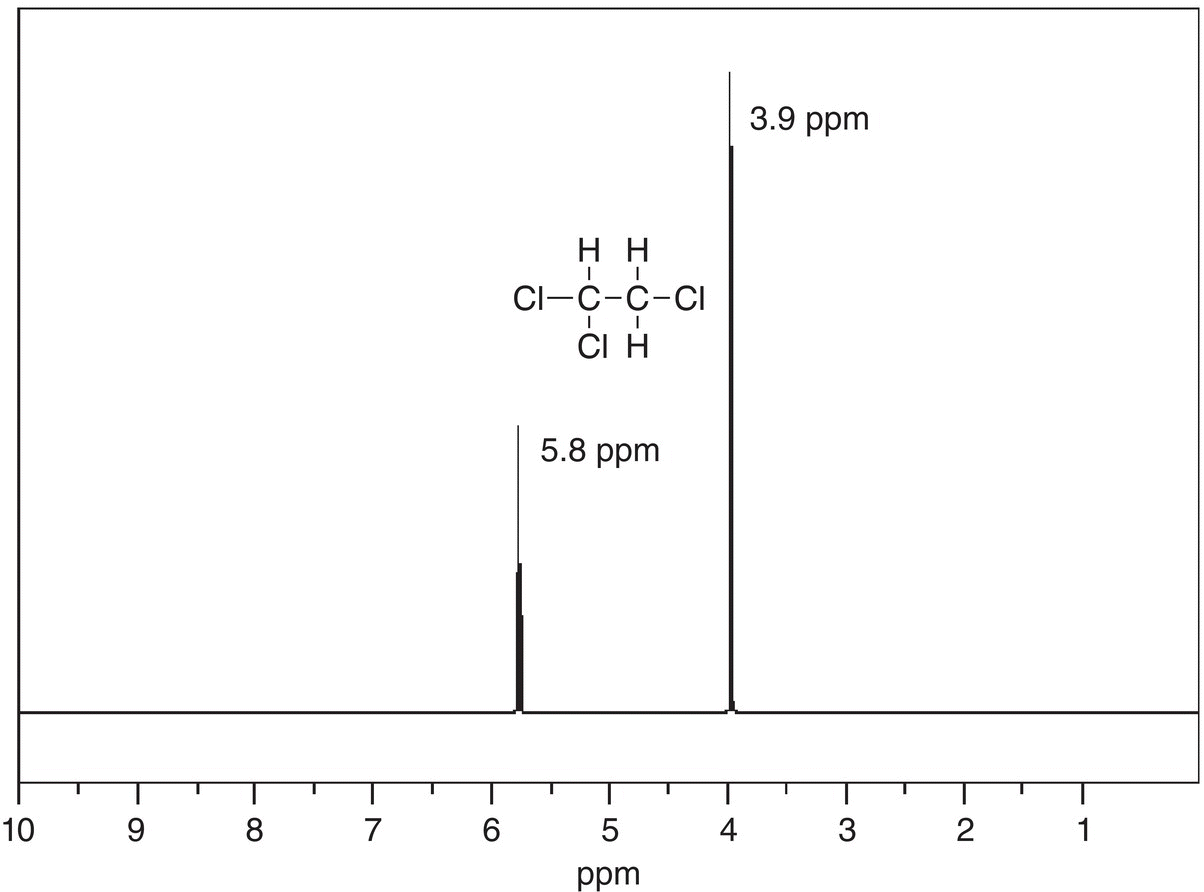
Figure 13.29 Actual 300 MHz 1H NMR spectrum for 1,1,2-trichloroethane showing the different signals.
Source: with permission from AIST.
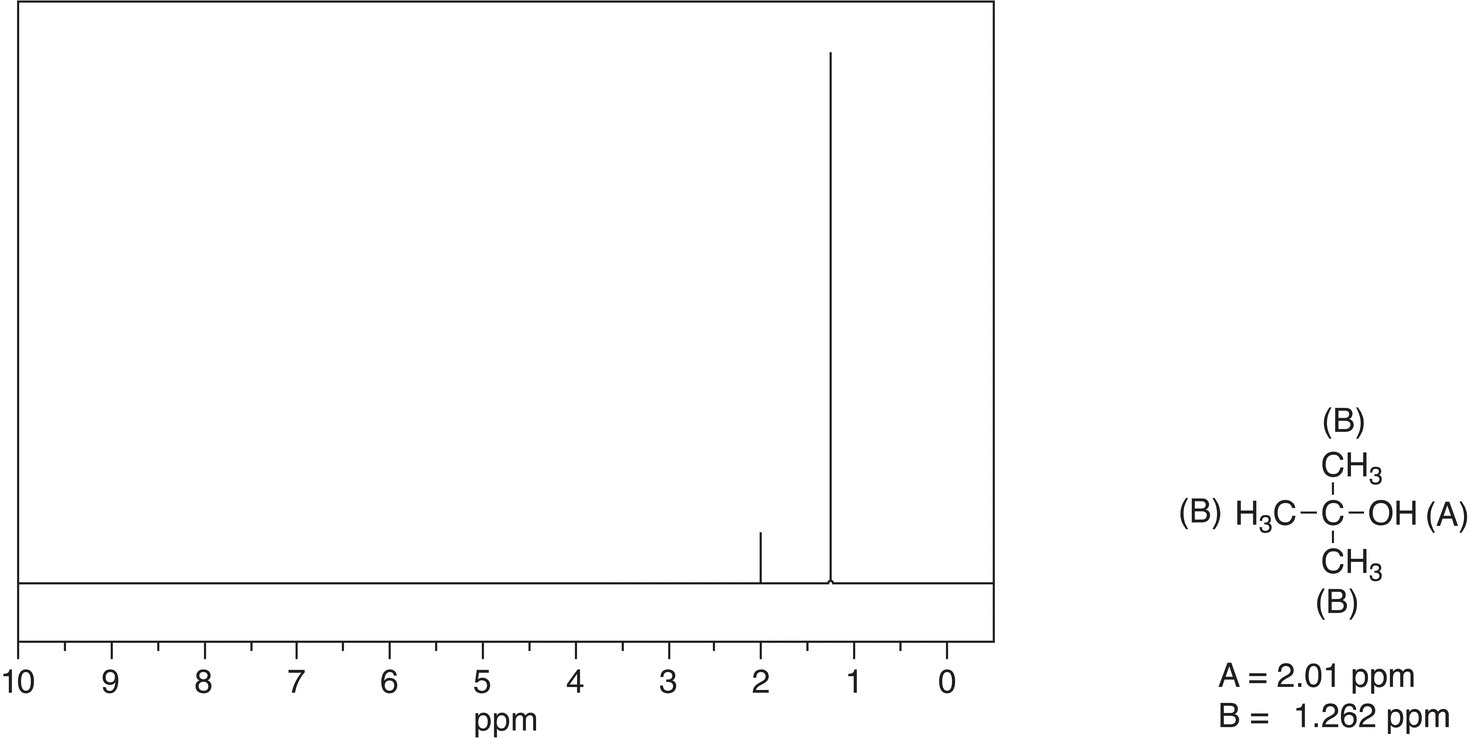
Figure 13.30 300 MHz 1H NMR spectrum for 2-methyl-2-propanol in CDCl3.
Source: with permission from AIST.
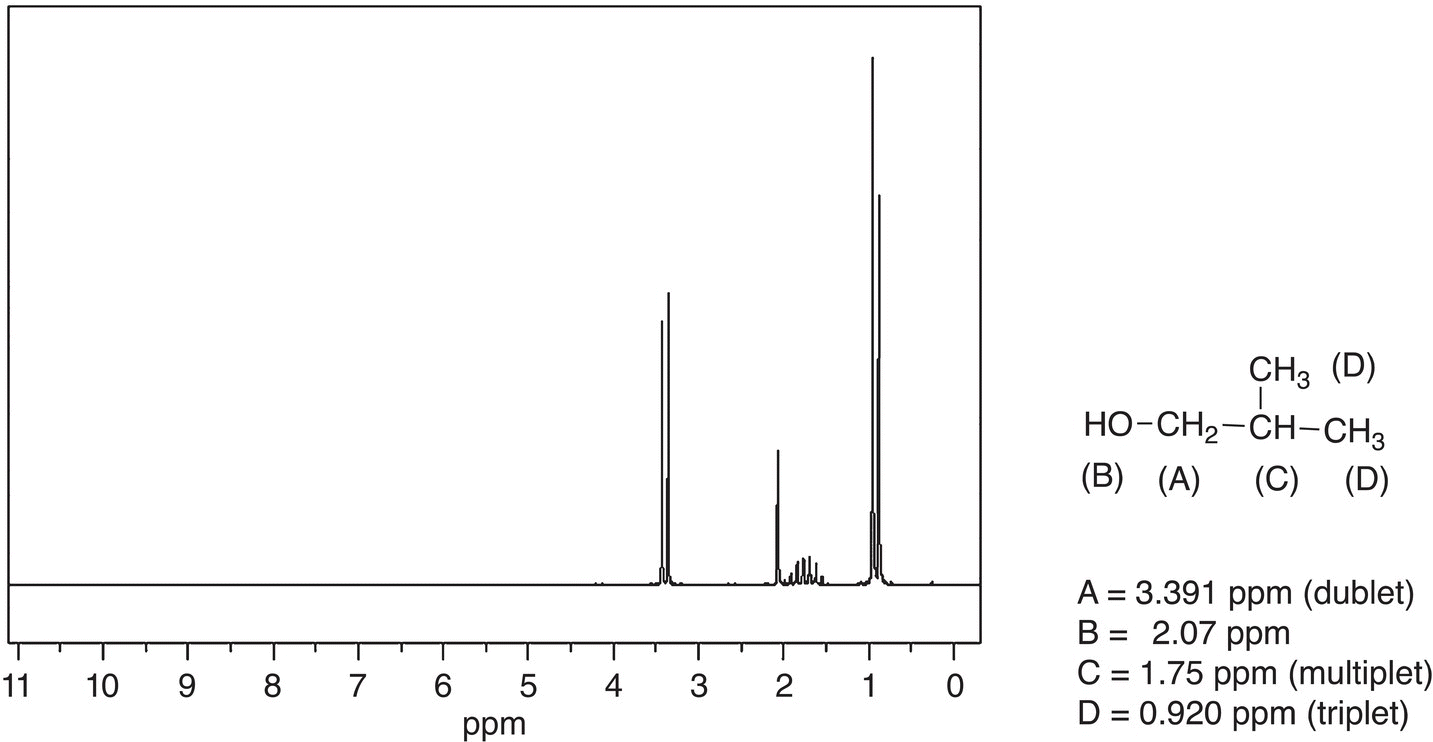
Figure 13.31 300 MHz 1H NMR spectrum for 2-methyl-1-propanol in CDCl3.
Source: with permission from AIST.
This spectrum is not surprising since all nine hydrogens of the tert-butyl group are in the same environment and the O—H proton is in a different environment; note that the OH signal is downfield since the hydrogen is bonded to an electronegative oxygen.
Shown in Figure 13.31 is the NMR spectrum of 2-methyl-1-propanol along with the NMR assignments.
Note that this spectrum is a bit more complex, compared to that given in Figure 13.30 for tert-butanol. For 2-methyl-1-propanol, the two methyl groups (labeled as D) are equivalent and appear as one signal upfield at 0.920 ppm. Since these protons are both bonded to an adjacent carbon that has one hydrogen, that signal appears as a doublet based on the formula given earlier. Note that the proton labeled as (C) appears as a multiplet since the adjacent carbons have a total of 8 hydrogens. The hydrogens labeled as (A) appear as a doublet since it is bonded to an adjacent carbon that has two hydrogens. Typically, hydrogens on adjacent heteroatoms do not split the signal of protons that are bonded to carbons. As a result, the hydrogens labeled as (A) appear as a doublet and not a multiplet. Also, these hydrogens are the furthest downfield since the carbon is bonded to the electronegative OH group. The hydrogen bonded to the OH group appears as a singlet at 2.07 ppm.
The next spectrum to be examined is that for 2-butanol and it is given in Figure 13.32. Note that this spectrum is even a bit more complex than that of tert-butanol or 2-methyl-1-propanol. The signal that stands out is the multiplet at 3.79 ppm for the proton labeled (B). For this proton, there are three hydrogens on the adjacent carbon to the right and two hydrogens on the adjacent carbon to the left. This hydrogen is bonded to a carbon that is bonded to an electronegative OH group. As a result, this signal is the most downfield signal, and it appears as a multiplet owing to the number hydrogens on the adjacent carbons. The hydroxyl proton (E) is also downfield since it is bonded to an electronegative oxygen. The other signals are all upfield and in the same approximate region, but you may be able to recognize a triplet upfield at 0.93 ppm, which represents the hydrogens labeled as (D), and they appear as a triplet since they are bonded to an adjacent carbon that has two hydrogens.
The last isomer of butanol to be examined is that of 1-butanol, and the spectrum is shown in Figure 13.33, along with the NMR assignments. For the spectrum of 1-butanol, the signal at 3.626 ppm is easily recognized since it is downfield and is a triplet. This signal is downfield since it is bonded to a carbon that is bonded to the electronegative OH group. This signal is a triplet and belongs to the hydrogens labeled (A) since they are bonded to an adjacent carbon that has two hydrogens. Another recognizable signal is the most upfield signal, which is a triplet and belong to protons labeled (E). This signal appears as a triplet since the hydrogens are bonded to an adjacent carbon that has two hydrogens. It is expected that the signal for the protons labeled as (D) should appear as a multiplet, likewise the protons labeled as (C). The multiplet in the region of 1.53—1.39 ppm reflects these protons.
Even though it is possible to determine the structures of the isomers of butanol as discussed in the previous paragraph, if these compounds were unknown compounds, the presence of the OH functional group could have been determined from IR spectroscopy and the molecule weight from mass spectrometry.
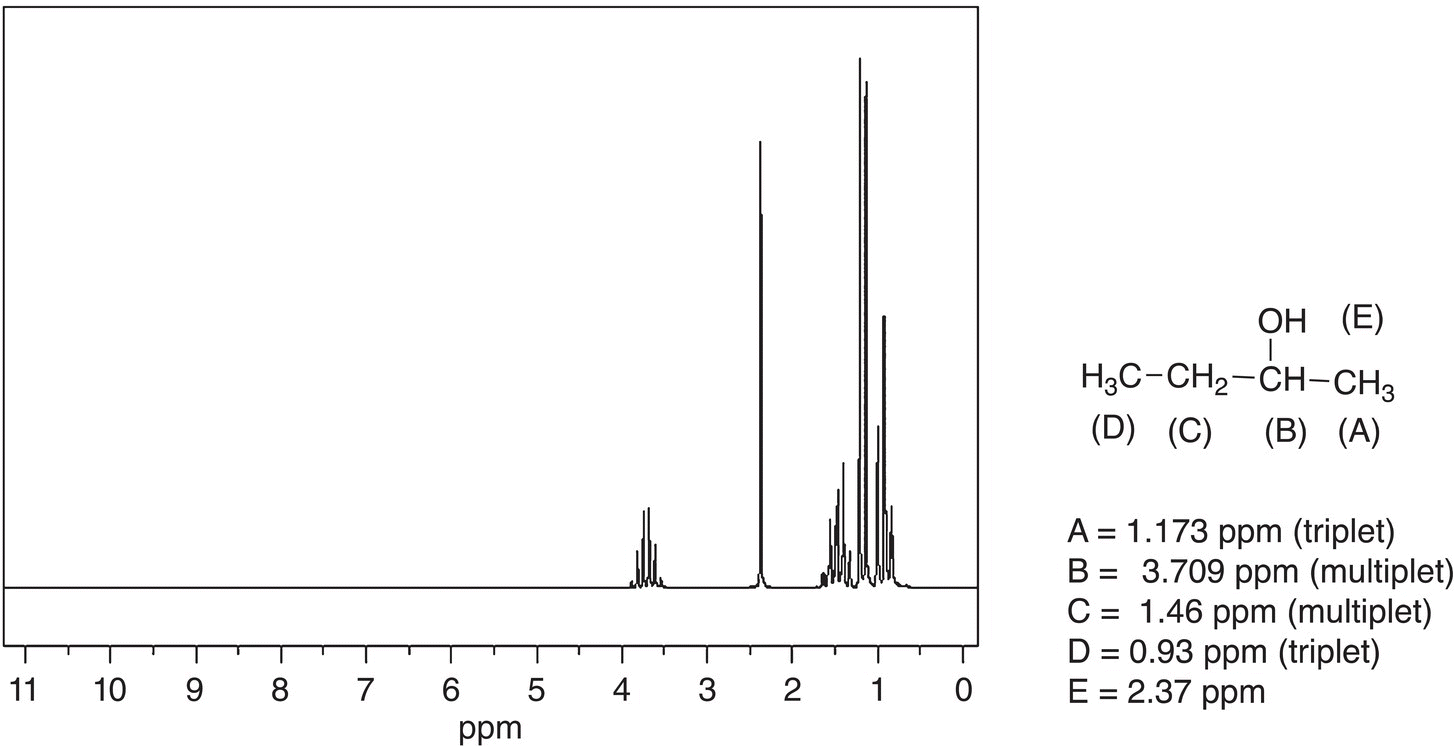
Figure 13.32 300 MHz 1H NMR spectrum for 2-butanol in CDCl3.
Source: with permission from AIST.
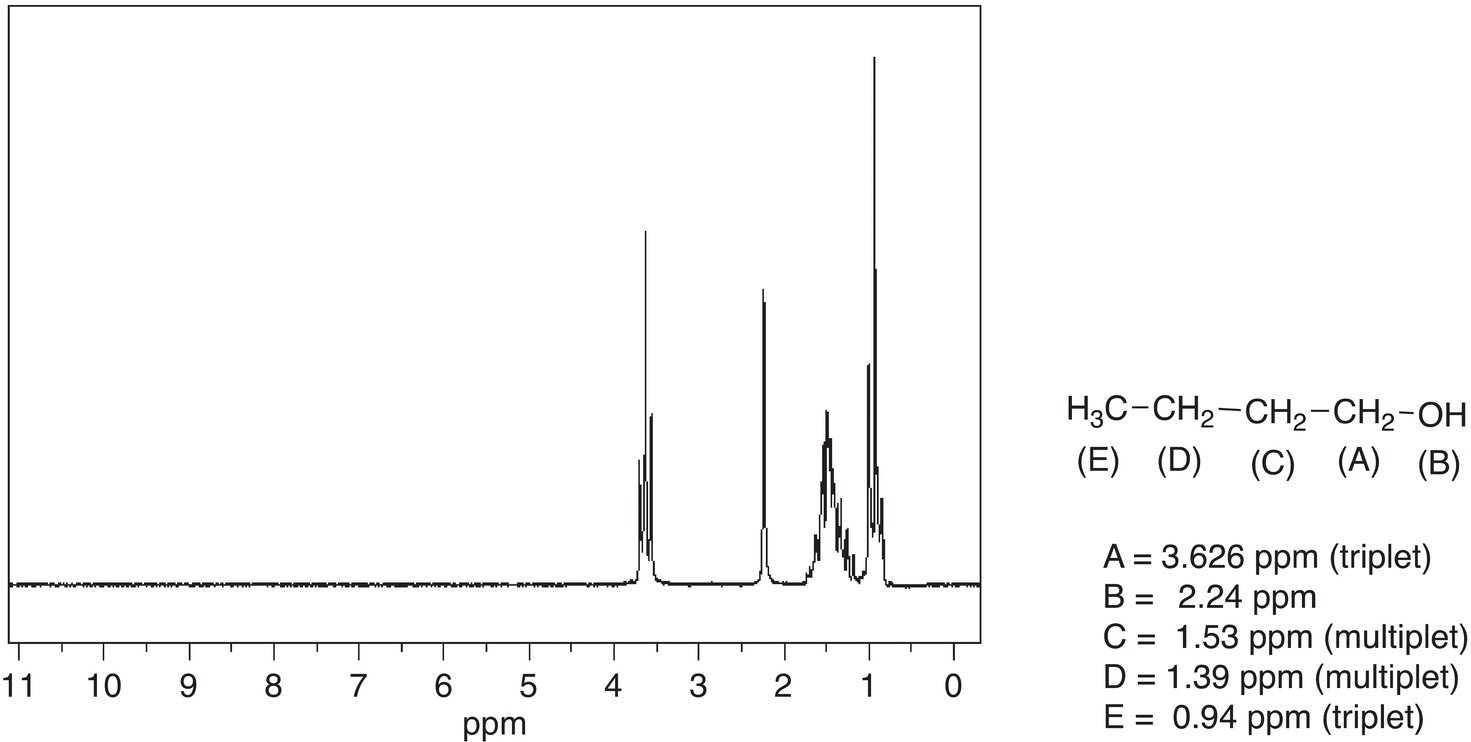
Figure 13.33 300 MHz 1H NMR spectrum for 1-butanol in CDCl3.
Source: with permission from AIST.
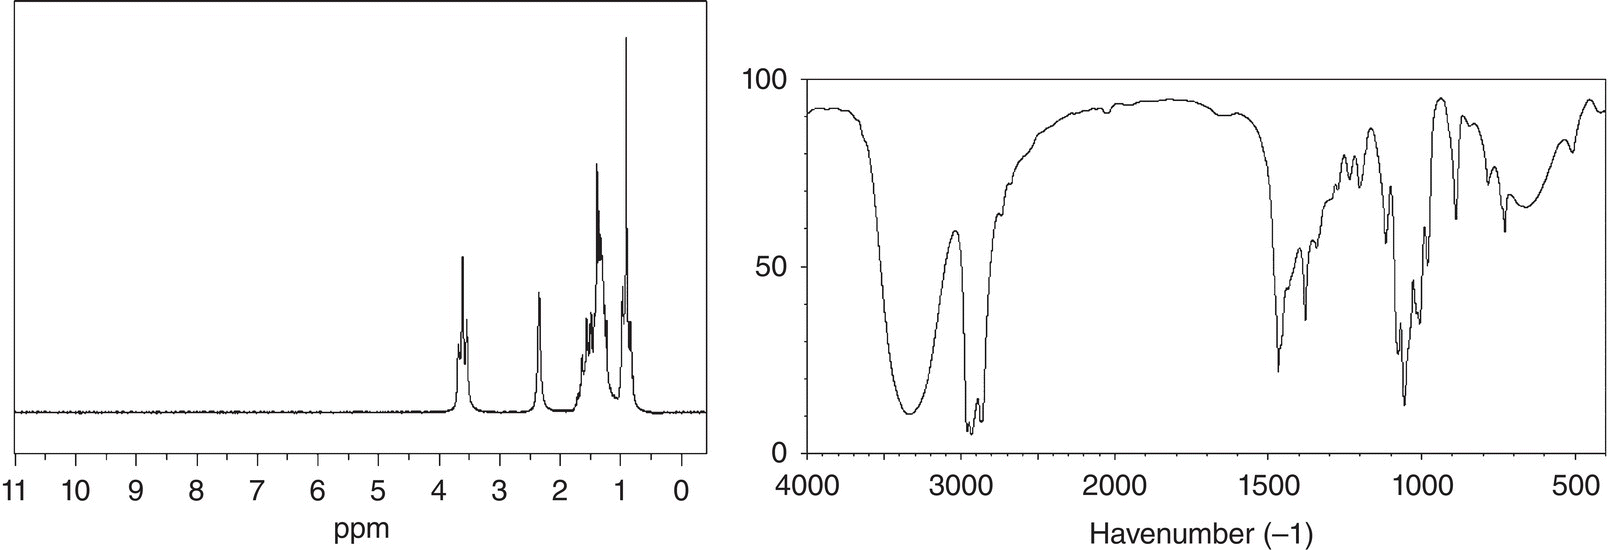
Problem 13.4
An unknown compound showed a molecular weight ion peak at 88.1 m/z. The 1H NMR and IR spectra are given below. Give a likely structure of this unknown compound.
A large number of organic compounds contain the benzene ring in their structures, so it becomes important to be able to recognize this functionality in molecules. The spectrum for benzene is shown in Figure 13.34.
Note that since all hydrogens of benzene are equivalent, there is only one signal that appears at 7.339 ppm. For substituted benzene, however, the hydrogens of the benzene ring are no longer equivalent. The 1H NMR spectrum of nitrobenzene is shown in Figure 13.35.
Note that since all hydrogens of the benzene ring of nitrobenzene are not equivalent, hence there are different signals with different chemical shifts. The protons labeled Ha are equivalent since the molecule is symmetrical. Note also that this signal is furthest downfield since these hydrogens are closest to the electronegative —NO2 group. This signal appears as a doublet since the adjacent carbon has one hydrogen. The protons labeled Hb are equivalent due to the symmetry in the molecule and they appear as a multiplet since the adjacent carbons have one hydrogen each. The proton Hc appears as a multiplet for the same reason of having adjacent carbons with one hydrogen on each carbon.
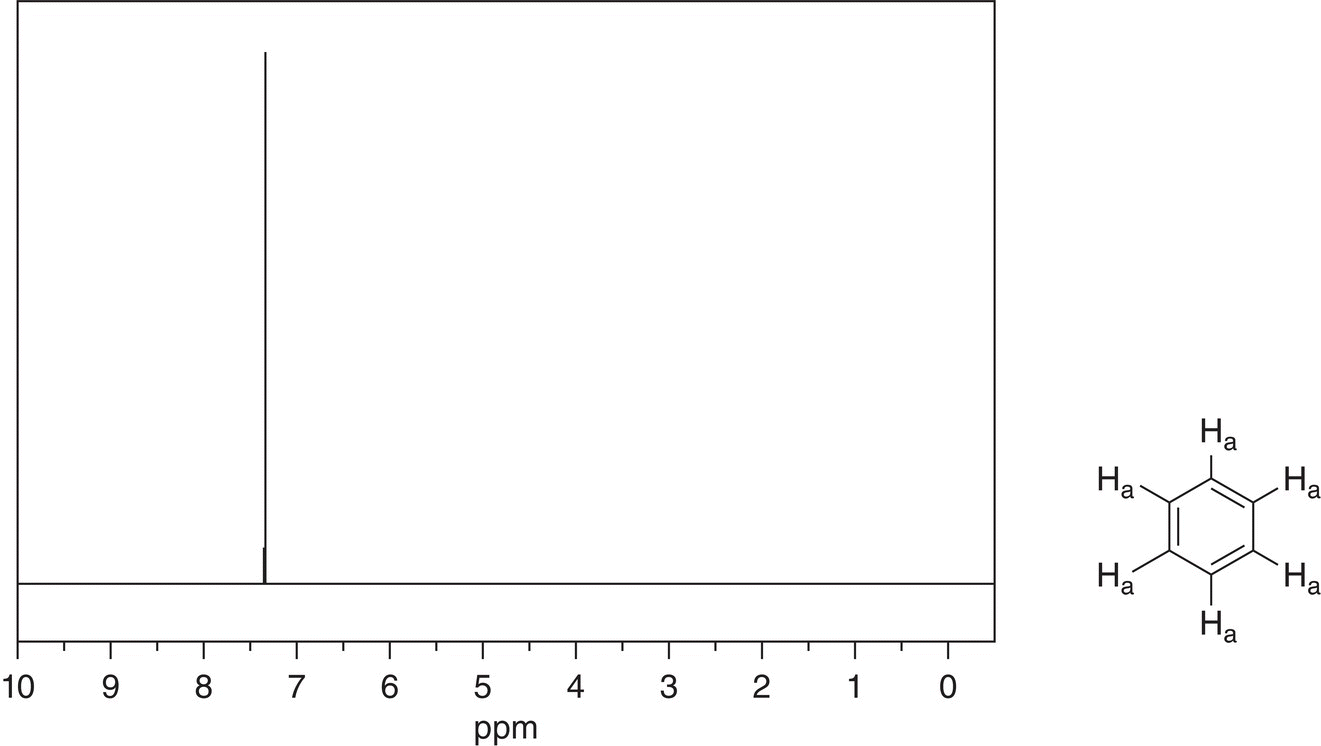
Figure 13.34 300 MHz 1H NMR spectrum of benzene in CDCl3.
Source: with permission from AIST.
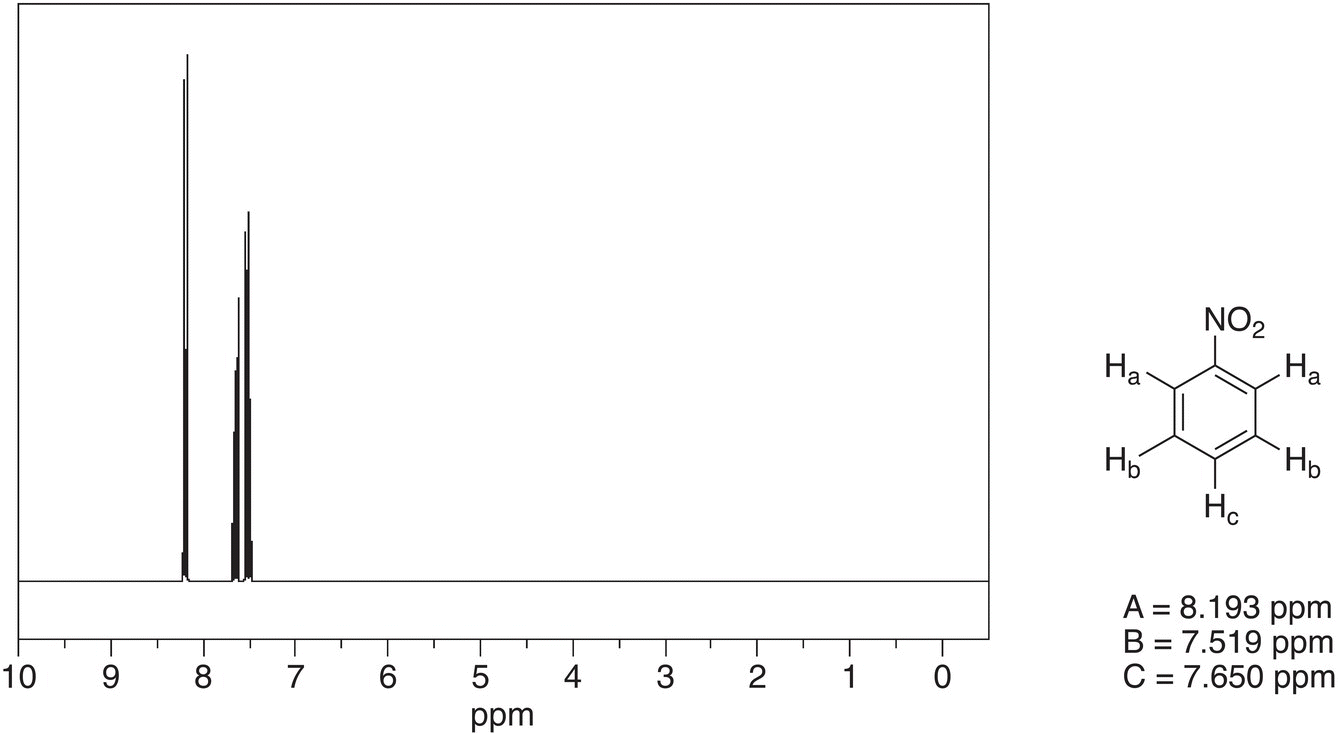
Figure 13.35 300 MHz 1H NMR spectrum of nitrobenzene in CDCl3.
Source: with permission from AIST.
The 1H NMR spectrum for 1,4-dinotrobenzene is given in Figure 13.36. Note that all four of the hydrogens of 1,4-dinotrobenzene are equivalent, and as result, they appear as a single signal. Owing to the electronegative nitro groups on the benzene ring of 1,4-dinitrobenzene, the chemical shift of this single signal is further downfield, compared to that of benzene; 8.49 ppm for 1,4-dinitrobenzene, compared to 7.339 ppm for benzene.
The 1H NMR spectrum of 1,2-dinitrobenzene, however, is different from 1,4-dinitrobenzene as shown in Figure 13.37.
For this molecule, there are two different types of hydrogens as shown in Figure 13.37. As a result, there are two signals. Since Ha protons are closer to the electronegative nitro group and that signal is downfield, compared to the signal for the protons of Hb, which are further from the electronegative nitro groups.
The spectrum of 1,3-dinitrobenzene is shown in Figure 13.38. Note that the signal for Ha is furthest downfield and appears as a singlet since there are no hydrogens on the adjacent carbons and it is next to two nitro groups. The protons shown as Hb are equivalent and appear as one signal but shows as a doublet since they are adjacent to a carbon that has one proton, Hc. Hc appears as a multiplet, also known as doublet of doublet, since it is next to carbons that have one hydrogen each.
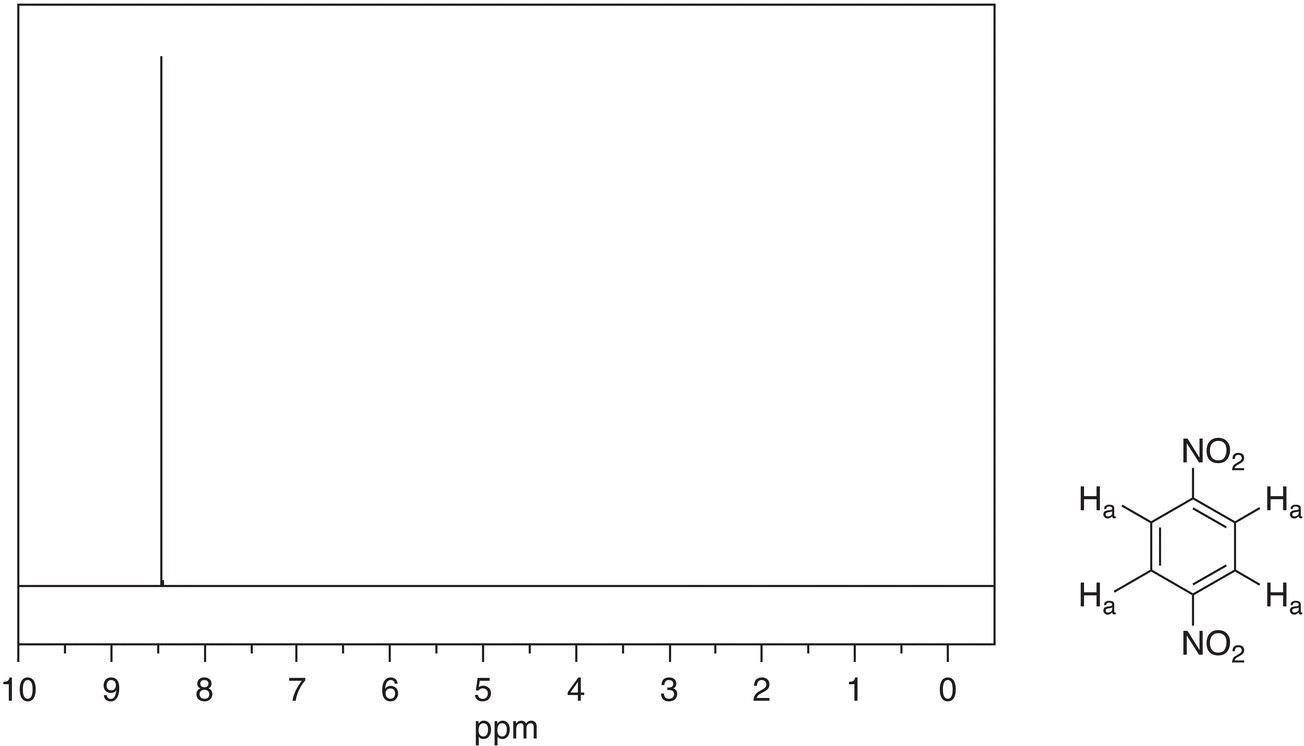
Figure 13.36 300 MHz 1H NMR spectrum of 1,4-dinitrobenzene in CDCl3.
Source: with permission from AIST.
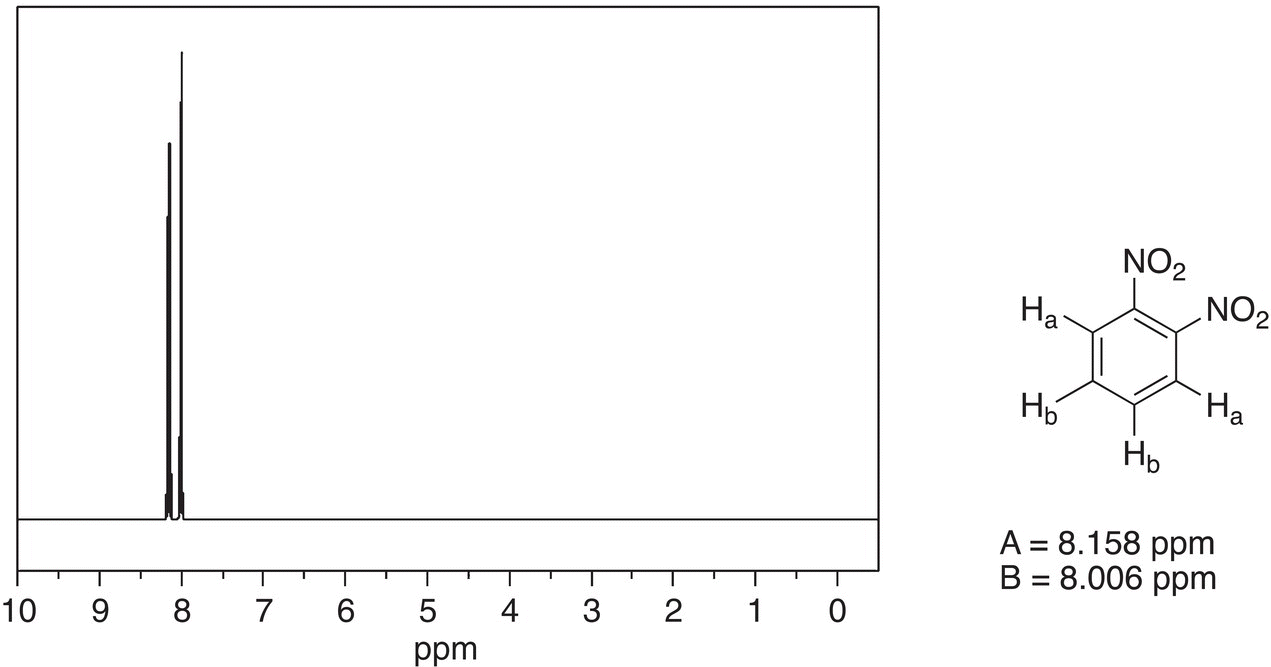
Figure 13.37 300 MHz 1H NMR spectrum of 1,2-dinitrobenzene in acetone.
Source: with permission from AIST.
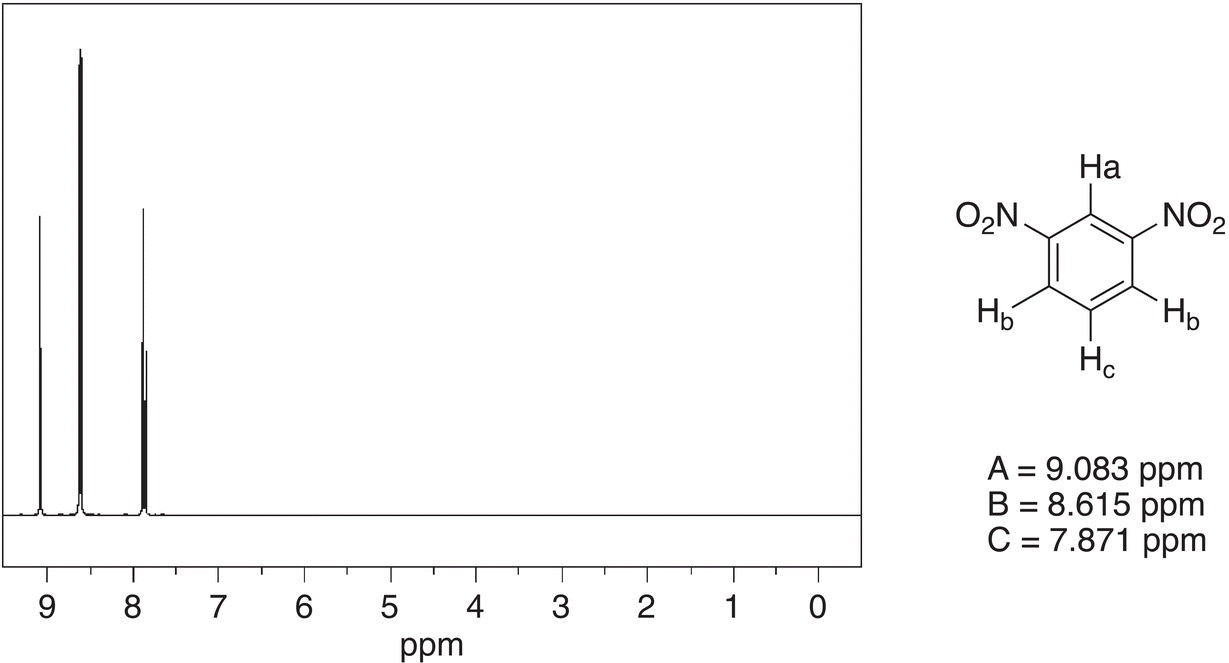
Figure 13.38 300 MHz 1H NMR spectrum of 1,3-dinitrobenzene in acetone.
Source: with permission from AIST.
With this information about substituted benzenes, you should be able to identify molecules that have the benzene ring in the structures. In addition, you should be able to identify the type substitution on the ring; that is, ortho, meta, or para substitution. Let us now examine a more complex molecule. The 1H NMR of ethyl benzoate is shown in Figure 13.39, along with the assignments.
The aromatic protons are readily noticeable, being downfield and around 7 ppm. Also note the splitting pattern, which is similar to that of nitrobenzene, which is monosubstituted. The next observation is the splitting pattern of the other two signals at 4.36 and 1.38 ppm. They are quartet and triplet, respectively. This splitting pattern suggests a CH2 next to a CH3 group. Note also that the downfield signal would indicate that it is adjacent to an electronegative atom and from the table, the best match is next to an oxygen.
The spectrum for phenyl propionate is given in Figure 13.40.
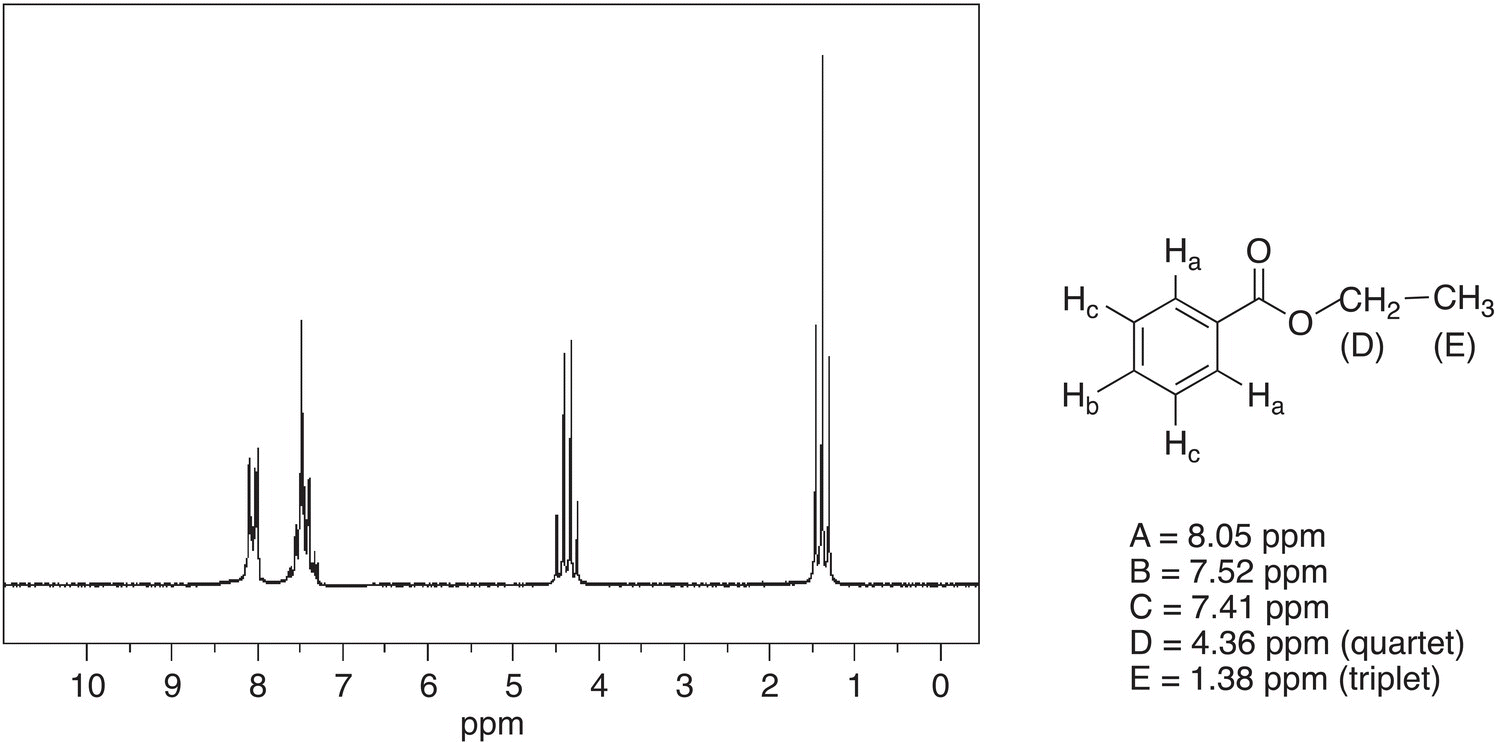
Figure 13.39 300 MHz 1H NMR spectrum of ethyl benzoate in CDCl3.
Source: with permission from AIST.
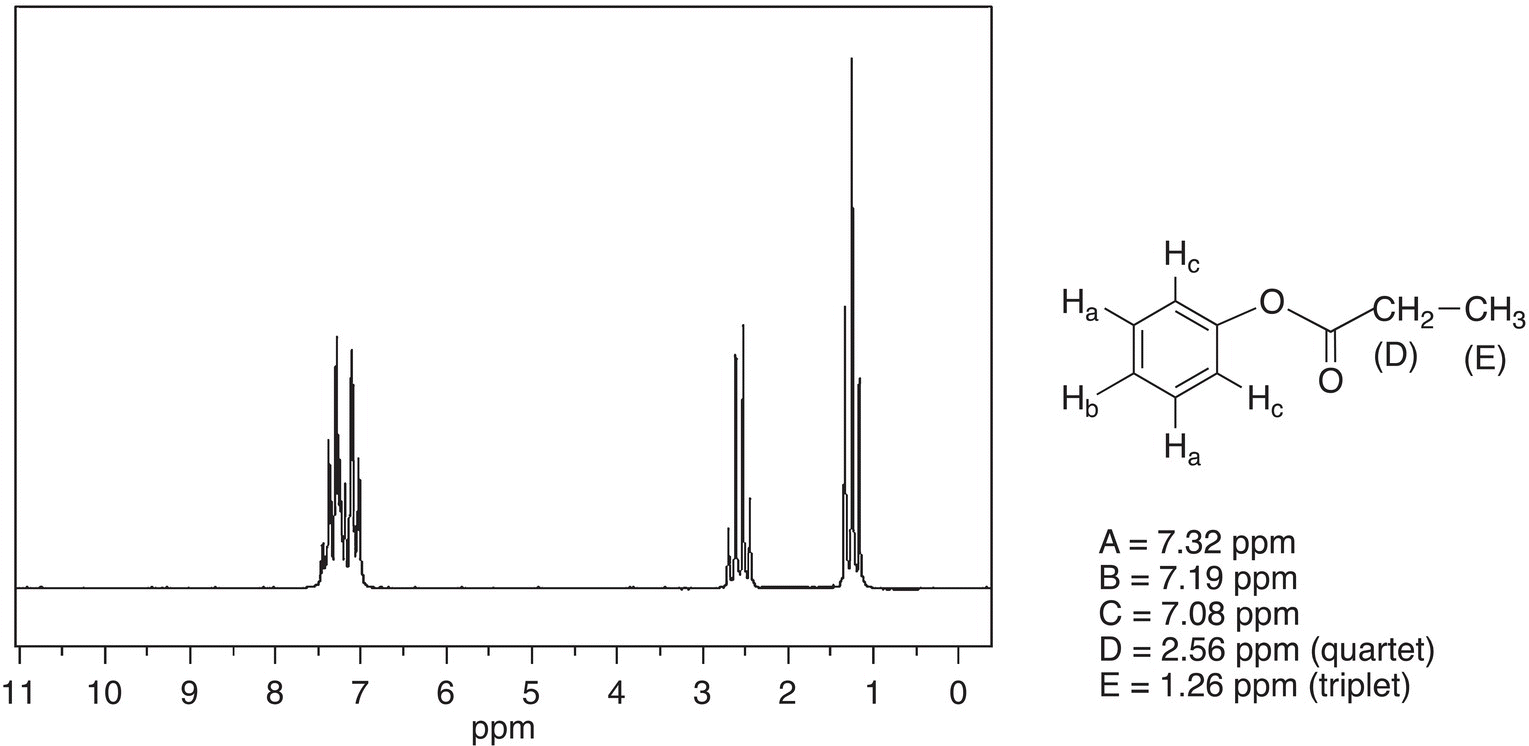
Figure 13.40 300 MHz 1H NMR spectrum of phenyl propionate in CDCl3.
Source: with permission from AIST.
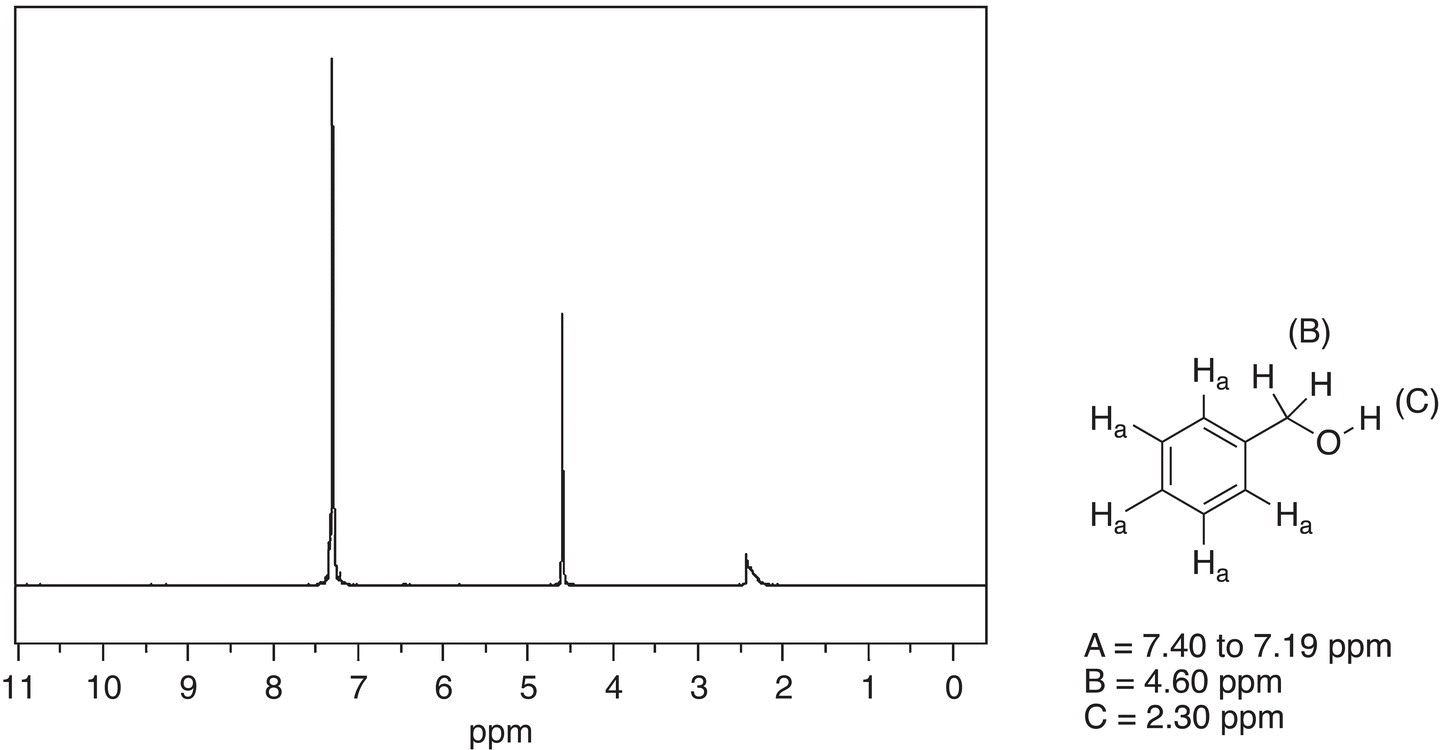
Figure 13.41 300 MHz 1H NMR spectrum of benzyl alcohol in CDCl3.
Source: with permission from AIST.
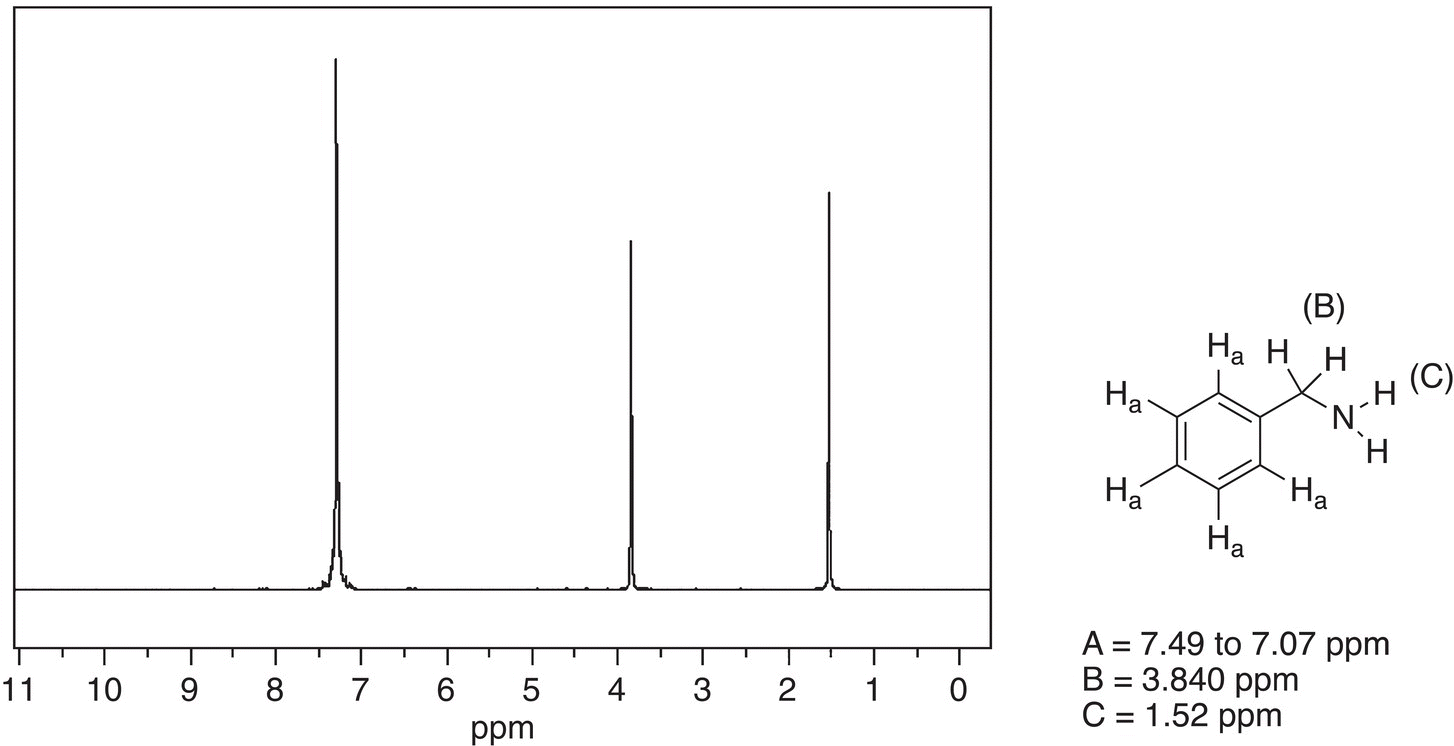
Figure 13.42 300 MHz 1H NMR spectrum of benzyl amine in CDCl3.
Source: with permission from AIST.
This spectrum is very similar to that for ethyl benzoate, which is given in Figure 13.39, except that the chemical shifts for the upfield signals are different. The signal for the CH2, which appears as a quartet, is further upfield compared to that of ethyl benzoate. Since the CH2 is bonded to a carbonyl carbon and not the electronegative oxygen as in ethyl benzoate, the signal appears further upfield. As a result, it is possible for the chemical shifts to give evidence of the connectivity of atoms in the structure of an unknown compound.
Shown in Figures 13.41 and 13.42 are the 1H NMR spectra of benzyl alcohol and benzylamine, respectively. As expected, there are three signals for the three different types of protons of these compounds. Note that the chemical shifts for the two signals for the upfield signals are slightly different for each compound however. Due to the presence of the more electronegative oxygen, compared to nitrogen, the signals are more downfield for benzyl alcohol, compared to benzylamine.
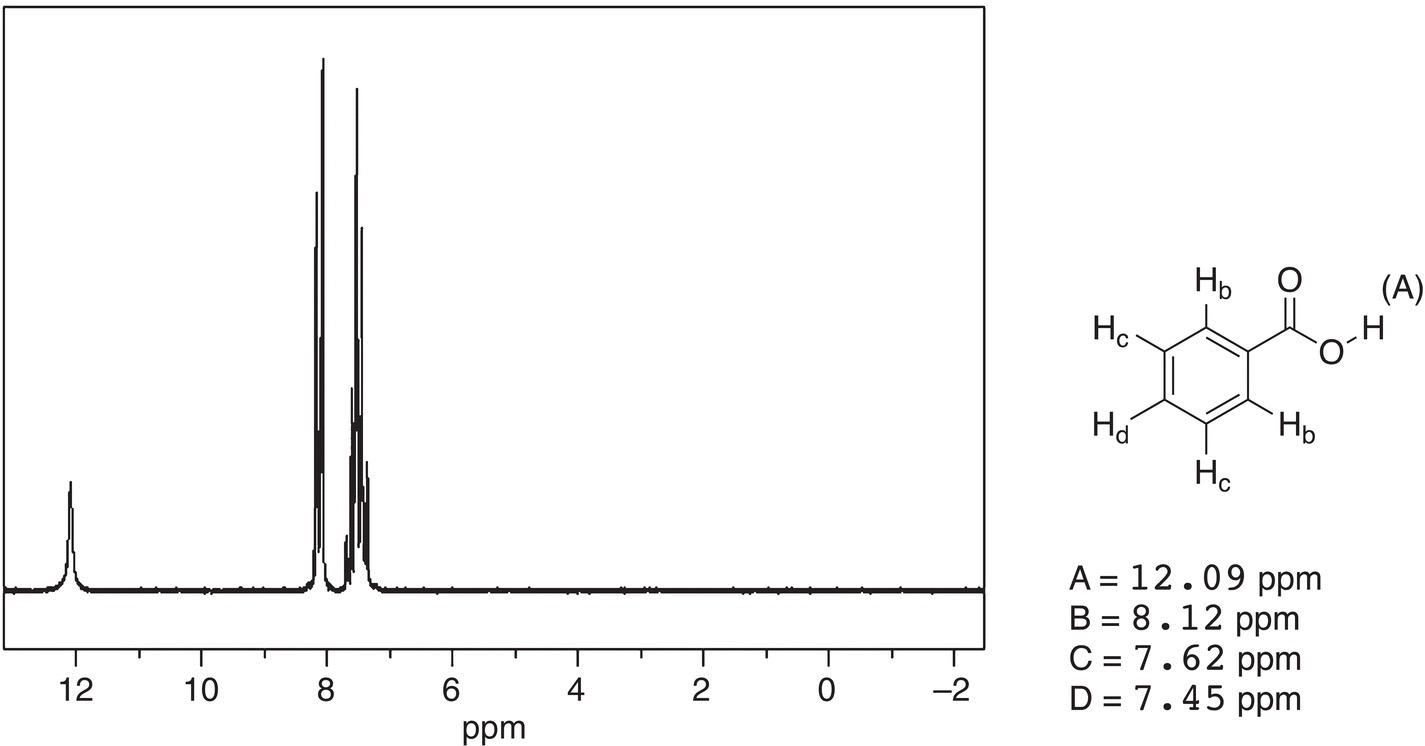
Figure 13.43 300 MHz 1H NMR spectrum of benzoic acid in CDCl3.
Source: with permission from AIST.
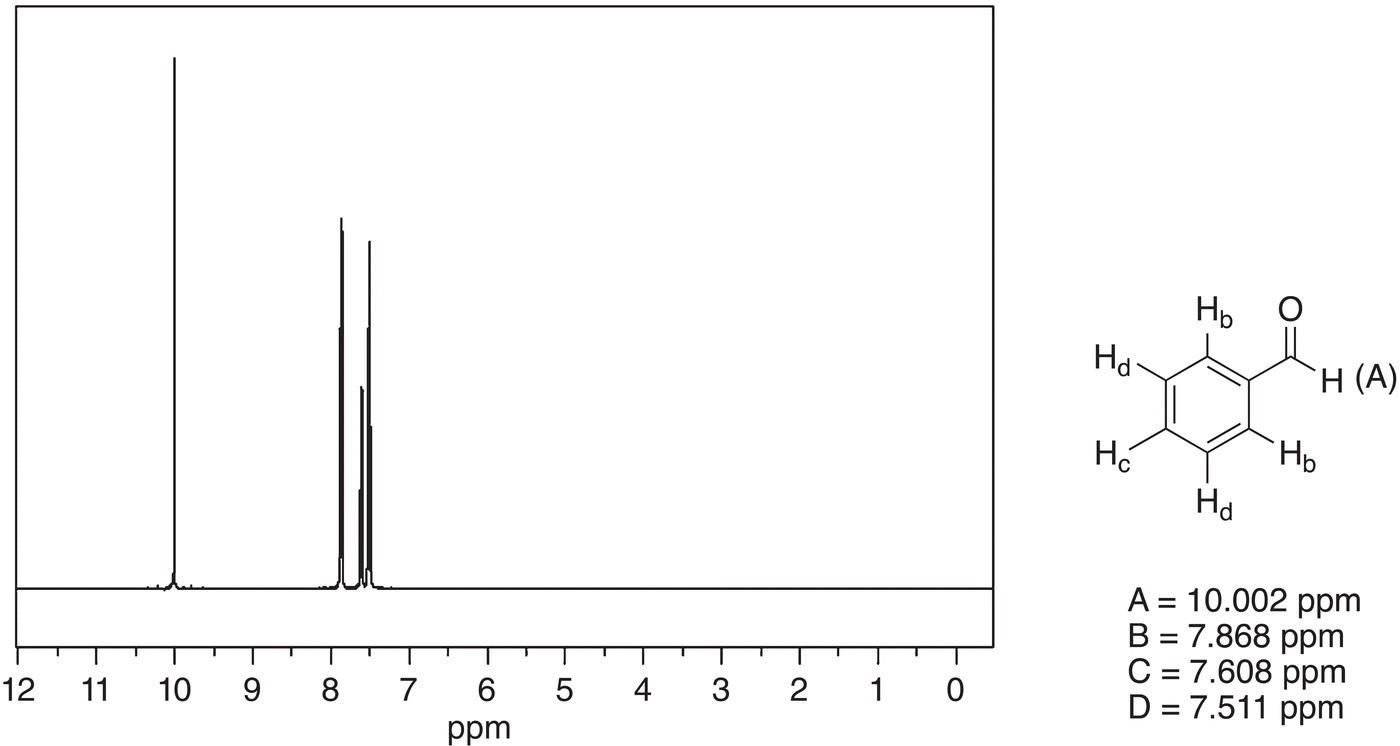
Figure 13.44 300 MHz 1H NMR spectrum of benzaldehyde acid in CDCl3.
Source: with permission from AIST.
The last set of spectra to be examined are those of benzoic acid and benzaldehyde, which are shown in Figures 13.43 and 13.44, respectively.
The spectra for these two compounds are very similar, except the downfield signal. For benzoic acid, it appears at 12.09 ppm, whereas for benzaldehyde, it appears at 10.02 ppm. As expected, since the proton in benzoic acid is bonded to the electronegative oxygen, it appears further downfield, compared to the proton that is bonded to the carbonyl carbon of benzaldehyde, which appears further upfield. Again, these two examples demonstrate that the NMR can be used to gain the atom connectivity in different unknown molecules.
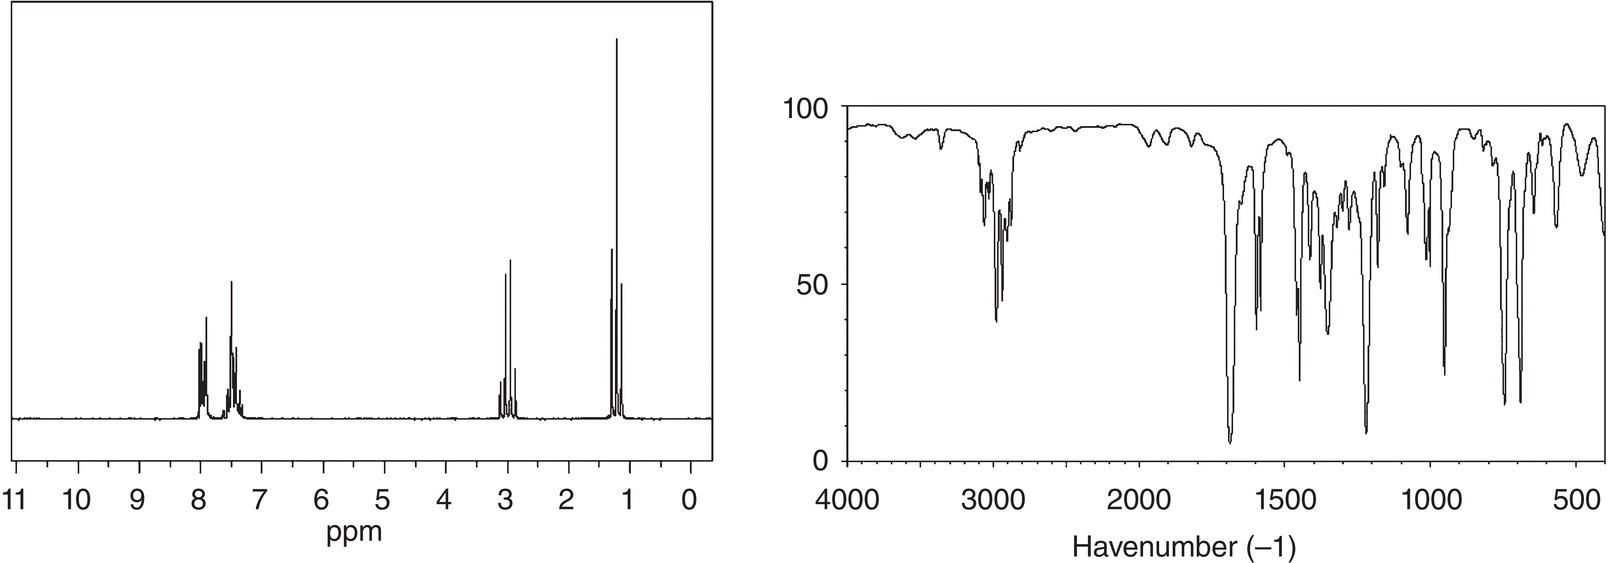
Problem 13.5
An unknown compound showed a molecular weight ion peak at 134.2 m/z. The 1H NMR and IR spectra are given below. Give a likely structure of this unknown compound.
13.6.7 Carbon-13 NMR (13C NMR)
The carbon-13 isotope is another nucleus that has an odd number of electrons and hence has a spin number of ½, which makes it NMR active as described earlier for the 1H. 13C spectra give details about the carbon skeleton of an unknown compound. The natural abundance of 13C is 1.1% of the total carbon atom (12C, 13C, and 14C). The natural abundance of 12C is >98% of the carbon atoms in any molecule. Of the isotopes of carbon, only the 13C gives rise to an NMR signal. Owing to the extremely low abundance of natural occurring 13C NMR in any sample, a high concentration of sample is typically required to gain good 13C NMR spectra, but owing to the increased sensitivity of the modern instruments, good 13C NMR spectra can be obtained even at relatively low sample concentrations.
13.6.8 Carbon-13 Chemical Shifts and Coupling
The same concept as that described in the previous section for the 1H NMR spectroscopy applies the C-13 NMR spectra. The environment around a carbon affects the magnetic environment about each carbon of a molecule. The chemical shift values are different, however, for 13C NMR, compared to 1H NMR. For the excitation of protons, different energies are required, compared to the excitation of carbons. Examples of chemical shift values are shown in Table 13.4.
Splitting does not occur as discussed in the proton NMR spectroscopy since the probability of two C-13 atoms appearing next to each other in a molecule is very low. As a result, the signals for the C-13 NMR appear as singlets and reflect the environment of each carbon. The C-13 NMR spectra give information about the different types of carbons that are present in an organic molecule. Shown in Figure 13.45 is the 13C NMR of benzene.
Since all the carbons of benzene are equivalent, they all appear as a single signal at 128.36 ppm in the C-13 NMR spectrum, which matches the expected chemical shift from Table 13.4. On the other hand, the C-13 spectrum for nitrobenzene is shown in Figure 13.46, along with the assignments.
Since nitrobenzene is a symmetrical molecule, there are four different signals for the four different carbons of nitrobenzene; note that two types of carbons are equivalent. The chemical shift for the carbon that is bonded to the nitro group is furthest downfield as expected based on the electronegativity of the nitro group. The spectrum of 1,3-dinitrobenzene is shown in Figure 13.47.
Table 13.4 Carbon-13 chemical shift values based on different environments of different carbons.
Type of carbon |
Type of compound |
Chemical shift range (ppm) |
R─CH3 |
Aliphatic |
8—35 |
R2─CH |
Aliphatic |
15—50 |
R3─CH |
Aliphatic |
20—60 |
R4─C |
Aliphatic |
30—40 |
R─CONR2 |
Amide |
165—175 |
R─CO2R |
Ester |
165—175 |
R─CO2H |
Carboxylic acid |
175—185 |
R─COH |
Aldehyde |
190—200 |
R─COR |
Ketone |
205—220 |
|
Alkyne |
65—85 |
|
Alkene |
100—150 |
|
Phenyl |
110—170 |
|
Benzylic |
30—90 |
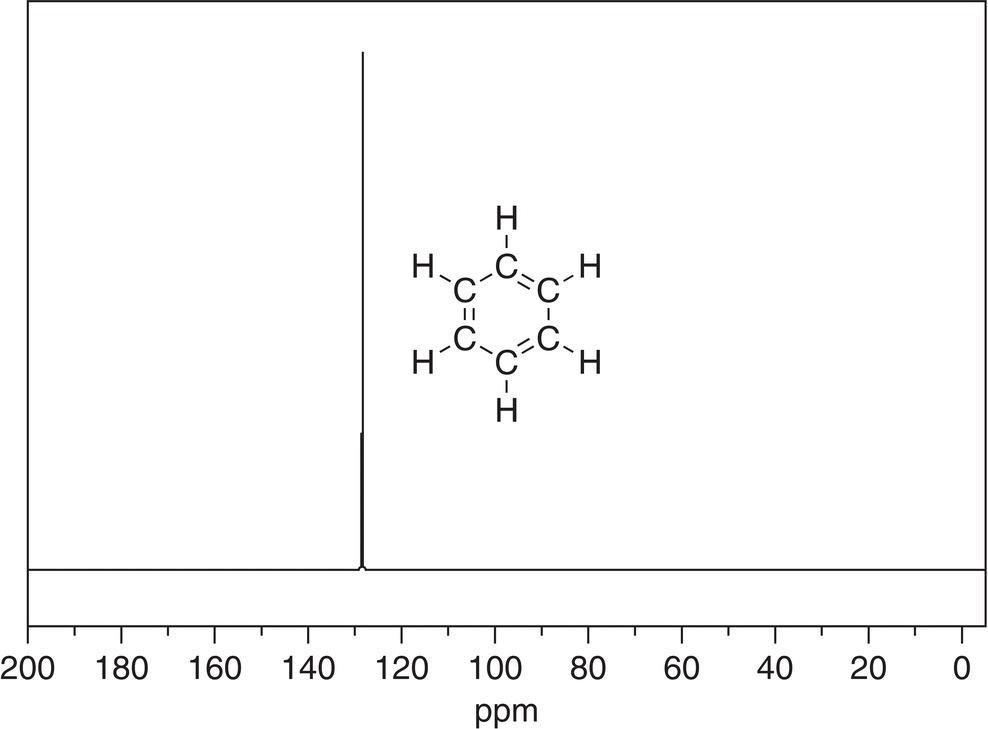
Figure 13.45 300 MHz 13C NMR spectrum of benzene in CDCl3.
Source: with permission from AIST.
Since 1,3-dinitrobenzene is a symmetrical molecule, it shows four different signals, which correspond to the four different carbons of 1,3-dinitrobenzene.
The 13C NMR spectrum of a slightly more complex molecule, benzyl alcohol, is shown in Figure 13.48.
An obvious signal of the spectrum appears upfield at 64.70 ppm. The chemical shift of this carbon corresponds to the chemical shift of the benzyl carbon as shown in Table 13.4. Two molecules that are similar in structure to benzyl alcohol, but have different functional groups, the carboxylic acid and the aldehyde functionalities are shown in Figures 13.49 and 13.50.
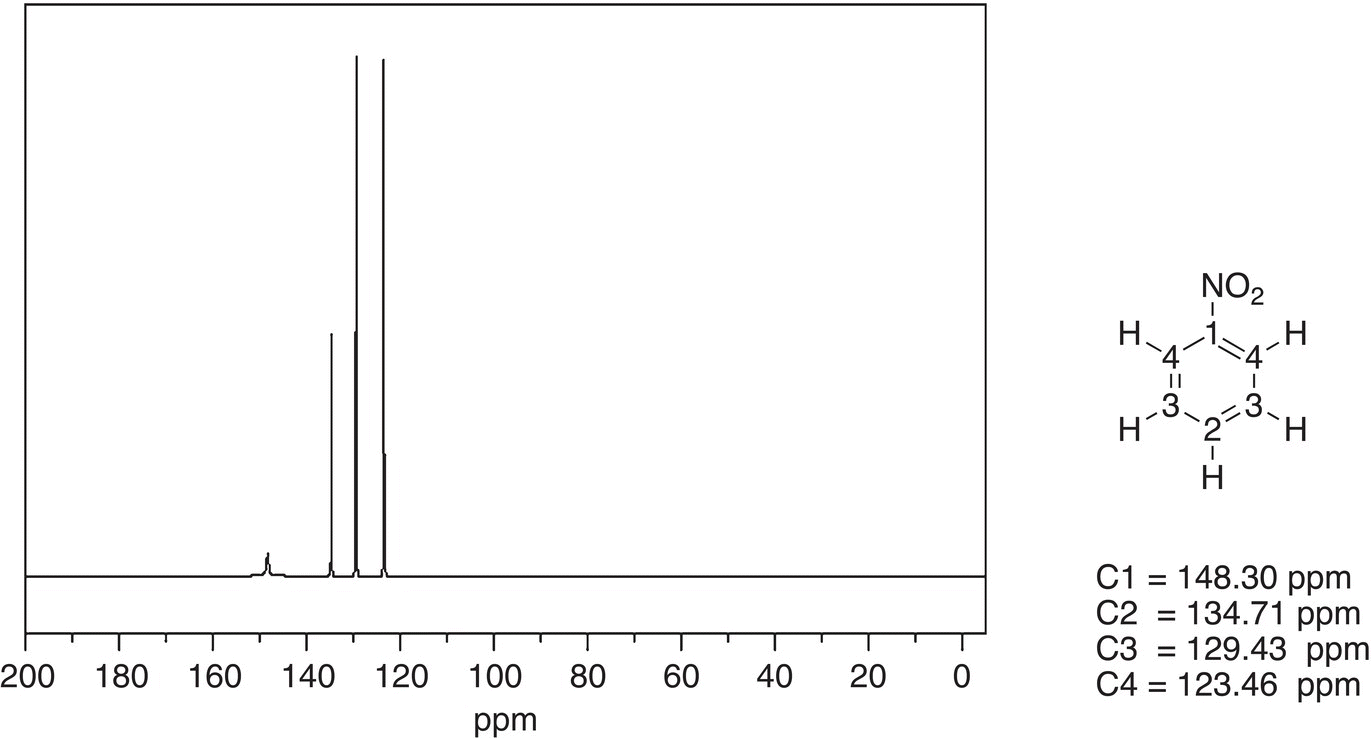
Figure 13.46 300 MHz 13C NMR spectrum of nitrobenzene in CDCl3.
Source: with permission from AIST.
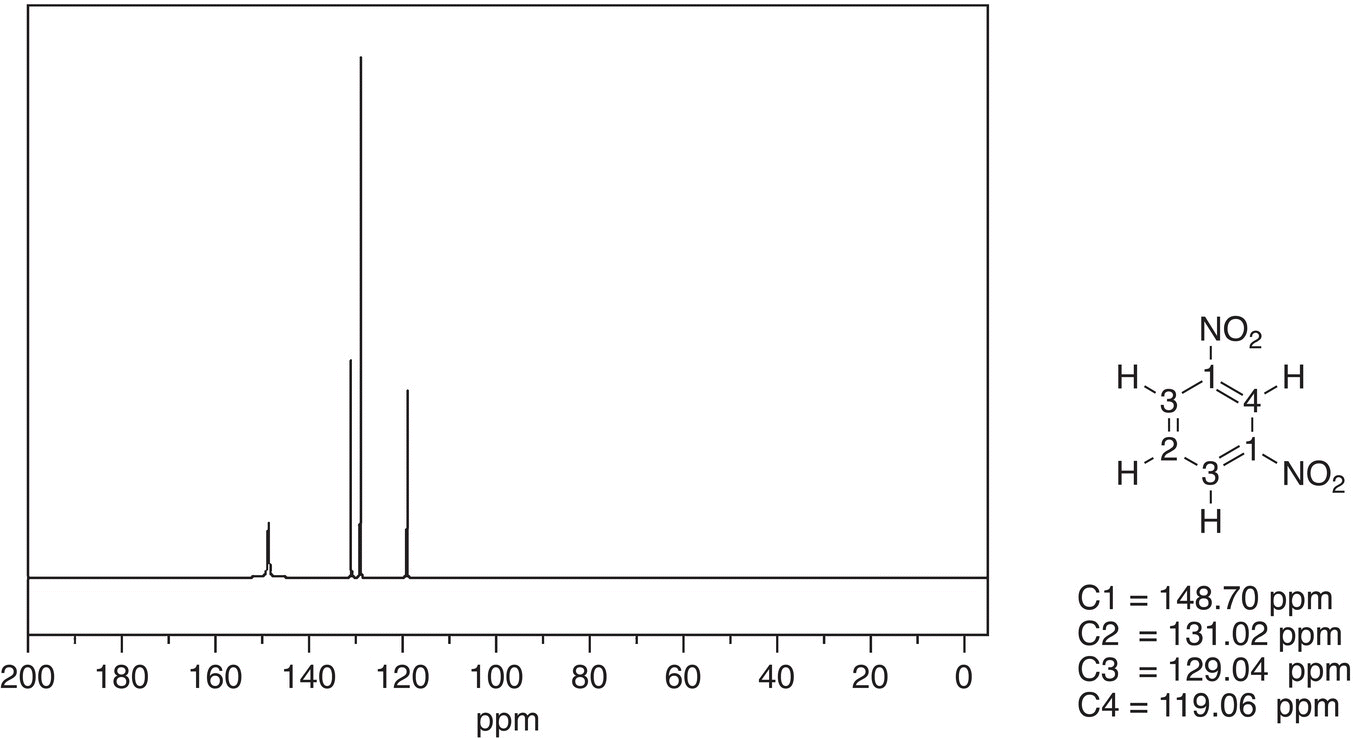
Figure 13.47 300 MHz 13C NMR spectrum of 1,3-dinitrobenzene in CDCl3.
Source: with permission from AIST.
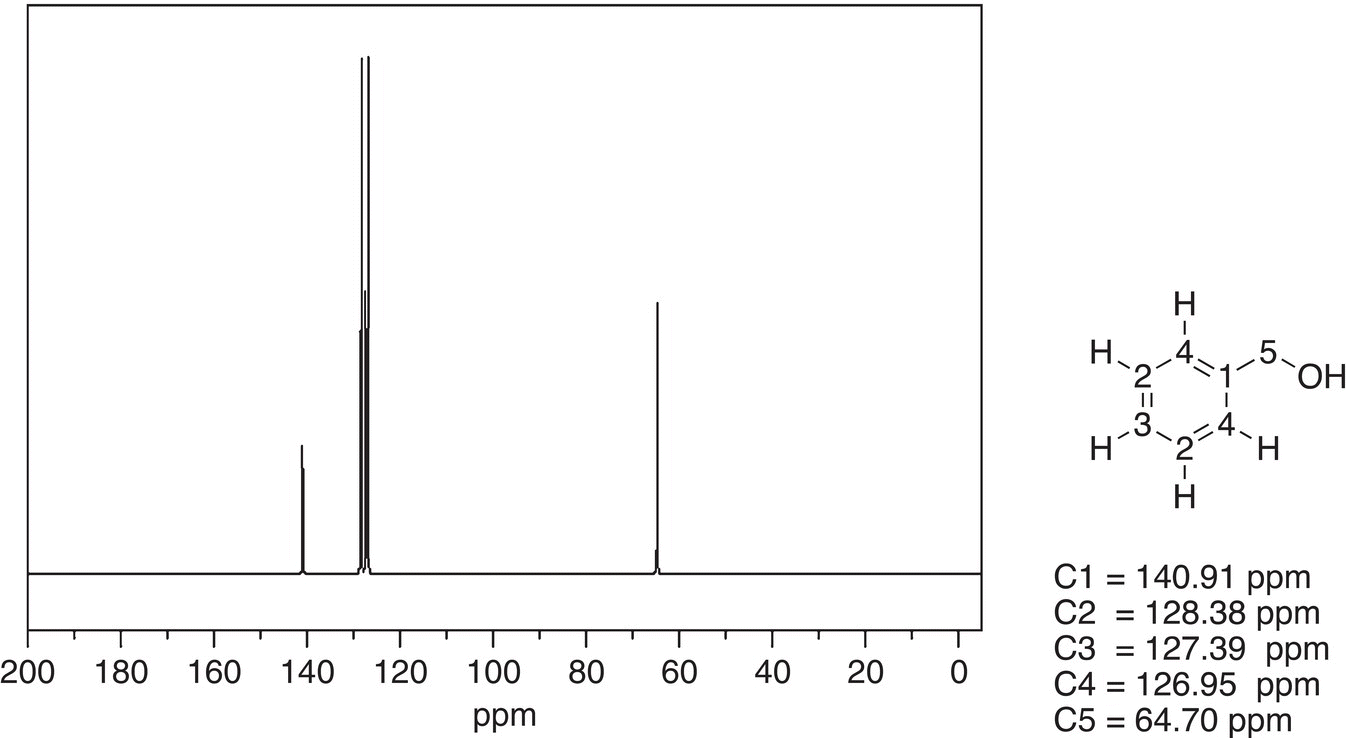
Figure 13.48 300 MHz 13C NMR spectrum of benzyl alcohol in CDCl3.
Source: with permission from AIST.
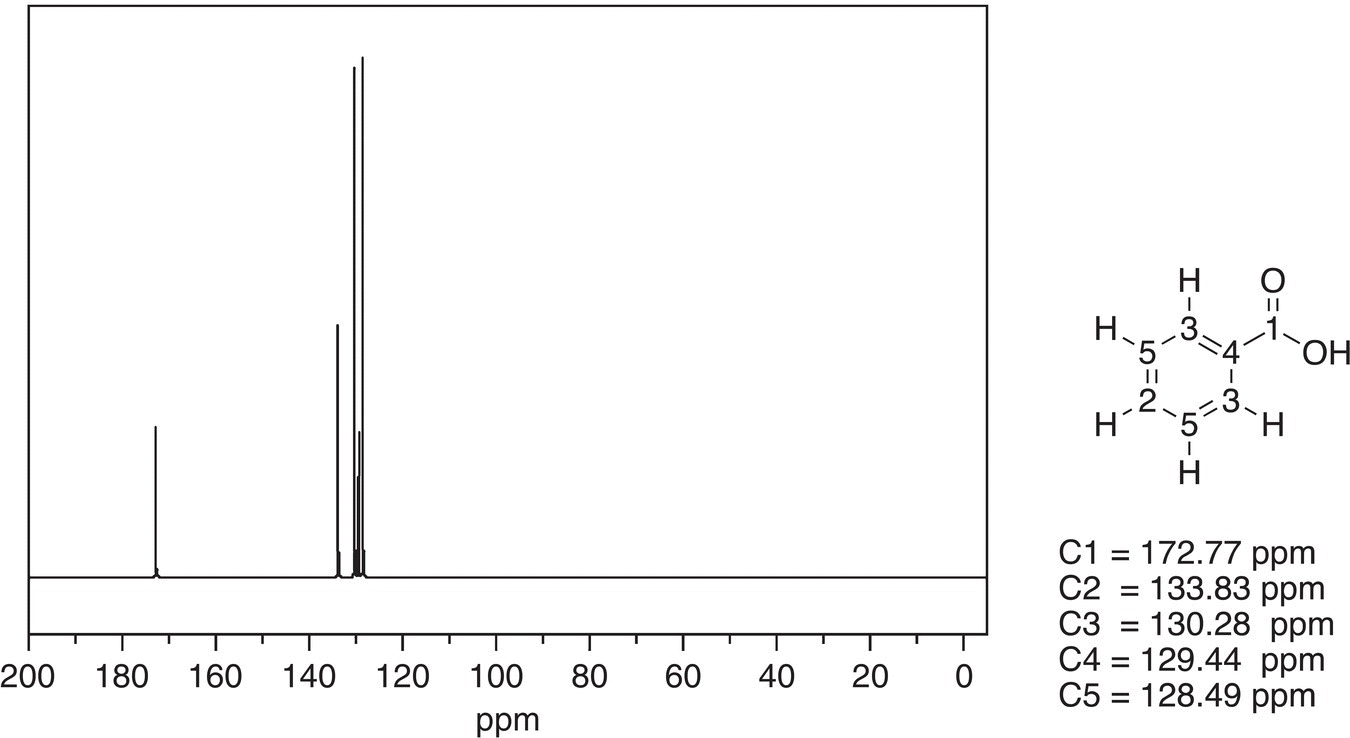
Figure 13.49 300 MHz 13C NMR spectrum of benzoic acid in CDCl3.
Source: with permission from AIST.
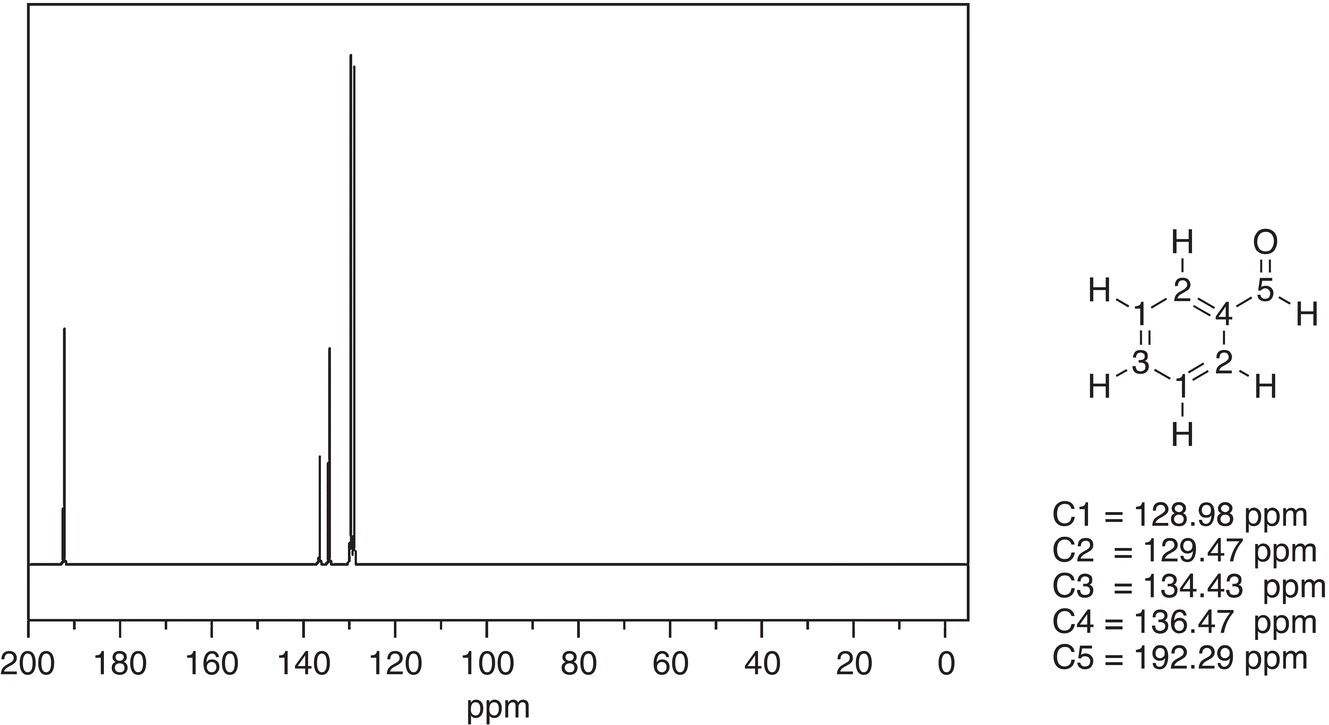
Figure 13.50 300 MHz 13C NMR spectrum of benzaldehyde in CDCl3.
Source: with permission from AIST.
Both spectra are similar except for the chemical shift of downfield signals are different. As you will see from the C-13 NMR table, the signal for the carbonyl carbon of the aldehyde is further downfield, compared to that of the carboxylic acid. Thus, based on the difference in chemical shift values for the downfield signal, it is possible to distinguish between benzoic acid and benzaldehyde.
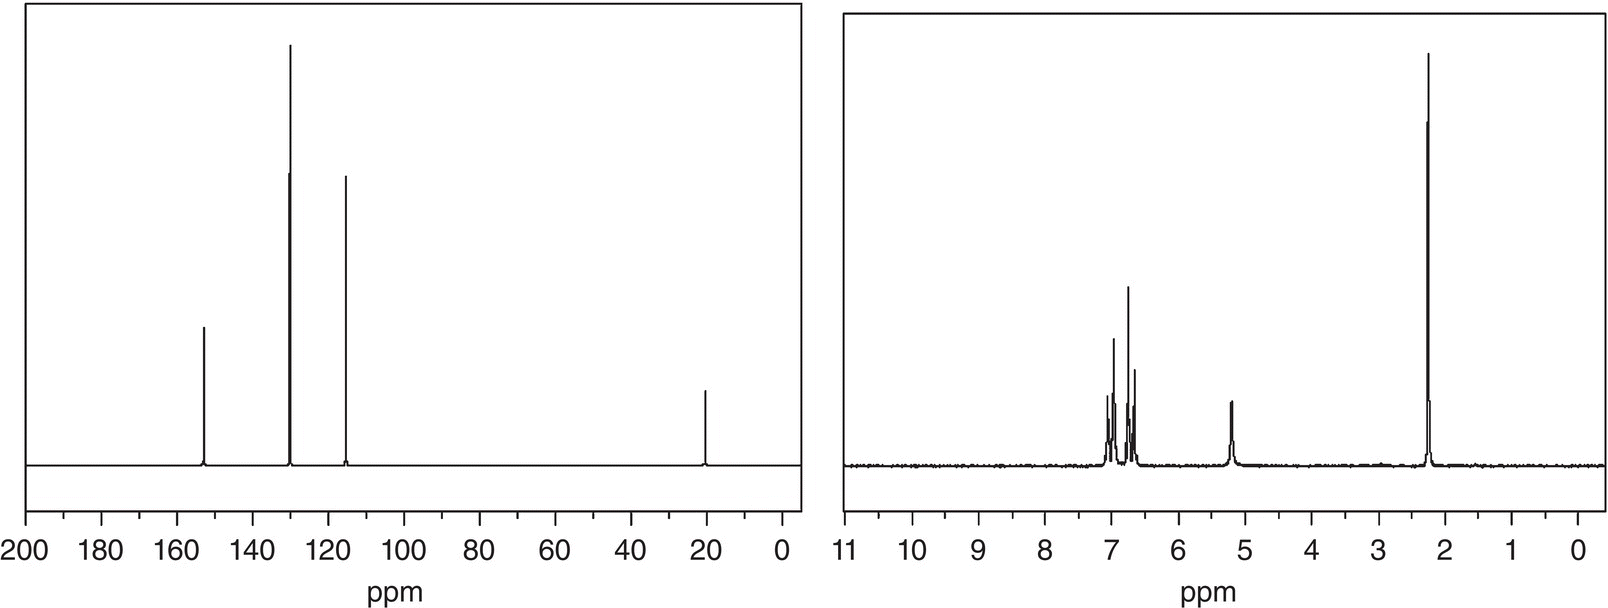
Problem 13.6
It was shown that an unknown compound has a molecular formula of C7H8O, and the IR spectrum showed a broad band around 3400 cm−1. The 13C NMR (left) and 1H NMR (right) spectra are given below. Give a likely structure of this unknown compound.