Organic Chemistry: Concepts and Applications - Headley Allan D. 2020
Heteroatomic Functional Groups and Organic Nomenclature
3.16 An Overview of Spectroscopy and the Relationship to Functional Groups
Everyday, new organic compounds are being identified and isolated from natural sources, and new compounds are also constantly being synthesized in the research laboratories. As we know, some of these compounds from natural sources, such as plants, have healing and medicinal benefits, and as we have pointed out in Chapter 1, if they are to be reproduced in large quantities for pharmaceutical use, we have to know their structures, and especially the type of functional groups present. In addition, for such compounds to be synthesized, chemists need to make sure that the newly synthesized compounds contain the correct functional groups and that they are actually the intended compounds. Thus, an integral aspect of an organic chemist’s work is the determination of the actual structure of newly discovered and synthesized compounds. For less complicated compounds, it is possible to make structure determination based on physical methods. Since we know that the physical properties of compounds are different and the probability of any two compounds with the exact same set of physical properties is very unlikely, once the physical properties of an unknown compound are known, a comparison can be made with known compounds to determine its identity by matching the physical properties of the known with the unknown. This method is not the best method for larger more complex organic molecules that have many functional groups, such as those of compounds obtained from natural sources and compounds synthesized in a research lab. As a result, chemists have resorted to another method to determine the type of functional groups that are present in unknown compounds. Spectroscopic methods can be used to assist in the determination of the presence of different functional groups and eventually the structures of unknown compounds. We will cover spectroscopy in much greater details in Chapter 13; in this section, we will briefly cover one type of spectroscopy, infrared (IR) spectroscopy, that is integral for the identification of functional groups on unknown molecules.
3.16.1 Infrared Spectroscopy
Once molecules are allowed to interact with energy of a specified frequency, the molecules reach excited states owing to the energy absorbed. Once this energy is absorbed, there are different outcomes. For example, when molecules are excited by energy in the IR region of the electromagnetic spectrum, the bonds of the molecules vibrate and bend in a predictable manner. The bonds in a molecule can be described as a spring holding together the two atoms of a bond and that there is a constant vibration of this spring. The energy required to vibrate a strong bond is less than the energy required to vibrate a weaker bond. Thus, a scan of energy of the IR region of the electromagnetic spectrum will cause different bonds of a molecule to vibrate at different frequencies. This type of scan is known as a spectrum and if a comparison of the IR spectrum of an unknown compound is made against that of known compounds, an indication of the type of bonds, and hence functional groups, that are present in a molecule can be achieved. The IR spectrum of water is given in Figure 3.1.
There are important features of an IR spectrum that should be pointed out. The x-axis is given in wavenumbers (cm−1) and reflects the energy supplied to the molecule in the IR region of the electromagnetic spectrum. For the IR spectrum shown in Figure 3.1, the energy was scanned from around 4000 cm−1 to around 900 cm−1. The y-axis (transmittance) shows regions of the scan where the molecule absorbed energy and specific vibrational modes were excited as described earlier. Note that there is a noticeable signal (also known as band) at 3400 cm−1. This signal is due to the O─H stretch vibration brought about by the energy in that region of the electromagnetic spectrum. All molecules that contain an O─H bond have a signal in this region of the IR spectrum. Figure 3.2 shows the IR spectrum of methanol; note that there is a signal that occurs in the region of 3300 cm−1, which indicates the presence of an O─H group.
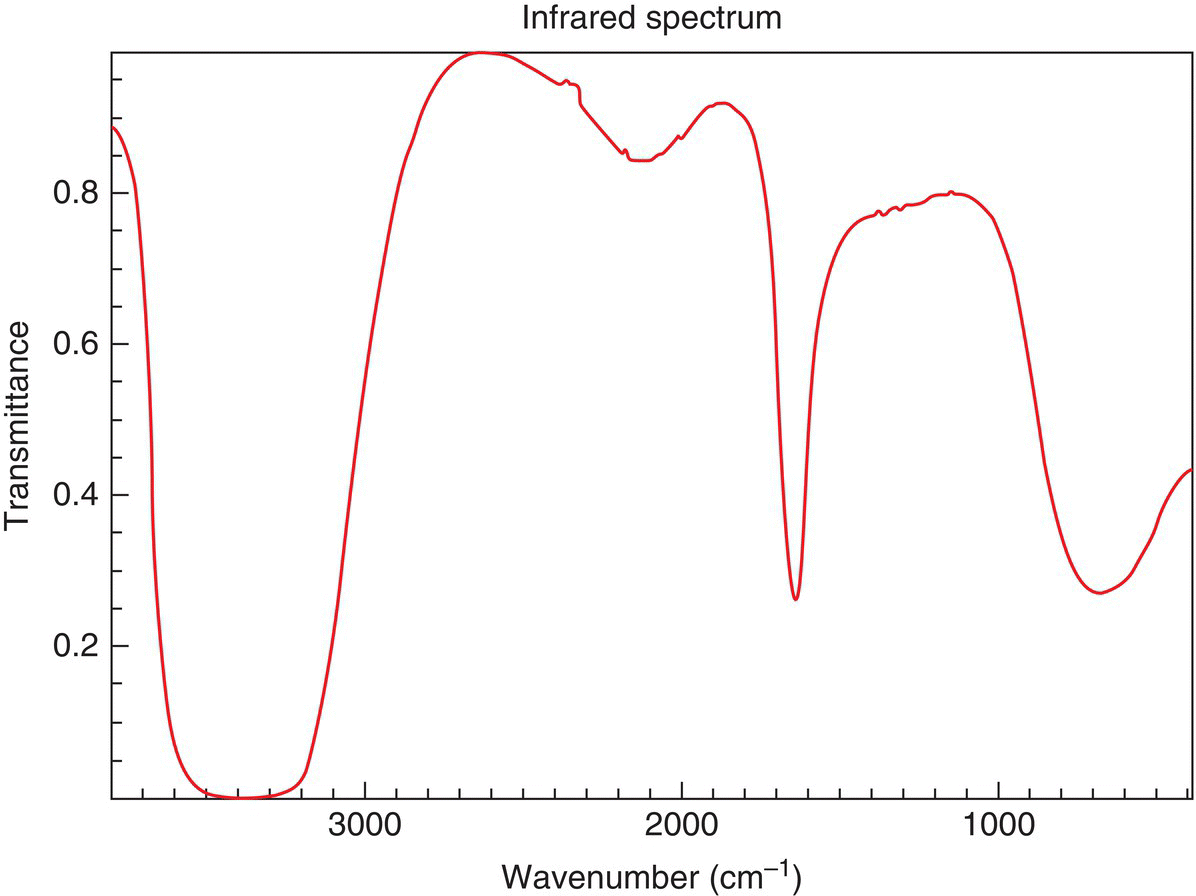
Figure 3.1 Infrared spectrum of water (H─O─H).
Source: with permission from NIST.
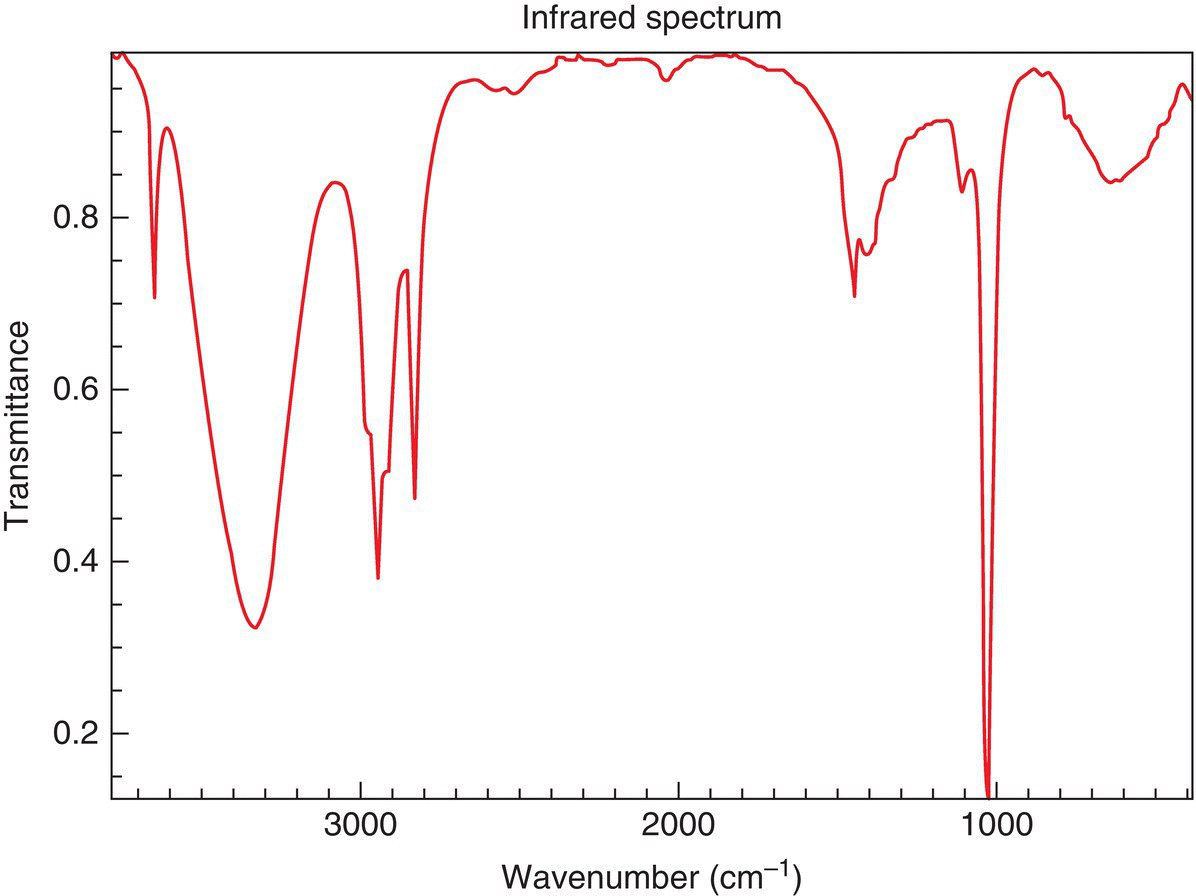
Figure 3.2 Infrared spectrum of methanol (CH3─OH).
Source: with permission from NIST.
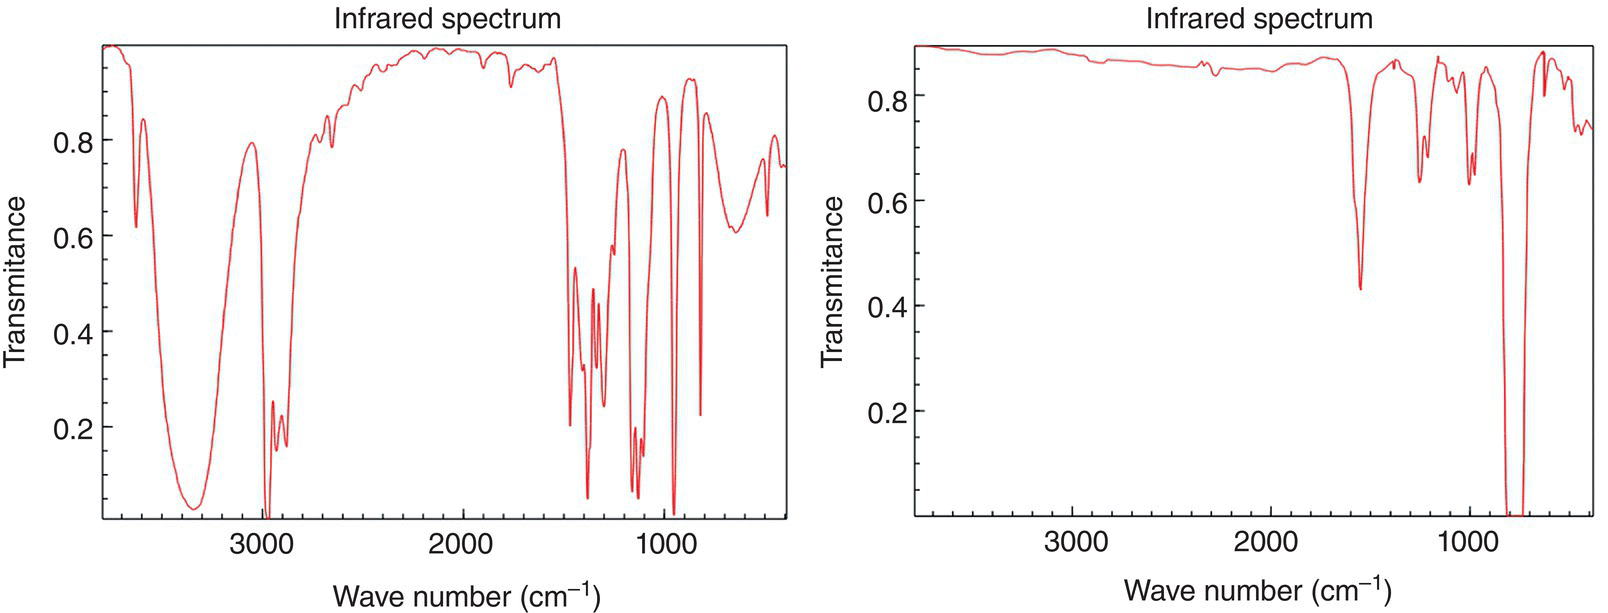
Problem 3.28
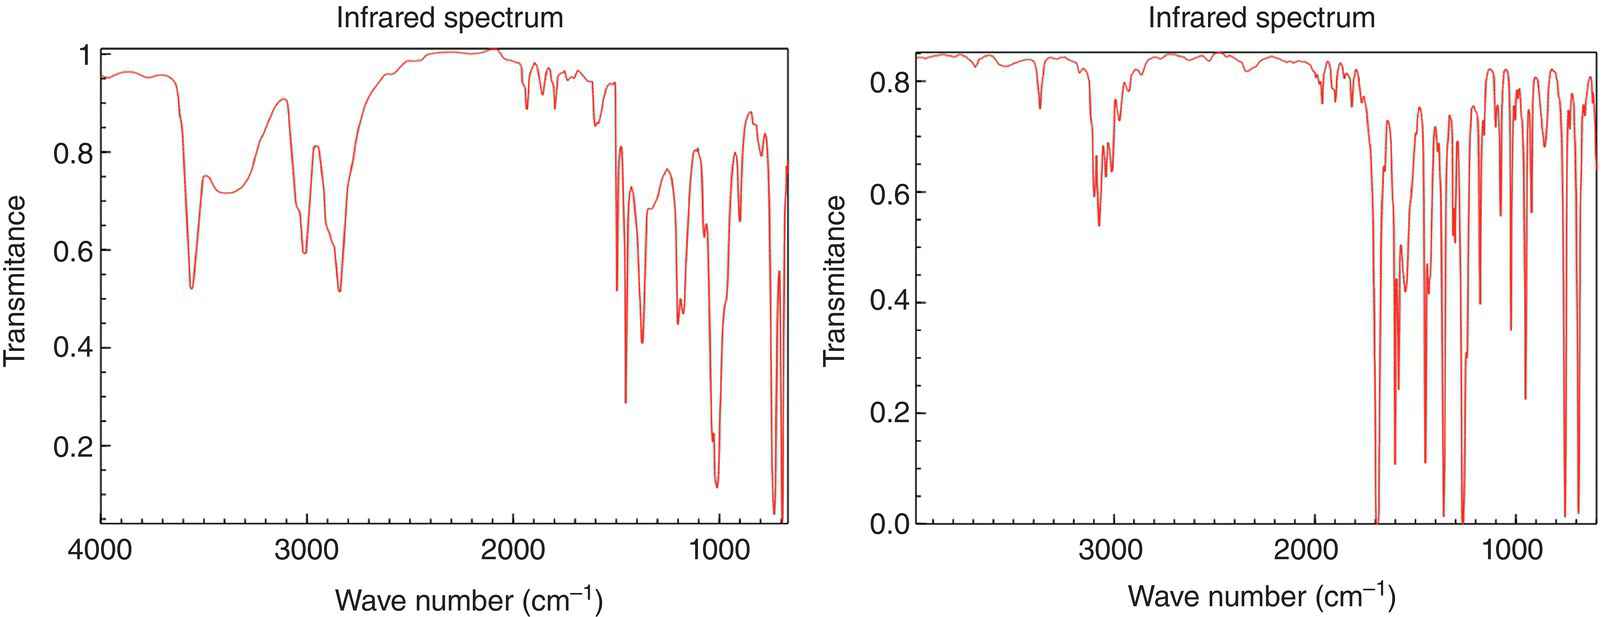
Shown below are two IR spectra, one is for tetrachloromethane (CCl4) and the other for 2-propanol. Predict which belongs to each compound.
This type of analysis can be used to identify the different types of bonds and functional groups present in a molecule. Table 3.1 shows the regions of the IR spectrum where different vibrational modes of different functional groups occur. By comparison of this information with that obtained from the IR spectrum of an unknown compound, the presence of specific functional groups can be determined.
Table 3.1 Selected IR frequencies of common functional groups.
Bond |
Functional group |
Type vibration |
Frequency (cm−1) |
Intensitya |
C─H |
Alkane |
Stretch |
3000—2850 |
s |
CH3 |
Bend |
1450 and 1375 |
m |
|
—CH2— |
Bend |
1465 |
m |
|
Alkenes |
Stretch |
3100—3000 |
m |
|
Out-of-plane bend |
||||
Aromatics |
Stretch |
3150—3050 |
s |
|
Out-of-plane bend |
900—690 |
s |
||
Stretch |
w |
|||
|
Alkyne |
Stretch |
~3300 |
s |
C=O |
Aldehyde |
1740—1720 |
s |
|
Ketone |
1725—1705 |
s |
||
Carboxylic acid |
1725—1700 |
s |
||
Ester |
1750—1730 |
s |
||
Amide |
1670—1640 |
s |
||
Anhydride |
1810—1740 |
s |
||
Acid chloride |
1800 |
s |
||
C─O |
Alcohols, ethers, esters, carboxylic acids, anhydrides |
1300—1000 |
s |
|
O─H |
Alcohols, phenols |
3650—3600 (free) |
m |
|
─COOH |
Carboxylic acid |
3400—2400 |
m |
|
N─H |
Primary and secondary amines and amides |
Stretch |
2500—3100 |
m |
Bend |
1640—1550 |
m-s |
||
C─N |
Amines |
1350—1000 |
m-s |
|
C=N |
Imines and oximes |
1690—1640 |
m-s |
|
C≡N |
Nitriles |
2260—2240 |
m |
|
X=C=Y |
Allenes, ketenes, isocyanates, isothiocyanates |
2270—1950 |
m-s |
|
N=O |
Nitro (─NO2) |
1550—1350 |
s |
|
S─H |
Thiols |
2250 |
w |
|
S=O |
Sulfoxides |
1050 |
s |
|
Sulfones, sulfonyl chlorides, sulfates, sulfonamides |
1375—1300 |
s |
||
C─X |
X = Fluorine |
1400—1000 |
s |
a Intensity of the signal.
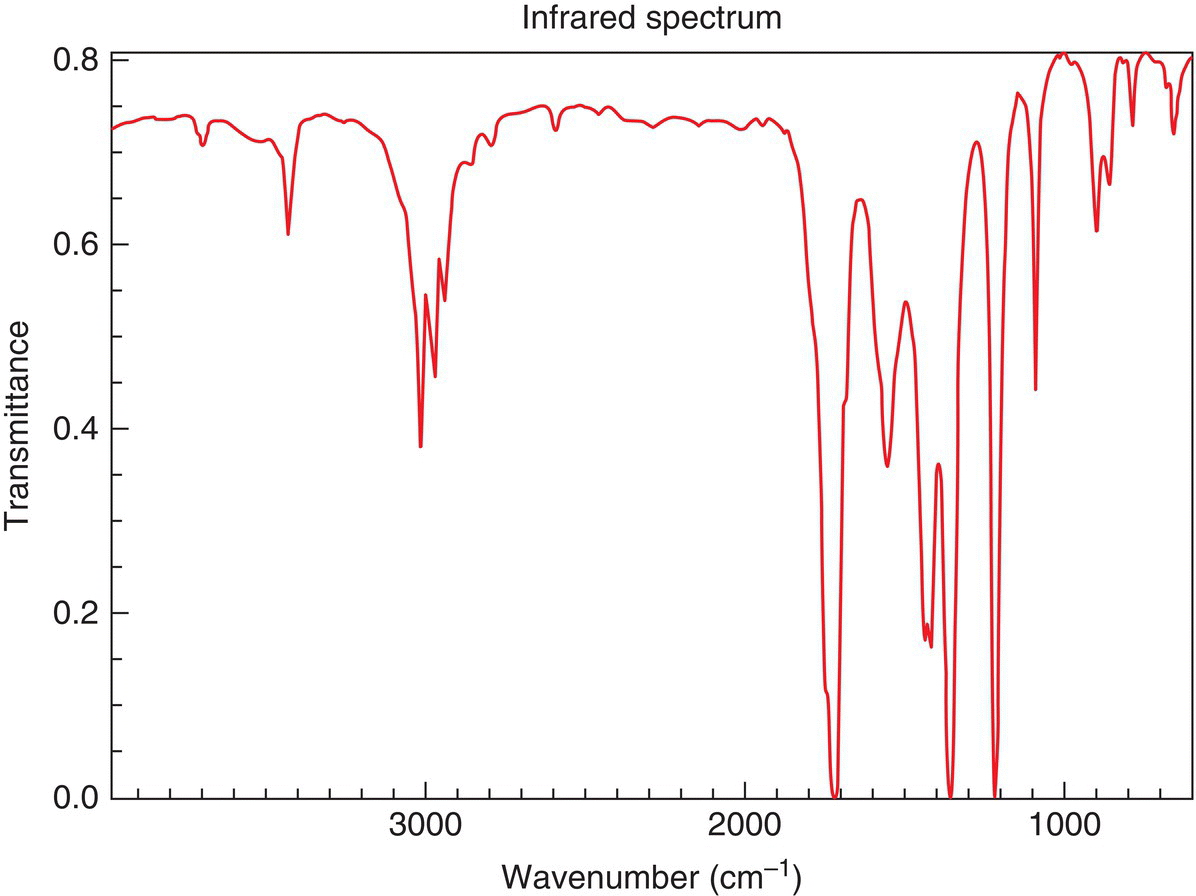
Figure 3.3 Infrared spectrum of 2-propanone (CH3COCH3).
Source: with permission from NIST.
Shown in Figure 3.3 is the IR spectrum for 2-propanone. A close examination of the spectrum reveals that there is no signal around 3400 cm−1, which indicates that this molecule does not have an O─H functionality. However, there is a prominent band at 1700 cm−1. Table 3.1 shows that a band in the region of 1725—1705 cm−1 corresponds to the carbonyl of a ketone. Thus, this is confirmation that the molecule has a carbonyl group and more than likely in the form of a ketone.
Problem 3.29
Shown below are two IR spectra, one is for benzyl alcohol (C6H5CH2OH) and the other is for acetophonone (C6H5COCH3), identify which belongs to each compound.
Thus, IR spectroscopy is a major tool that gives chemists the ability to determine the presence of different functional groups in different molecules.