Physical Chemistry Essentials - Hofmann A. 2018
The Fabric of Atoms
8.2 Properties of Atoms
8.2.1 Atomic Spectroscopy
Equipped with some knowledge about electrons and photons, we next want to investigate their interactions with atoms in order to learn more about the inner makings of atoms. Therefore, we again employ accelerated electrons, such as in a cathode ray tube (Fig. 8.7), and probe their collisions with gas molecules. The cathode ray tube is thus filled with mercury vapour such that the electrons can collide with Hg atoms in the gas phase. A grid is placed between the cathode and the anode and a counter voltage is applied between grid and anode to slow down the electrons.
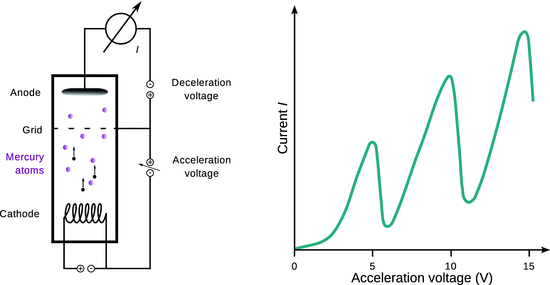
Fig. 8.7
Illustration of the experiment by Franck and Hertz. Left: Electrons emitted by the cathode are accelerated towards a grid by a varying acceleration potential and eventually collide with mercury atoms in the gas phase (magenta). After being slowed down, they hit the anode and a current is registered. Right: Electron current in dependence of the acceleration potential. The sharp drop of current on the right side of each peak indicates a loss of energy of the electrons. This energy is absorbed by the mercury atoms, which transit into an excited state
With increasing acceleration voltage, an increased current (= stream of electrons) is registered, as more and more electrons are being emitted by the cathode. The collisions with Hg atoms thus need to be elastic, i.e. they appear without loss of kinetic energy. However, once the acceleration voltage is larger than a threshold voltage (here 4.9 V), the current drastically drops, indicating that a large number of electrons no longer possesses the necessary energy to overcome the potential difference between the grid and the anode. Apparently, the electrons lose their energy in an inelastic collision with the Hg atoms. Once the voltage is increased beyond the threshold voltage, the mercury vapour starts to emit light with a wavelength of 253.6 nm, which corresponds to an energy of 4.9 eV which is exactly the energy lost by the electrons in their inelastic collisions. This energy appears to be transferred onto the gas atoms, which then are in an excited state. They return from this excited state in to the ground state by emitting this energy in form of photons.
This experiment by Franck and Hertz indicates that atoms only absorb and emit energy in discrete portions, demonstrating the quantum nature of atoms (Franck and Hertz 1914). Since the collisions between the accelerated electrons and atoms indeed happen by collisions between the accelerated electrons and the electrons in the atomic sphere, one can conclude that indeed the atomic electrons exists in discrete energy states.
Atoms can not only be excited by collisions with electrons; if sufficient thermal energy is provided, this may also lead to formation of excited atomic states. A simple experiment in this context is the observation of excited sodium atoms in the flame of a Bunsen burner or a plasma torch (Fig. 8.8 left). Sodium-containing salts introduced into the flame of a Bunsen burner result in a yellow colour of the flame. As the excited sodium atoms return to the ground state, they emit yellow light which can visually be observed. More generally, it becomes apparent that atoms only emit light of discrete wavelengths which is why atomic spectra are called line spectra.
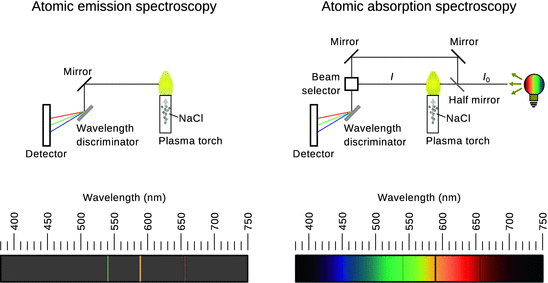
Fig. 8.8
Comparison of atomic emission (AES) and absorption spectroscopy (AAS). In AES, the emission of light from atoms in their excited states is measured and yields lines at discrete wavelengths observed against a dark background. In contrast, atoms may exist in their ground states and an external light source can be used to cause transition to an excited state. As this energy is then missing from the transmitted light, discrete wavelengths appear as absorption (black) lines against the continuous spectrum. The spectra shown illustrate the sodium line spectra
A similar experimental setup can be used to investigate absorption of light by atoms (Fig. 8.8 right). Using a light source that provides light in the entire visual spectral range, a continuous spectrum is observed when that light is refracted by a wavelength discriminator. If a Bunsen burner or plasma torch is placed between the light source and the wavelength discriminator, the thermal energy is used to vapourise individual atoms from salts introduced into the plasma or flame. Individual atoms in their ground states will absorb light of particular wavelengths coming from the light source and thus transition into excited states. These particular wavelengths are missing from the light that reaches the detector and appear as dark lines in the observed spectrum.
These concepts form the basis of atomic absorption ( AAS) and atomic emission spectroscopy ( AES). Both methodologies have been in use in analytical chemistry laboratories; however, atomic emission spectrometers are most frequently employed in contemporary laboratories, typically with an inductively coupled plasma as source of thermal energy ( ICP-AES).
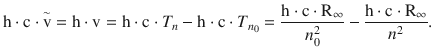
For illustration, we will consider the line spectrum of atomic hydrogen in more detail. Johann Balmer found empirically in 1885 that the spectral lines of atomic hydrogen can be classified into series which follow a mathematical relationship further developed by Johannes Rydberg and Walter Ritz:
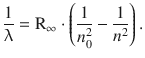
(8.14)
Here n and n 0 are integer numbers and n is always larger than n 0. For a particular series of lines, n 0 is a constant. The constant R∞ is known as the Rydberg constant and assumes a value of R∞ = 1.097·107 m−1 for hydrogen. The reciprocal wavelength is known as the wavenumber ![]() , and from Eq. 8.11, the following relationship can be derived:
, and from Eq. 8.11, the following relationship can be derived:

(8.15)
In Eq. 8.14, the expressions ![]() and
and ![]() are called atomic terms. For varying numbers n one thus obtains (Table 8.1):
are called atomic terms. For varying numbers n one thus obtains (Table 8.1):
Table 8.1
Spectroscopic terms
|
n |
T n |
1 |
T 1 = − R∞ |
2 |
|
3 |
|
4 |
|
∞ |
T ∞ = 0 |
Equation 8.14 can thus be expressed as:
![]()
(8.16)
The different series of spectral lines observed for atomic hydrogen are then obtained from Eq. 8.16 and given particular names as summarised in Table 8.2. Importantly, the wavenumbers ![]() of the individual lines can now be obtained by the difference of two atomic terms. Graphically, this can be visualised in a so-called term scheme (Fig. 8.9) whereby every term is shown as a horizontal line. The individual terms are ordered vertically with the ascending running number n. In such a term scheme, a specific spectral line then appears as a vertical difference line between two particular terms.
of the individual lines can now be obtained by the difference of two atomic terms. Graphically, this can be visualised in a so-called term scheme (Fig. 8.9) whereby every term is shown as a horizontal line. The individual terms are ordered vertically with the ascending running number n. In such a term scheme, a specific spectral line then appears as a vertical difference line between two particular terms.
Table 8.2
Spectral series of atomic hydrogen
Lyman series |
n 0 = 1 |
|
n = 2, 3, … |
Balmer series |
n 0 = 2 |
|
n = 3, 4, … |
Paschen series |
n 0 = 3 |
|
n = 4, 5, … |
Bracket series |
n 0 = 4 |
|
n = 5, 6, … |
Pfund series |
n 0 = 5 |
|
n = 6, … |
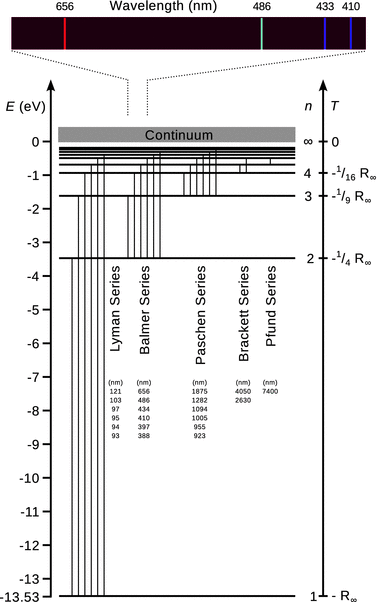
Fig. 8.9
The term scheme of atomic hydrogen
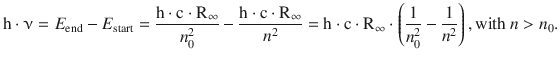
The interpretation of the term scheme was a breakthrough by Niels Bohr in 1913. If Eq. 8.16 is multiplied with (h·c), one obtains:
Since the left side of this equation describes an energy, the same must be true for the right hand side:
(8.17)
The energies E end and E start are correlated with energy levels of the atom. The emitted light observed as the spectral line in the atomic emission spectrum—or similarly, the absorbed light observed as line in the atomic absorption spectrum—is thus the difference of two particular energy levels. Absorption of light of a particular wavelength therefore causes transition of an atom from a lower to a higher energy state. Vice versa, atoms can return from a high to a low energy state by emission of light of a particular wavelength.
A closer look at the wavelengths of the spectral lines in Fig. 8.9 shows that within each of the series, their values are closer together the shorter the wavelengths (i.e. the larger the energy of the absorbed/emitted light) become. For each series, there is thus a shortest wavelength called the series limit. If the energy of light used in an absorption experiment is larger than the energy of the series limit, the incident photon carries so much energy that it ionises the atom when absorbed. Atomic spectroscopy can thus be used to determine the ionisation energy of atoms.
8.2.2 The Hydrogen Model by Bohr
According to Rutherford, atoms should consist of a positively charged nucleus around which electrons orbit in relatively large distances. This idea of atoms having a similar constellation like a solar system was further developed by Bohr. In contrast to planets orbiting a sun based on a gravitational attractive force, the orbiting electrons should be attracted to the nucleus by an electrostatic (i.e. the Coulomb) force. However, according to the macroscopic laws, an orbiting electron should thus be able to assume any energy and orbiting radius, depending on its velocity. A loss of energy would eventually lead to the electron collapsing onto the nucleus. Bohr therefore postulated that the quantisation discovered by Planck should also be applied to the electrons orbiting an atomic nucleus. By combining this quantum mechanical principle with the planet model, individual states of energies for the orbiting electrons are obtained:
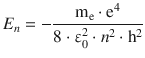
(8.18)
where ε0 = 8.8542·10−12 A2 s4 m−3 kg−1 is the vacuum permittivity. These energy levels depend on particular states characterised by the principal quantum number n:
(8.19)
The jump from a higher (n 2) to a lower (n 1) energy state therefore requires an energy change in the system which is given by:
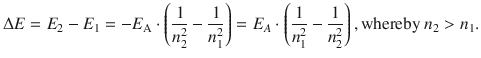
With ΔE = h·ν, this yields:
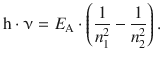
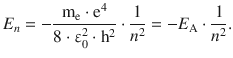
(8.20)
Comparison with Eq. 8.17 shows that the above equation for atomic energy states based on the principal quantum number n is identical with the equation derived for the atomic line spectra. E A is the lowest possible energy of the atom, i.e. the energy of the ground state. It corresponds to the energy of the electron which is orbiting closest to the nucleus (n = 1; see Eq. 8.19). By comparison with Eq. 8.17 it transpires that this energy is linked to the Rydberg constant:

In case of atomic hydrogen, E A is the ionisation energy as it represents the energy that one has to provide to remove the electron from the atom.
Whereas the model developed by Bohr successfully describes spectroscopic observations for single electron species such as atomic hydrogen and similar ions (He+, Li2+), it fails to explain spectra of multi-electron species (He, Li+, …).
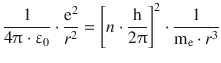
The orbiting radius of an electron in the atomic model by Bohr
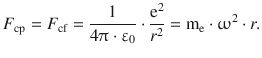
The planet model by Bohr uses the macroscopic laws of mechanics and electrostatics. An object moving around a centre is subject to two forces, the centripetal force F cp and the centrifugal force F cf. The centripetal force in Bohr’s model is provided by the electrostatic attraction between the positively charged nucleus and the negatively charged electron:
![]()
The centrifugal force is a function of the angular velocity ω:
F cf = p ⋅ ω = me ⋅ ω2 ⋅ r, where the momentum is p = me ⋅ ω ⋅ r.
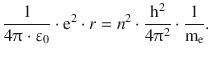
For a stable circular orbit, this yields the requirement:
(8.21)
In order to achieve discrete energy values, Bohr postulated that the angular momentum L is only allowed discrete values, which would then need to be multiples of the quantum of action h:
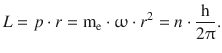
(8.22)
Combining Eqs. 8.21 and 8.22, this yields:
This delivers an expression for the radius of the orbiting electron:
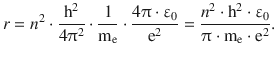
(8.23)
For the electron in the atomic hydrogen, the orbiting radius would thus be:
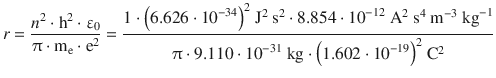
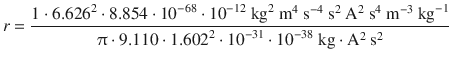
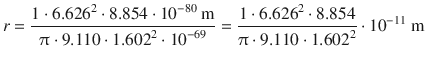
![]()