5 Steps to a 5: AP Macroeconomics 2017 (2016)
STEP 4
Review the Knowledge You Need to Score High
CHAPTER 12
International Trade
IN THIS CHAPTER
Summary: Economists agree on few things, but one of the few unifying themes in economics is that free and fair trade between two nations is mutually beneficial. Chapter 12 begins by reviewing the concept of comparative advantage and gains from trade, and the difference between the domestic and world price of a good. This chapter also revisits the currency exchange markets to illustrate how trade between nations requires the trade of currency and the connection of monetary policy to foreign exchange rates. Lastly, we look at the economic impact of trade barriers.

Key Ideas
![]() Absolute and Comparative Advantage
Absolute and Comparative Advantage
![]() Specialization and Gains from Trade
Specialization and Gains from Trade
![]() Balance of Payments
Balance of Payments
![]() Foreign Exchange
Foreign Exchange
![]() Trade Barriers
Trade Barriers
12.1 Comparative Advantage and Gains from Trade
Main Topics: Comparative and Absolute Advantage; Gains from Trade; Exports, Imports, and the World Price
Chapter 5 of this book introduces, albeit from the microeconomic perspective, the concept of production possibility curves. Comparative advantage and specialization at the microeconomic level explains why brain surgeons do not fly 747s and pilots do not analyze CAT scans. At the macroeconomic level, the law of comparative advantage says that nations can mutually benefit from trade so long as the relative production costs differ.
Comparative and Absolute Advantage
Our discussion of production possibilities illustrated the law of increasing costs. The more an economy produces of any one good, the more costly it becomes to produce the next unit. Rising costs of production lead to a search for less costly ways to produce and consume those goods. In many cases, this search leads to a potential trading partner who has comparative advantage in the production of a good. If Nation ABC can produce a good at lower opportunity cost than can Nation XYZ, it is said that Nation ABC has comparative advantage. An example can illustrate how this works between two states, but the same principle works between two nations.
Example:
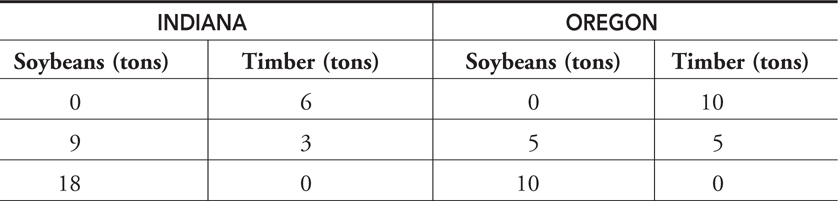
Climate and topography have blessed Indiana with land extremely suitable for the cultivation of soybeans, but with very little harvestable timber. Oregon’s timber production is unmatched, but farmers find it difficult to produce soybean crops that can compare to those grown in Indiana. Table 12.1 summarizes the production possibilities of these two isolated economies. Because Oregon can produce more timber than Indiana, Oregon is said to have an absolute advantage over Indiana in timber production. Indiana has an absolute advantage over Oregon in soybean production. Trade does not rely on absolute advantages, but on comparative advantages.
Table 12.1
Comparative Advantage and Specialization
In isolation, both states can produce soybeans and timber along their production possibility curves or frontiers (PPC or PPF), which are constrained by available technology and resources. Suppose that without trade, they enjoy consuming at the midpoint of the PPC. But if there are differences in production costs, they can each gain from specialization and trade. The opportunity costs of each good can be found from the table and can be illustrated in a production possibility curve for each state:
Oregon:
Opportunity cost of timber is 1 soybean.
Opportunity cost of soybeans is 1 timber.
Indiana:
Opportunity cost of timber is 3 soybeans.
Opportunity cost of soybeans is ⅓ timber.
Since Indiana can produce soybeans at a cost that is lower than Oregon’s cost of soybeans, Indiana has a comparative advantage in soybeans. Oregon can produce timber at a lower cost than Indiana’s cost of timber, so Oregon has a comparative advantage in timber production. With these differences in cost, Indiana should specialize in soybean production (zero timber), while Oregon should specialize in timber production (zero soybeans). Then the two should trade. These specialization points are labeled in Figure 12.1 .
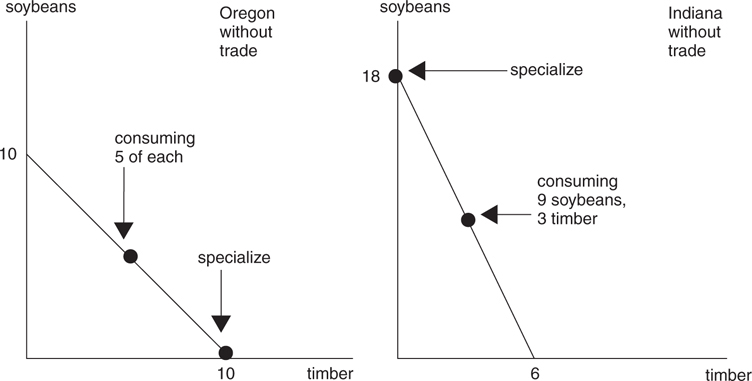
Figure 12.1
Gains from Trade
After each state specializes, suppose that each decides to keep half of its production and send the other half to the other state. See Figure 12.2 .
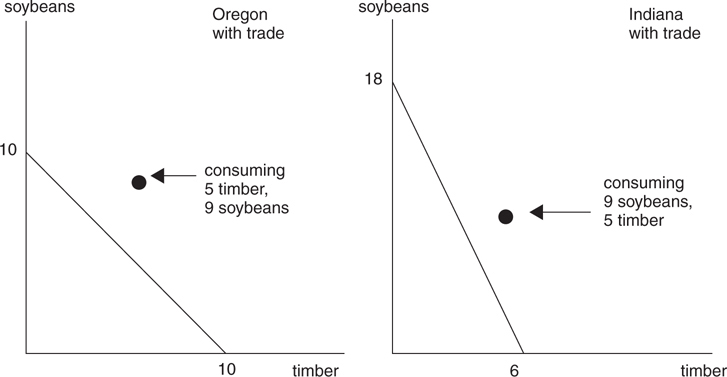
Figure 12.2
Oregon:
Produce 10 timbers and send 5 to Indiana in exchange for 9 soybeans. Cost of a soybean before trade was 1 timber. Now we’re getting 9 soybeans, but only giving up 5 timbers. The cost of giving up 1 timber is now is 5/9, which is less than 1 timber. Great deal!
Indiana:
Produce 18 soybeans, and send 9 to Oregon in exchange for 5 timbers. Cost of a timber before trade was 3 soybeans. Now we’re getting 5 timbers and only giving up 9 soybeans. The cost now is 9/5, which is less than 3 soybeans. Great deal!
Another look at the production possibility curves after the trade shows that each state has actually moved beyond the constraints of their technology and resources.
Consumption Frontier
There are many such trade possibilities. Figure 12.3 overlaps the two production possibility curves. The line that connects Indiana’s specialization of soybeans to Oregon’s specialization of timber is called the consumption possibility frontier because with trade, each state can consume along this line; without trade, these points are impossible to attain.
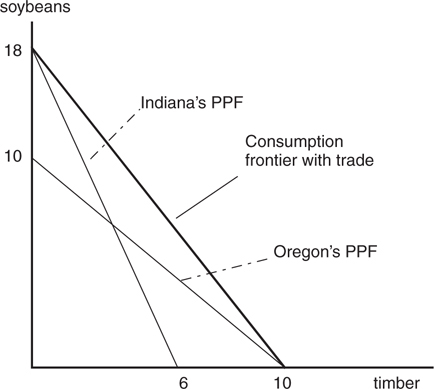
Figure 12.3
“Make sure to draw your graphs BIG on the test so they’re easier to read.”
—Sophia, AP Student

• If the opportunity costs of production are different, two economies find it mutually beneficial to specialize and trade.
• If you have comparative advantage in production of a good, specialize in production of that good and trade for the other.
• Specialization and trade allow nations to consume beyond the PPC.
• Free trade (i.e., without trade barriers) based on comparative advantage allows for a more efficient allocation of resources and greater prosperity for the trading partners than can be achieved without free trade.
Exports, Imports, and the World Price
In the market for a commodity like soybeans, many nations are both producers of soybeans and traders of soybeans. Whether or not a nation is a net exporter or a net importer of soybeans depends upon the difference between the world price with trade and the domestic price without trade.
Domestic Market Without Trade
Figure 12.4 illustrates the competitive U.S. market for soybeans without trade. The (admittedly hypothetical) competitive price of $10 per bushel is found at the intersection of domestic demand and supply. At this point six million bushels are produced.
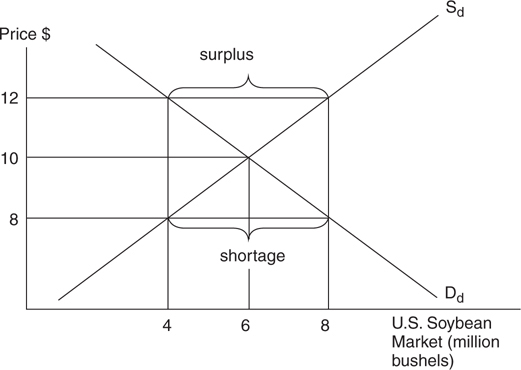
Figure 12.4
World Market with Trade
If the United States begins to trade soybeans with other nations, the world price may rise above, or fall below, $10 per bushel. If the world price falls to $8, there exists a shortage of soybeans in the U.S. market. Domestic producers supply only four million bushels, but domestic consumers demand eight million bushels. The United States must then import the difference of four million bushels. If the world price rises to $12, there exists a four-million bushel surplus in the U.S. market and the United States exports this surplus.
So, to reiterate:
• If the world price of a good is above the domestic price, the nation becomes an exporter of that good.
• If the world price of a good is below the domestic price, the nation becomes an importer of that good.
12.2 Balance of Payments
Main Topic: Balance of Payments Accounts
If Japanese citizens wish to purchase U.S. soybeans, the Japanese must pay in dollars. If U.S. citizens wish to buy Spanish olives, the Americans must pay in euros. Before goods can be exchanged between foreign trading partners, the currency of the importing nation must first be converted to the currency of the exporting nation.
Balance of Payments Accounts
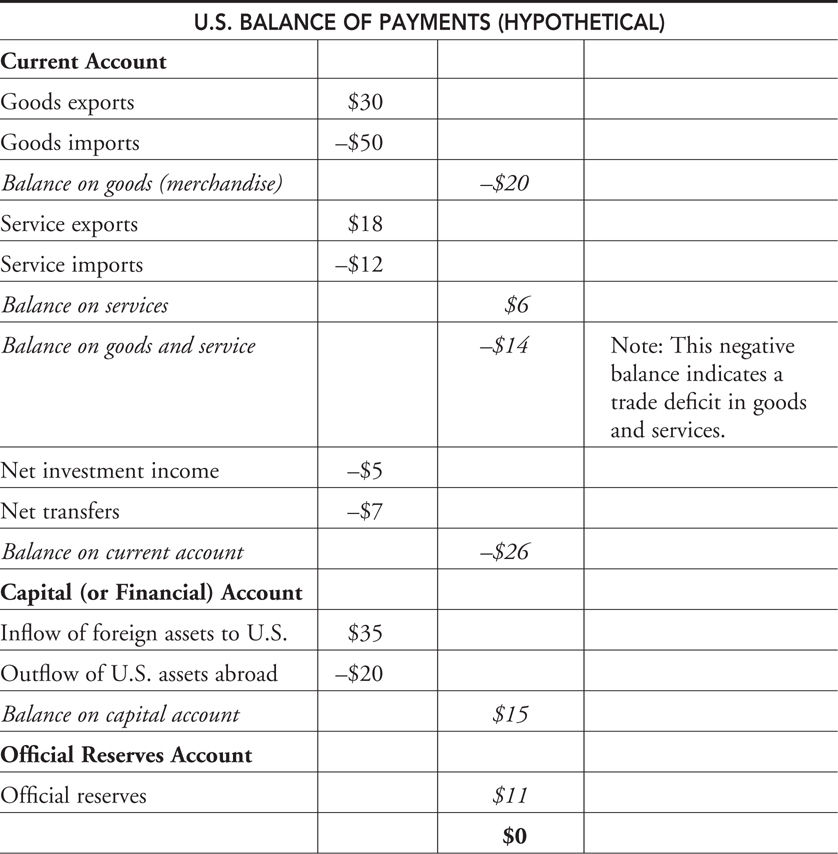
When American citizens and firms exchange goods and services with foreign consumers and firms, payments are sent back and forth through major banks around the world. The Bureau of Economic Analysis tracks the flow of goods and currency in the balance of payments statement . This statement summarizes the payments received by the United States from foreign countries and the payments sent by the United States to foreign countries. Table 12.2summarizes the main components of a hypothetical balance of trade for 2005.
Table 12.2
Current Account
The current account shows current import and export payments of both goods and services. It also reflects investment income sent to foreign investors and investment income received by U.S. citizens who invest abroad. For example, if a Canadian is receiving dividends from an American corporation or interest from a U.S. Treasury bill, these dollars would be sent out of the country. After accounting for all of the payments sent to foreign countries and payments received from foreign countries, the balance on the current account in 2005 was –$26. A deficit balance such as this tells us that the United States sent more American dollars abroad than foreign currency received in current transactions.
Capital (or Financial) Account
When a nation buys a foreign firm, or real estate or financial assets of another nation, it appears in the capital account. For example, if a Swedish firm buys a manufacturing facility in Idaho, or if a Mexican citizen buys a U.S. Treasury bond, it is recorded as an inflow of foreign capital assets into the United States. If an American firm buys a ship-building company in Turkey, it would be an outflow of assets to foreign nations. A surplus balance of $11 tells us that there was more foreign capital investment in the United States than there was U.S. investment abroad.
Official Reserves Account
The Federal Reserve holds quantities of foreign currency called official reserves . When adding the current account and the capital account, if the United States has sent more dollars out than foreign currency has come in, as in the hypothetical example above, there exists a balance of payments deficit . In this case the Fed credits the account so that it balances. This is similar to taking money from your savings account to make up for an over-drafted checking account. If the current and capital account balances are positive, more foreign currency was coming into the United States than American dollars flowed abroad.
With this balance of payments surplus , the Fed transfers the surplus currency back into official reserves.
A Circular Flow of Dollars
With the exception of some statistical discrepancies, the U.S. dollars that Americans send to foreigners are equal to the U.S. dollars that foreigners send to Americans. It is helpful to think of the global circulation of dollars as another example of the circular-flow model. When you buy an imported jacket made in Honduras, this appears in the U.S. current account as a negative entry, because those dollars are leaving the country. However, what will a Honduran jacket producer do with those dollars? American dollars in Honduras are not very useful unless they are being spent on either American-made goods and services or American assets. One way or another, either through the purchase of an American good (like a Ford) or the purchase of an American financial asset (like a share of Ford stock), those dollars will return as a positive entry in either the current or capital account. And while the Federal Reserve will make short-term adjustments to the official reserves account to balance the difference between the current account balance and the capital account balance, in the long-term, dollars that leave the United States will eventually circle back into the United States. Thus, with all else equal, if Americans import more goods and services from abroad, the current account will move in the deficit direction but the capital/financial account will move in the surplus direction as those dollars return.
To summarize:
• U.S. imports require a demand for foreign currency and a supply of U.S. dollars.
• U.S. exports require a supply of foreign currency and a demand for U.S. dollars.
• If Current account balance + Capital account balance < 0, there is a balance of payments deficit.
• If Current account balance + Capital account balance > 0, there is a balance of payments surplus.
12.3 Foreign Exchange Rates
Main Topics: Currency Markets, Appreciating and Depreciating Currency, Changes in Exchange Rates, Connection to Monetary Policy
The previous section of the chapter discussed accounting for the flow of goods and services and currency between trading partners. The foreign exchange market, the topic of the following section, facilitates the importing and exporting of goods around the world.
Currency Markets
When nations trade goods and services, they are implicitly trading currency. The rate of exchange between two currencies is determined in the foreign currency market. Some nations fix their exchange rates, while others are allowed to “float” with the forces of demand and supply. For example, in the flexible exchange market for euros pictured in Figure 12.5 , the equilibrium $2 dollar price of a euro is at the intersection of the supply of euros and the demand. Likewise, in the market for dollars seen in Figure 12.6 , the equilibrium euro price of one dollar is .50 euros. This floating exchange rate has an impact on the balance of payments of both the United States and the European Union.
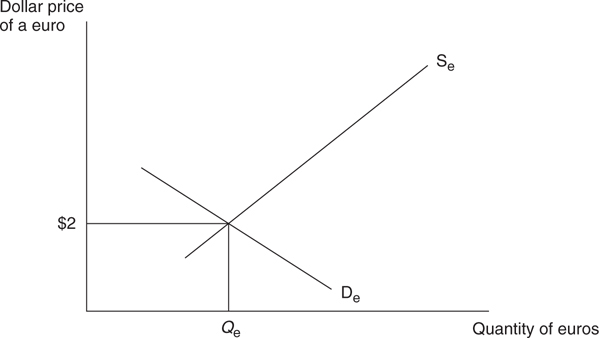
Figure 12.5
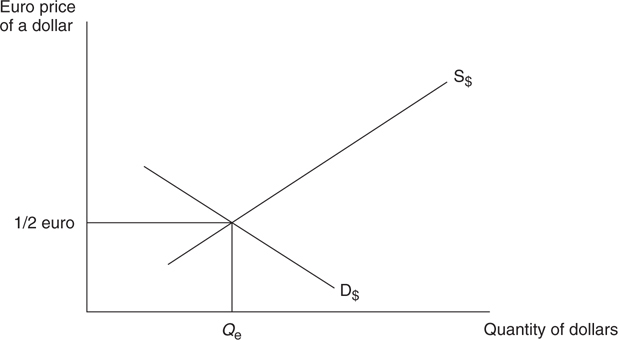
Figure 12.6
So:
• The exchange rate between two currencies tells you how much of one currency you must give up to get one unit of the second currency.
• For example, if $2 = 1 euro, $1 = .5 euro.
• For example, if $1 = 10 pesos, $.10 = 1 peso.
Appreciating and Depreciating Currency
If the U.S. economy is strong, Americans increase their demand for European goods and services. As American consumers increase their demand for the euro, they increase the supply of dollars in the foreign exchange market; the dollar price of a euro rises, and the euro price of a dollar falls. The euro as an asset is appreciating in value, and the dollar as an asset is depreciating in value. The changing value of euros and dollars is seen in Figures 12.7 and 12.8.
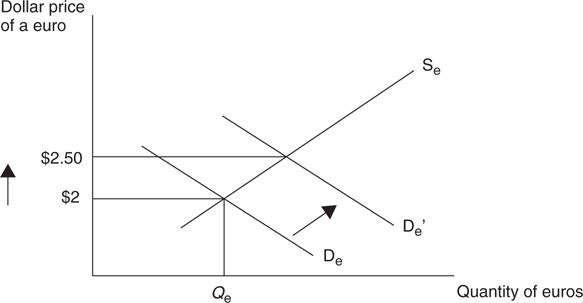
Figure 12.7
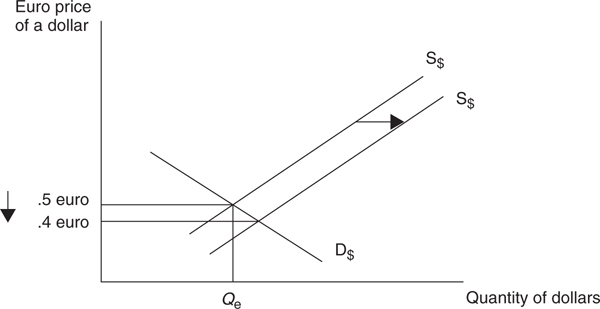
Figure 12.8
“Don’t forget to label your axes.”
—Timot, AP Student
To summarize:
• When the price of a currency is rising, it is said to be appreciating, or “stronger.” More dollars are needed to buy a euro.
• When the price of a currency is falling, it is said to be depreciating, or “weaker.” Fewer euros are needed to buy a dollar.
It is very important to label the axes correctly in a FRQ that asks you to draw the market for a currency. If the market is for the dollar, the x axis should be labeled “Quantity of dollars.” The label on the y axis depends on how the dollar is being priced. If we are pricing dollars in terms of the number of euros it takes to purchase $1, then the correct label is “Euros per dollar” or “Euro price of a dollar” or even “€/$.” You will not earn a graphing point if you call it simply “Price,” “P,” or “$.”
Changes in Exchange Rates
The preceding example illustrates that market forces and changing macroeconomic variables have an impact in the rate of exchange between the dollar and the euro. There are several determinants that affect currency appreciation and depreciation.
Consumer Tastes . When domestic consumers build a stronger preference for foreign-produced goods and services, the demand for those currencies increases and the dollar depreciates. On the other hand, if foreign consumers increase their demand for U.S.-made goods, the dollar appreciates.
Relative Incomes . When one nation’s macroeconomy is strong and incomes are rising, all else equal, they increase their demand for all goods, including those produced abroad. So if Europeans are enjoying economic growth and the United States is in a recession, the relative buying power of European citizens is growing. They increase their consumption of both domestic and U.S.-made goods, increasing demand for the dollar and appreciating its value.
Relative Inflation . If one nation’s price level is rising faster than that of another nation, consumers seek the goods that are relatively less expensive. If European inflation is higher than inflation in the United States, American-made goods are a relative bargain to German consumers and the dollar appreciates. This is another good reason for the Fed to keep inflationary pressure low.
Speculation . Because foreign currencies can be traded as assets, there are investors who seek to profit from buying currency at a low rate and selling it at a higher rate. For example, if it appears that future interest rates will fall in the United States relative to interest rates in Japan, the yen is looking like a good investment. Speculators would then increase their demand for Japanese assets, thus appreciating the yen and depreciating the dollar.
Connection to Monetary Policy
A final variable that affects the price of one currency relative to another is a difference in relative interest rates between nations. When the Fed increases the money supply, the interest rates on American financial assets begin to fall. If the interest rate is relatively lower in the United States, people around the world see U.S. financial assets as less attractive places to put their money. Demand for the dollar falls, and the dollar depreciates relative to other foreign currencies. A depreciating dollar makes goods in the United States less expensive to foreign consumers, so American net exports increase, which shifts the AD to the right.
Likewise, if the Fed decreases the money supply, American interest rates begin to rise and the dollar appreciates relative to foreign currencies. An appreciating dollar makes American goods more expensive to foreign consumers, decreasing American net exports, shifting AD to the left.
Be careful! When interest rates rise, we see a decrease in capital investments (machinery and other equipment) because it becomes more costly to borrow for those projects. But when interest rates rise, we see an increase in financial investments (bonds) because income earned on those bonds is rising.
Again:
• If the Fed ↑ MS, ↓i% , ↓D$, Depreciates the $, ↑ U.S. Net Exports, ↑ AD.
• If the Fed ↓ MS, ↑i% , ↑D$, Appreciates the $, ↓ U.S. Net Exports, ↓ AD.
Pay attention to the relationship between relative interest rates and exchange rates because it has made an appearance on several recent AP Macroeconomics exams.
All else equal, demand for the U.S. dollar increases and the dollar appreciates relative to the euro if:
• European taste for American-made goods is stronger.
• European relative incomes are rising, increasing demand for U.S. goods.
• The U.S. relative price level is falling, making U.S. goods relatively less expensive.
• Speculators are betting on the dollar to rise in value.
• The U.S. relative interest rate is higher, making the United States a relatively more attractive place for financial investments (i.e., bonds).
12.4 Trade Barriers
Main Topics: Tariffs, Quotas
The issue of free trade is hotly politicized. Proponents usually argue that free trade raises the standard of living in both nations , and most economists agree. Detractors argue that free trade, especially with nations that pay lower wages than those paid to domestic workers, costs domestic jobs in higher-wage nations. The evidence shows that in some industries, job losses have certainly occurred as free trade has become more prevalent. To protect domestic jobs, nations can impose trade barriers. Tariffs and quotas are among the most common of barriers.
Tariffs
In general, there are two types of tariffs. A revenue tariff is an excise tax levied on goods that are not produced in the domestic market. For example, the United States does not produce bananas. If a revenue tariff were levied on bananas, it would not be a serious impediment to trade, and it would raise a little revenue for the government. A protective tariff is an excise tax levied on a good that is produced in the domestic market. Though this tariff also raises revenue, the purpose of this tariff, as the name suggests, is to protect the domestic industry from global competition by increasing the price of foreign products.
Example:
The domestic supply and demand for steel is pictured in Figure 12.9 . The domestic price is $100 per ton and the equilibrium quantity of domestic steel is 10 million tons. Maybe other nations can produce steel at lower cost. As a result, in the competitive world market, the price is $80 per ton. At that price, the United States would demand 12 million tons, but only produce eight million tons and so four million tons are imported . It is important to see that in the competitive (free trade) world market, consumer surplus is maximized and no deadweight loss exists. You can see the consumer surplus as the triangle below the demand curve and above the $80 world price.
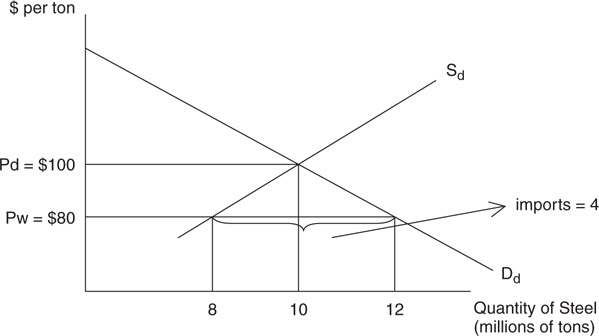
Figure 12.9
If the steel industry is successful in getting a protective tariff passed through Congress, the world price rises by $10, increasing the quantity of domestic steel supplied, reducing the amount of steel imported from four million to two million tons. A higher price and lower consumption reduces the area of consumer surplus and creates deadweight loss.
Economic Effects of the Tariff
• Consumers pay higher prices and consume less steel . If you are building airplanes or door hinges, you have seen an increase in your costs.
• Consumer surplus has been lost .
• Domestic producers increase output . Domestic steel firms are not subject to the tariff, so they can sell more steel at the price of $90 than they could at $80.
• Declining imports . Fewer tons of imported steel arrive in the United States.
• Tariff revenue . The government collects $10 × 2 million = $20 million in tariff revenue, as seen in the shaded box in Figure 12.10 This is a transfer from consumers of steel to the government, not an increase in the total well-being of the nation.
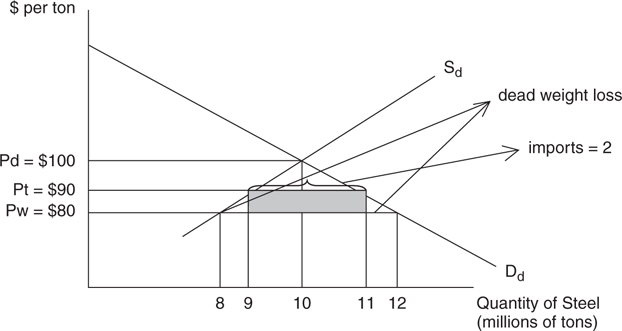
Figure 12.10
• Inefficiency . There was a reason the world price was lower than the domestic price. It was more efficient to produce steel abroad and export it to the United States. By taxing this efficiency, the United States promotes the inefficient domestic industry and stunts the efficient foreign sector. As a result, resources are diverted from the efficient to the inefficient sector.
• Deadweight loss now exists .
Quotas
Quotas work in much the same way as a tariff. An import quota is a maximum amount of a good that can be imported into the domestic market. With a quota, the government only allows two million tons to be imported. Figure 12.11 looks much like Figure 12.10 , only without revenue collected by government. So the impact of the quota, with the exception of the revenue, is the same: higher consumer price and inefficient resource allocation.
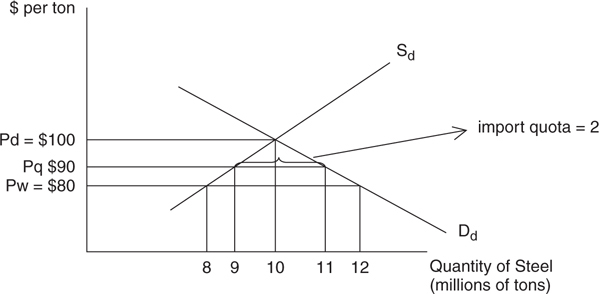
Figure 12.11
“It is important to know the differences between tariffs and quotas.”
—Lucas, AP Student
Tariffs and quotas share many of the same economic effects .
• Both hurt consumers with artificially high prices and lower consumer surplus.
• Both protect inefficient domestic producers at the expense of efficient foreign firms, creating deadweight loss.
• Both reallocate economic resources toward inefficient producers.
• Tariffs collect revenue for the government, while quotas do not.
![]() Review Questions
Review Questions
1 . The United States produces rice in a competitive market. With free trade, the world price is lower than the domestic price. What must be true?
(A) The United States begins to import rice to make up for a domestic shortage.
(B) The United States begins to export rice to make up for a domestic shortage.
(C) The United States begins to import rice to eliminate a domestic surplus.
(D) The United States begins to export rice to eliminate a domestic surplus.
(E) There is no incentive to import or export rice.
2 . If the U.S. dollar and Chinese yuan are traded in flexible currency markets, which of the following causes an appreciation of the dollar relative to the Chinese yuan?
(A) Lower interest rates in the United States relative to China
(B) Lower price levels in China relative to the United States
(C) Growing American preference to consume more Chinese-made goods
(D) Rising per capita GDP in China, increasing imports from the United States
(E) Speculation that the Chinese will decrease the money supply
3 . You hear that the United States has a negative balance in the current account. With this information we conclude that
(A) there is a trade deficit.
(B) there is a capital account deficit.
(C) there is a capital account surplus.
(D) more U.S. dollars are being sent abroad than foreign currencies are being sent to the United States.
(E) there is a trade surplus.
4 . Which of the following is a consequence of a protective tariff on imported steel?
(A) Net exports fall.
(B) Income is transferred from domestic steel consumers to domestic steel producers.
(C) Allocative efficiency is improved.
(D) Income is transferred from domestic steel to foreign steel producers.
(E) Aggregate supply increases.
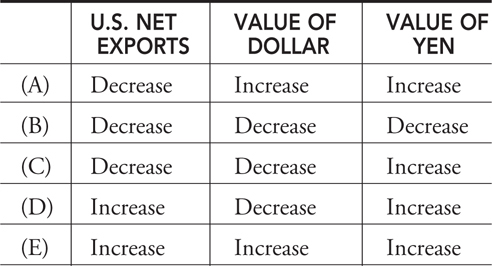
5 . If the Japanese economy suffers a deep, prolonged recession, in what ways would U.S. net exports and the values of the dollar and yen change?
6 . When the United States places an import quota on imported sugar, we expect which of the following effects?
(A) Consumers seek substitutes for sugar and products that use sugar.
(B) Consumers consume more sugar and products that use sugar.
(C) The supply of sugar increases.
(D) Net exports in the United States fall.
(E) The government collects revenue on every ton of imported sugar.
![]() Answers and Explanations
Answers and Explanations
1 . A —If the world price is below the domestic price, a shortage exists in the domestic market. The importation of foreign rice fills this shortage.
2 . D —Higher per capita income in trading nations increases demand for imported goods. The Chinese consumer increases demand for U.S. goods and services and for dollars.
3 . C —When there is a negative balance in the current account, this does not always mean that there is a trade deficit. After all, there is more to the current account than the trade of goods and services. However, when there is a negative balance in the current account, there must be a positive balance (or surplus) in the capital account.
4 . B —Protective tariffs increase the price of steel above the free-trade equilibrium. This higher price is a transfer of money from consumers to domestic producers of steel.
5 . C —When the Japanese economy is suffering, demand for U.S. goods falls, decreasing U.S. net exports and demand for dollars. The dollar depreciates and the yen appreciates.
6 . A —A quota increases the price of sugar so consumers seek substitutes. We may see rising demand for sugar-free gum or falling demand for rich desserts.
![]() Rapid Review
Rapid Review
Domestic price: The equilibrium price of a good in a nation without trade.
World price: The global equilibrium price of a good when nations engage in trade.
Balance of payments statement: A summary of the payments received by the United States from foreign countries and the payments sent by the United States to foreign countries.
Current account: This account shows current import and export payments of both goods and services and investment income sent to foreign investors of United States and investment income received by U.S. citizens who invest abroad.
Capital (or financial) account: This account shows the flow of investment on real or financial assets between a nation and foreigners.
Official reserves account: The Fed’s adjustment of a deficit or surplus in the current and capital account by the addition or subtraction of foreign currencies so that the balance of payments is zero.
Exchange rate: The price of one currency in terms of a second currency.
Appreciating (depreciating) currency: When the value of a currency is rising (falling) relative to another currency, it is said to be appreciating (depreciating).
Determinants of exchange rates: External factors that increase the price of one currency relative to another.
Revenue tariff: An excise tax levied on goods not produced in the domestic market.
Protective tariff: An excise tax levied on a good that is produced in the domestic market so that it may be protected from foreign competition.
Import quota: A limitation on the amount of a good that can be imported into the domestic market.