5 Steps to a 5: AP Macroeconomics 2017 (2016)
STEP 4
Review the Knowledge You Need to Score High
CHAPTER 5 Fundamentals of Economic Analysis
CHAPTER 6 Demand, Supply, Market Equilibrium, and Welfare Analysis
CHAPTER 7 Macroeconomic Measures of Performance
CHAPTER 8 Consumption, Saving, Investment, and the Multiplier
CHAPTER 9 Aggregate Demand and Aggregate Supply
CHAPTER 10 Fiscal Policy, Economic Growth, and Productivity
CHAPTER 11 Money, Banking, and Monetary Policy
CHAPTER 12 International Trade
CHAPTER 5
Fundamentals of Economic Analysis
IN THIS CHAPTER
Summary: If there are two concepts that you should have down pat, they are: (1) scarce resources require decision makers to make decisions that involve costs and benefits, and (2) these decisions are best made when the additional benefits of the action are exactly offset by the additional costs of the action. This chapter presents material that, at least on the surface, appears to be “Econ-lite.” Some readers might make the mistake of simply glossing over it on the way to meatier topics. I urge you to take the time to reinforce these early concepts, for they should, like a bad commercial jingle, stick in your subconscious throughout your preparation for the AP exam.

Key Ideas
![]() Scarcity
Scarcity
![]() Opportunity Cost
Opportunity Cost
![]() Marginal Analysis
Marginal Analysis
![]() Production Possibilities
Production Possibilities
![]() Functions of Economic Systems
Functions of Economic Systems
5.1 Scarce Resources
Main Topics: Economic Resources, Scarcity, Trade-Offs, Opportunity Cost, Marginal Analysis
Economic Resources
Economics is the study of how people, firms, and societies use their scarce productive resources to best satisfy their unlimited material wants. Resources, or Factors of Production, are commonly separated into four groups:

• Labor . Human effort and talent, physical and mental. This can be augmented by education and training (human capital).
• Land or natural resources . Any resource created by nature. This may be arable land, mineral deposits, oil and gas reserves, or water.
• Physical capital . Manmade equipment like machinery, but also buildings, roads, vehicles, and computers.
• Entrepreneurial ability . The effort and know-how to put the other resources together in a productive venture.
Scarcity
All of the above resources are scarce, or in limited supply. Since productive resources are scarce, it makes sense that the production of goods and services must be scarce.
Example:
Sometimes it is easier to see this if you look at the production of something familiar, like the production of a term paper.
• Labor . Your hours of research, writing, and rewriting. As we all know, these hours are scarce, or limited to the number of waking hours in the day.
• Land/natural resources . Paper (trees) and electricity (rivers, coal, natural gas, wind, solar). Not only are these in scarce supply, but your ability to acquire these resources is limited by your income, which is a result of using some of your scarce labor hours to work for a wage.
• Capital . Your computer, printer, desk, pens and pencils, the library and sources within.
• Entrepreneurial ability . The skill that it takes to compile the research into a coherent, thoughtful, and articulate piece of academic work.
Trade-Offs
The fact that we are faced with scarce resources implies that individuals, firms, and governments are constantly faced with trade-offs.
Individuals
Consumers choose between housing arrangements (Do I rent an apartment or buy a home?), transportation options, grocery store items, and many other daily purchases. Workers and students must choose from a wide range of employment and education opportunities. (Do I pick up an extra shift? Do I pursue my MBA or Ph.D.?)
Firms
For the firm, decisions are often centered upon which good or service can be provided, how much should be produced, and how to go about producing those goods and services. A local restaurant considers whether or not to stay open later on Saturday night. A steel company must decide whether to open a plant in Indiana or in Indonesia.
Governments
Every society, in one form or another, places many tough decisions in the hands of government, both local and national. Not surprisingly, local government is faced with issues that are likely to have an immediate impact on the lives of local citizens. (Should we use tax revenues to pave potholes in the streets or buy a new city bus?) At the national level, not all citizens might/would feel the impact immediately, but the stakes are likely much higher. (Should we open protected wilderness areas to oil and gas exploration? Should we impose a tariff on imported rice?)
Regardless of the decision maker—individual, firm, or government—the reality of scarce resources creates a trade-off between the opportunity that is taken and the opportunity that was not taken and thus forgone. The value of what was given up is called the opportunity cost .
Opportunity Cost
At the most basic level, the opportunity cost of doing something is what you sacrifice to do it. In other words, if you use a scarce resource to pursue activity X, the opportunity cost of activity X is activity Y, the next best use of that resource.
Example:
You have one scarce hour to spend between studying for an exam or working at a coffee shop for $8 per hour. If you study, the opportunity cost of studying is $8.
Example:
You have one scarce hour to spend between studying for an exam or working at a coffee shop for $8 per hour or mowing your uncle’s lawn for $10 per hour. If you choose to study, what is the opportunity cost of studying?
“Pay close attention here; this is a very common mistake.”
—Hillary, AP Student
Be careful! A common mistake is to add up the value of all of your other options ($18), but this misses an important point. In this scenario, and in many others, you have one hour to allocate to one activity, thus giving up the others. By choosing to study, you really only gave up one thing: mowing the lawn or serving cappuccinos, not both.
The opportunity cost of using your resource to do activity X is the value the resource would have in its next best alternative use . Therefore, the opportunity cost of studying is $10, the better of your two alternatives.
At this point, you might be wondering, “Does everything have a dollar figure attached to it? Can’t we just enjoy something without slapping a price tag on it?”
This is an excellent question, and the concept can often be a difficult point to make. If you have one scarce hour and you could either work at the coffee shop for $8 or take a restful nap, the opportunity cost of working is the nap, which certainly has value. How can we place a dollar value on the nap? Maybe you are giving serious thought to taking the nap, but your employer at the coffee shop really needs you to work. Maybe your employer offers you $10 to forgo the nap and come to work. After some consideration, you still choose the nap. Surely there is a price (the wage) that would be high enough to entice you to come to work at the coffee shop. If your employer offered you just enough to compensate you for the nap you gave up, you have found the value that you placed on the nap.
Marginal Analysis
Most decisions are made based upon a change in the status quo. You have one cup of coffee (the status quo) and are deciding whether to have another. You have studied five hours for an economics exam (the status quo) and need to decide if it is in your best interest to study another hour.
These decisions are said to be made at the margin. The next cup of coffee brings with it additional (or marginal) benefits to the consumer but comes at additional (marginal) costs. The rational consumer weighs the additional benefits against the additional costs.
Marginal analysis. This is a concept that is seen throughout economics, and throughout this book, but let’s briefly look at it from a consumer’s point of view.
Marginal cost (MC). The additional cost incurred from the consumption of the next unit of a good or service.
Marginal benefit (MB). The additional benefit received from the consumption of the next unit of a good or service. Another way of measuring marginal benefit is to ask yourself, “How much would I pay for the next unit of this good?”
Example:
The soda machine down the hall charges me $1.00 for every can of pop. The decision to buy another soda is another example of marginal analysis. If I expect to receive at least $1 in additional benefit, or if I am willing to pay $1 or more to have it, buying another soda is a rational decision. This decision is shown in Figure 5.1 .
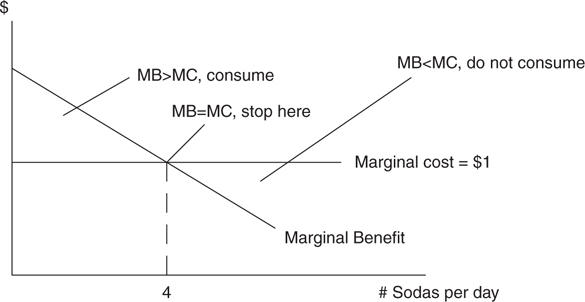
Figure 5.1
So how many sodas will I consume in a typical day? For each of the first three sodas, my MB > $1, the marginal cost of the next soda. The fourth soda provides me with exactly $1 in marginal benefit, so I find it exactly worth my while to buy it. The fifth soda is not bought because the MC > MB. Notice that my MB declines as I consume more sodas. This is a fairly predictable relationship, since I am likely to enjoy my first soda of the day more than my fifth.
Rule:
Do something if the marginal benefits ≥ marginal costs of doing it.
Stop doing something when the marginal benefits = marginal costs of doing it.
Never do something when the marginal benefits < marginal costs of doing it.
You will find this to be true in consumption, production, hiring, and many other economic decisions.
5.2 Production Possibilities
Main Topics: Production Possibilities Curve, Resource Substitutability, Law of Increasing Costs, Comparative Advantage and Specialization, Efficiency, Growth
Production Possibilities Curve
To examine production and opportunity cost, economists find it useful to create a simplified model of an individual, or a nation, that can choose to allocate its scarce resources between the production of two goods or services. For now we assume that those resources are being fully employed and used efficiently.
Example:
The owner of a small bakery can allocate a fixed amount of labor (the chef and her helpers), capital (mixers, pans, and ovens), natural resources (raw materials), and her entrepreneurial talent toward the production of pastries and pizza crusts.
The production possibilities table (Table 5.1 ) lists the different combinations of pastries and crusts that can be produced with a fixed quantity of scarce resources.
Table 5.1
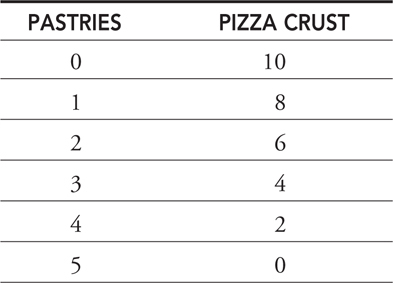
If the chef wishes to produce one more pastry, she must give up two pizza crusts. If she wishes one more crust, she must give up one-half of a pastry.
In other words:
The opportunity cost of a pastry is two crusts.
The opportunity cost of a pizza crust is one-half of a pastry.
We can graphically depict Table 5.1 in a production possibility curve. Each point on the curve represents some maximum output combination of the two products. Some refer to this curve as a production possibility frontierbecause it reflects the outer limit of production. Any point outside the frontier (e.g., 4, 8) is currently unattainable, and any point inside the frontier (e.g., 1, 2) fails to use all of the bakery’s available resources in an efficient way. We talk more about efficiency at the end of this section.
So here you might wonder, “Why is there a limit to the production of these goods? In other words, why doesn’t the frontier just expand to allow an unlimited amount of either?”
Over the course of time, the frontier is believed to expand. But at any given point in time, we must confront the scarcity problem again. The resources used to produce these goods are scarce, and thus the production frontier is going to act as a binding constraint. The concept of economic growth is introduced in this chapter and also discussed in Chapter 10 , but for the time being, the frontier looks like Figure 5.2 .
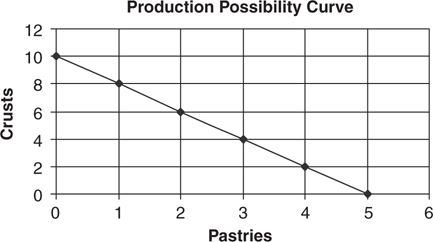
Figure 5.2
The opportunity cost of each good is also apparent in the production possibility curve itself. We ignore the fact that the curve slopes downward and simply focus on its magnitude, or absolute value.
• The slope of the curve, 2 in our case, measures the opportunity cost of the good on the x -axis.
• The inverse of the slope, ½ in our case, measures the opportunity cost of the good on the y -axis.
Notice that with a straight line, the opportunity cost of producing more of each good is always a constant. Is this realistic?
Resource Substitutability
Suppose our bakery chef is currently producing 10 pizza crusts and zero pastries. But today she decides that she should produce one pastry and eight crusts. In Figure 5.2 , this decision appears fairly straightforward.
What we often forget is that resources must be reallocated from pizza crust production to pastry production. Labor, capital, and natural resources must be removed from crust production and moved into pastry production.
Perhaps some of the capital (i.e., pans) in the bakery are better suited to pizza crust production than pastry production. Certainly raw materials like chocolate and frosting are not very useful for pizza crust production, but extremely valuable to the pastry production. The same could be said for individual laborers. Maybe the entrepreneur herself was trained as a French pastry chef and can make pizza crusts, but not as well as she can make éclairs. The fact that these resources are better suited to the production of one good, and less easily adaptable to the production of the other good, gives us the concept of …
Law of Increasing Costs
Law of increasing costs tells us that the more of a good that is produced, the greater its opportunity cost. This reality gives us a production possibility curve that is concave to the origin, or bowed outward , as shown in Figure 5.3 .
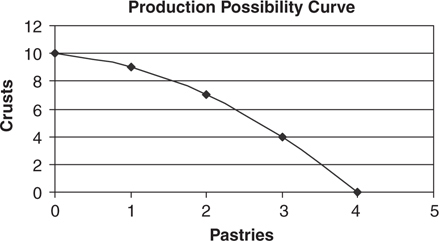
Figure 5.3
Now as the bakery produces more pastries, the opportunity cost (slope) begins to rise. Of course, the same is happening if the chef chooses to produce more crusts.
• Because resources are not perfectly adaptable to alternative uses, our production possibility curve is unlikely to be linear and will probably become steeper as production moves downward along the curve.
Comparative Advantage and Specialization
I went to the dentist’s office the other day. For 30 minutes the dental hygienist took an x-ray and then cleaned and flossed my teeth. When she was done, the dentist popped in, peeked at her handiwork, studied my x-ray, and sent me on my way with a new toothbrush. Why did my dentist let the hygienist do all the cleaning and flossing when he is perfectly capable of doing the task? Because the dentist’s scarce time resource is better used performing tasks like oral surgery. The opportunity cost of the dentist flossing my teeth is the revenue earned from a procedure that only he is qualified to perform. Forgoing the revenue from the oral surgery is avoided by assigning the cleaning tasks to the hygienist, whose specialty is oral hygiene, but not oral surgery.
The law of increasing costs tells us that it becomes more costly to produce a good as you produce more of it. This reality prompts us to find other, less expensive ways to get our hands on additional units. The concepts of specialization and comparative advantage describe the way that individuals, nations, and societies can acquire more goods at lower cost.
Example:
Suppose our bakery, which can produce both pizza crusts and pastries, shares the local market with a pizza parlor. The pizza parlor can also produce pastries, but it might rather produce pizza crusts. Each firm would like to produce more goods at lower cost. Table 5.2 shows the production possibilities of these two firms and the opportunity costs of producing more of each good.
Table 5.2
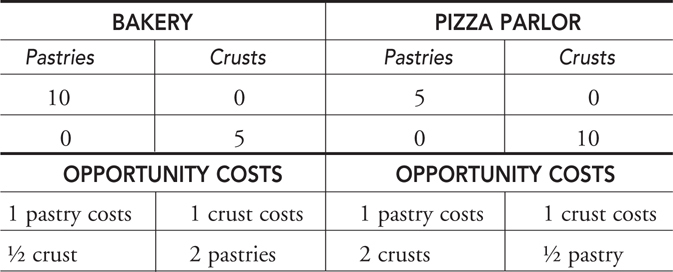
Because the bakery can produce more pastries than the pizza parlor, the bakery has absolute advantage in pastry production. The pizza parlor has absolute advantage in crust production. Simply being able to produce more of a good does not mean that the firm produces that good at a lower opportunity cost.
Both producers could produce pastries, but the bakery can produce pastries at lower opportunity cost (0.5 crusts versus 2 crusts). The bakery is said to have comparative advantage in the production of pastries. Likewise, the table illustrates that the pizza parlor has the comparative advantage in pizza crusts (0.5 pastries versus 2 pastries). These producers can, and indeed should, specialize by producing only pastries at the bakery and only crusts at the pizza parlor. Because these firms are specializing and producing at lower cost, not only do they benefit by earning more profit, but consumers across town benefit from purchasing goods at lower prices.
In microeconomics, the principle of comparative advantage explains why the pediatrician delivers the babies while the electrician wires the house, and not the other way around. In macroeconomics, this principle is the basis for showing how nations can gain from free trade. We explore trade among nations in the last chapter. To see the microeconomics gains from specialization, we do a game called “before and after.”
Before . Each firm devotes half of its resources to pastry production and half to crust production.
Total citywide pastry production = 5 + 2.5 = 7.5
Total citywide crust production = 2.5 + 5 = 7.5
After . Each firm specializes in the production of the good for which it has comparative advantage.
“Know the different ways of showing comparative advantage. This is a potential free-response question.”
—AP Teacher
Total citywide pastry production = 10 + 0 = 10
Total citywide crust production = 0 + 10 = 10
Figure 5.4 shows both production possibility frontiers and how a combination of 10 crusts and 10 pastries (specialization) was previously unattainable and is superior to when each firm produced at the midpoint (50/50) of their individual frontiers.
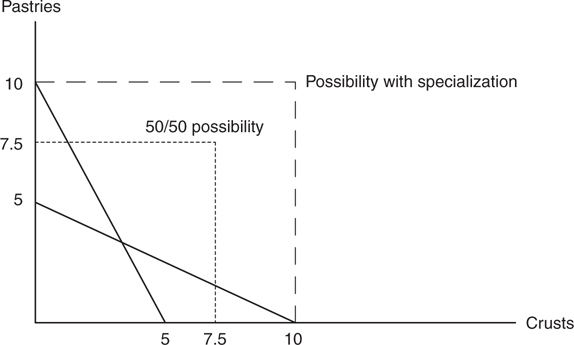
Figure 5.4
• If firms and individuals produce goods based upon their comparative advantage, society gains more production at lower cost.
Efficiency
If not all available resources are being used to their fullest, the economy is operating at some point inside the production possibility frontier. This is clearly inefficient. But even if the economy is operating at some point on the frontier, who is to say that it is the point that is most desired by the citizens? If it does not happen to be the point that society most wants, we are also facing an inefficient situation.
In this production possibility model, there are two types of efficiency:
Productive efficiency. The economy is producing the maximum output for a given level of technology and resources. All points on the production frontier are productively efficient.
Allocative efficiency. The economy is producing the optimal mix of goods and services. By optimal, we mean that it is the combination of goods and services that provides the most net benefit to society. If society is allocatively efficient, it is operating at the best point on the frontier.
How do we determine which point is the best point? Remember how I determined the optimal number of sodas to consume every day? Suppose we could measure, societywide, the marginal benefit received from the consumption of pizza crusts. Like my MB for sodas, the societal MB for crusts is falling as more crusts are consumed. We already know that the marginal cost of producing pizza crusts increases. The marginal cost of producing and marginal benefit of consuming more pizza crusts are illustrated in Figure 5.5 .
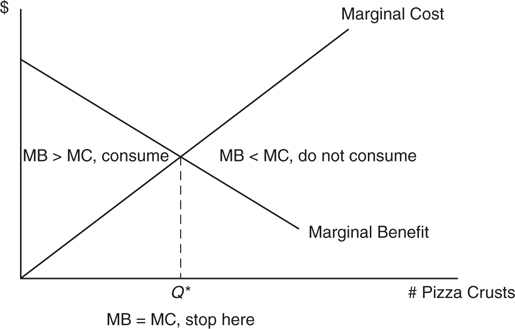
Figure 5.5
The allocatively efficient amount of pizza crusts is Q *, the quantity where the MB of the next crust is exactly equal to the MC of producing it. If we produce anything beyond this point, we have created a situation where the MC of producing it exceeds our marginal enjoyment of it. Clearly we should devote those resources to other goods that we desire to a greater degree, and that are produced at a lower marginal cost.
Growth
At a given point in time, the bakery (or a nation’s economy) cannot operate beyond the production frontier. However, as time passes, it is likely that firms and nations experience economic growth. This results in a production frontier that moves outward, expanding the set of production and consumption. More discussion of growth follows in the macroeconomic section of the review.
Economic growth, the ability to produce a larger total output over time, can occur if one or all of the following occur:
• An increase in the quantity of resources. For example, the bakery acquires another oven.
• An increase in the quality of existing resources. For example, the chef acquires the best assistants in the city.
• Technological advancements in production. For example, electric mixers versus hand mixers.
Figure 5.6 illustrates economic growth for the bakery.
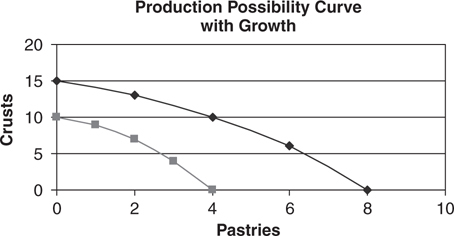
Figure 5.6
Notice that the above frontier has not increased proportionally. The maximum number of crusts that could possibly be produced has increased by 50 percent, while the maximum number of pastries has increased by 100 percent.
Economic growth almost always occurs in this way. For example, technological advancements in wireless technology have certainly increased the nation’s capacity to produce cell phones and tablet computers but has not likely measurably increased our capacity to produce tomatoes.
5.3 Functions of Economic Systems
Main Topic: Market Systems
Market Systems
In the twenty-first century, most industrially advanced nations have gravitated toward a market economy—capitalism.
“This concept, although an easy one, is a definite MC question. Don’t miss it.”
—Adam, AP Student
Keys to a Market System
• Private Property . Individuals, not government, own most economic resources. This private ownership encourages innovation, investment, growth, and trade.
Example:
If the state owned the bakery ovens, mixers, and even the building itself, how much of an incentive would our entrepreneur have to maintain the equipment, the inventory, or even the quality of the product? Knowing that the state could take these resources with very little notice, our chef might just do the bare minimum, and if this situation happened all over town, the local economy would languish.
• Freedom . Individuals are free to acquire resources to produce goods and services, and free to choose which of their resources to sell to others so that they may buy their own goods and services.
Example:
The bakery can freely use its resources to produce rolls, pastries, croissants, and anything else it believes leads to profitability. Of course, this freedom is limited by legal constraints. The bakery cannot sell illegal drugs from the back door, and the chef is not free to offer open-heart surgery with her bagels.
• Self-Interest and Incentives . Individuals are motivated by self-interest in their use of resources. Entrepreneurs seek to maximize profit, while consumers seek to maximize happiness. With these incentives, goods are sold and bought.
Example:
Our bakery owner, motivated by profit, seeks to offer products that appeal to her customers. Customers, seeking to maximize their happiness, consume these bakery products only if they satisfy their personal tastes and wants.
• Competition . Buyers and sellers, acting independently, and motivated by self-interest, freely move in and out of individual markets. Again, the issue of incentives is powerful. A new firm, eager to compete in a market, only enters that market if profits are available.
Example:
Competition implies that prices are determined in the marketplace and not controlled by individual sellers, buyers, or the government. Our bakery owner employs labor at the going market wage, which is determined in the competitive local labor market. She offers baked products at the going price, which is determined in the competitive local market for those goods.
• Prices . Prices send signals to buyers and sellers, and resource allocation decisions are made based upon this information. Prices also serve to ration goods to those consumers who are most willing and able to pay those prices. Prices coordinate the decentralized economic activity of millions of individuals and firms in a way that no one central economic figure can hope to achieve. Prices, not just for goods and services but also for labor and other resources, are the delivery mechanism for the above incentives—profit for the firm and happiness for the consumer.
Example:
As the price of labor, relative to capital, changes, the bakery chef might be motivated to readjust her employment of assistants. Changes in the relative price of her products might prompt consumers to readjust their purchasing decisions.
![]() Review Questions
Review Questions
1 . Economics is best described as
(A) the study of how scarce material wants are allocated between unlimited resources.
(B) the study of how scarce labor can be replaced by unlimited capital.
(C) the study of how decision makers choose the best way to satisfy their unlimited material wants with a scarce supply of resources.
(D) the study of how unlimited material wants can best be satisfied by allocating limitless amounts of productive resources.
(E) the study of how capitalism is superior to any other economic system.
2 . A student decides that, having already spent three hours studying for an exam, she should spend one more hour studying for the same exam. Which of the following is most likely true?
(A) The marginal benefit of the fourth hour is certainly less than the marginal cost of the fourth hour.
(B) The marginal benefit of the fourth hour is at least as great as the marginal cost of the fourth hour.
(C) Without knowing the student’s opportunity cost of studying, we have no way of knowing whether or not her marginal benefits outweigh her marginal costs.
(D) The marginal cost of the third hour was likely greater than the marginal cost of the fourth hour.
(E) The marginal benefit of the third hour was less than the marginal cost of the third hour.
The island nation of Beckham uses economic resources to produce tea and crumpets. Use the following production possibilities frontier for questions 3 to 4.
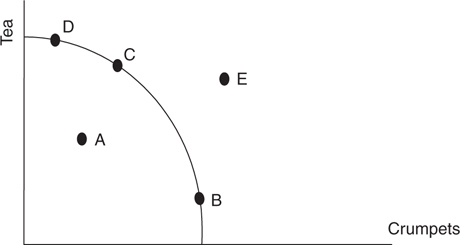
3 . Economic growth is best represented by a movement from
(A) A to B
(B) B to C
(C) C to D
(D) D to E
(E) E to A
4 . The shape of this PPF tells us that
(A) economic resources are perfectly substitutable from production of tea to production of crumpets.
(B) citizens prefer that an equal amount of tea and crumpets be produced.
(C) the opportunity cost of producing crumpets rises as more crumpets are produced.
(D) the opportunity cost of producing crumpets is constant along the curve.
(E) the opportunity cost of producing tea falls as you produce more tea.
5 . Ray and Dorothy can both cook and can both pull weeds in the garden on a Saturday afternoon. For every hour of cooking, Ray can pull 50 weeds and Dorothy can pull 100 weeds. Based on this information,
(A) Ray pulls weeds, since he has absolute advantage in cooking.
(B) Dorothy pulls weeds, since she has absolute advantage in cooking.
(C) Dorothy cooks, since she has comparative advantage in cooking.
(D) Ray cooks, since he has comparative advantage in cooking.
(E) Dorothy pulls weeds, since she has comparative advantage in cooking.
![]() Answers and Explanations
Answers and Explanations
1 . C —It is important to remember that society has a limitless desire for material wants, but satisfaction of these wants is limited by scarce economic resources. Economics studies how to solve this problem in the best possible way.
2 . B —If we observe her studying for the fourth hour, then it must be the case that the MB ≥ MC of studying for that next hour. If we observe her putting her books away and doing something else, the opposite must be true.
3 . D —Economic growth is an outward expansion of the entire PPF. A movement from the interior to the frontier (A to B) is not growth, it just tells us that some unemployed resources (A) are now being used to their full potential (B).
4 . C —When the PPF is concave to the origin (or bowed outward) it is an indicator of the law of increasing costs. This is a result of economic resources not being perfectly substitutable between tea and crumpets. A baking sheet used to bake crumpets might be quite useless in producing tea leaves.
5 . D —For Ray, the opportunity cost of cooking is 50 weeds, while Dorothy’s opportunity cost of cooking is 100 unpulled weeds. Ray does not pull weeds because he has comparative advantage in cooking. Dorothy does not cook because she has comparative advantage in weed pulling.
![]() Rapid Review
Rapid Review
Economics: The study of how people, firms, and societies use their scarce productive resources to best satisfy their unlimited material wants.
Resources: Called factors of production, these are commonly grouped into the four categories of labor, physical capital, land or natural resources, and entrepreneurial ability.
Scarcity: The imbalance between limited productive resources and unlimited human wants. Because economic resources are scarce, the goods and services a society can produce are also scarce.
Trade-offs: Scarce resources imply that individuals, firms, and governments are constantly faced with difficult choices that involve benefits and costs.
Opportunity cost: The value of the sacrifice made to pursue a course of action.
Marginal: The next unit or increment of an action.
Marginal benefit (MB): The additional benefit received from the consumption of the next unit of a good or service.
Marginal cost (MC): The additional cost incurred from the consumption of the next unit of a good or service.
Marginal analysis: Making decisions based upon weighing the marginal benefits and costs of that action. The rational decision maker chooses an action if the MB ≥ MC.
Production possibilities: Different quantities of goods that an economy can produce with a given amount of scarce resources. Graphically, the trade-off between the production of two goods is portrayed as a production possibility curve or frontier (PPC or PPF).
Production possibility curve or frontier (PPC or PPF): A graphical illustration that shows the maximum quantity of one good that can be produced, given the quantity of the other good being produced.
Law of increasing costs: The more of a good that is produced, the greater the opportunity cost of producing the next unit of that good.
Absolute advantage: This exists if a producer can produce more of a good than all other producers.
Comparative advantage: A producer has comparative advantage if he can produce a good at lower opportunity cost than all other producers.
Specialization: When firms focus their resources on production of goods for which they have comparative advantage, they are said to be specializing.
Productive efficiency: Production of maximum output for a given level of technology and resources. All points on the PPF are productively efficient.
Allocative efficiency: Production of the combination of goods and services that provides the most net benefit to society. The optimal quantity of a good is achieved when the MB = MC of the next unit. This only occurs at one point on the PPF.
Economic growth: This occurs when an economy’s production possibilities increase. It can be a result of more resources, better resources, or improvements in technology.
Market economy (capitalism): An economic system based upon the fundamentals of private property, freedom, self-interest, and prices.