5 Steps to a 5: AP Microeconomics 2017 (2016)
STEP 5
Build Your Test-Taking Confidence
AP Microeconomics Practice Exam 1
AP Microeconomics Practice Exam 2
AP Microeconomics Practice Exam 1
Section I: Multiple-Choice Questions
ANSWER SHEET

AP Microeconomics Practice Exam 1, Section I
Multiple-Choice Questions
Time—1 hour and 10 minutes
60 questions
For the multiple-choice questions that follow, select the best answer and fill in the appropriate letter on the answer sheet.
1 . At the birthday party of your best friend, you see Skylar help himself to a second piece of cake. For this individual, it must be the case that
(A) the marginal benefit of the second piece of cake is less than the marginal cost.
(B) the total benefit received from eating cake is falling.
(C) the ratio of marginal benefit over marginal cost is less than one.
(D) the marginal benefit of the second piece of cake is greater than the marginal cost.
(E) Skylar is irrationally consuming too much cake.
2 . Nancy has the choice to spend one hour studying for an exam, mowing the lawn for one hour at a wage of $6, or babysitting her niece for one hour at a wage of $8. If we know that Nancy has chosen to study for the exam, which of the following is true?
(A) The benefit received from studying is greater than the opportunity cost of $8.
(B) The opportunity cost of studying is $14, which is less than the benefit received from studying.
(C) Nancy is indifferent to both studying and mowing the lawn.
(D) Nancy’s behavior is irrational, since babysitting was clearly superior to all other options.
(E) Nancy is indifferent to both babysitting and mowing the lawn.
3 . Suppose the market for roses is currently in equilibrium. If the supply of roses falls, while at the same time the demand for roses rises, what can you say about the price and quantity of roses in the market?
(A) Price and quantity both rise.
(B) Price rises, but the change in quantity is ambiguous.
(C) Price and quantity both fall.
(D) Quantity rises, but the change in price is ambiguous.
(E) Neither price nor quantity change, as these shifts offset one another.
4 . The United States is trading salmon to Peru in exchange for anchovies. If these nations are trading based upon relative opportunity costs, what must be the case?
(A) The United States has comparative advantage in anchovy production, and Peru has comparative advantage in salmon production.
(B) The United States has comparative advantage in salmon production, and Peru has comparative advantage in anchovy production.
(C) The United States has absolute advantage in anchovy production, and Peru has absolute advantage in salmon production.
(D) The United States has absolute advantage in salmon production, and Peru has absolute advantage in anchovy production.
(E) The United States has comparative advantage in salmon production, and Peru has absolute advantage in anchovy production.
5 . Which of the following is the best example of a public good?
(A) Private violin lessons
(B) The volunteer fire department in your community
(C) A $1 ticket for admission to a museum
(D) A bag of potato chips
(E) A history textbook
6 . A typical characteristic of capitalist market economies is
(A) government ownership of land and capital.
(B) extensive price controls.
(C) centralized government decision making to determine production limits.
(D) an absence of scarcity.
(E) private ownership of economic resources.
Questions 7 to 9 refer to the graph below.
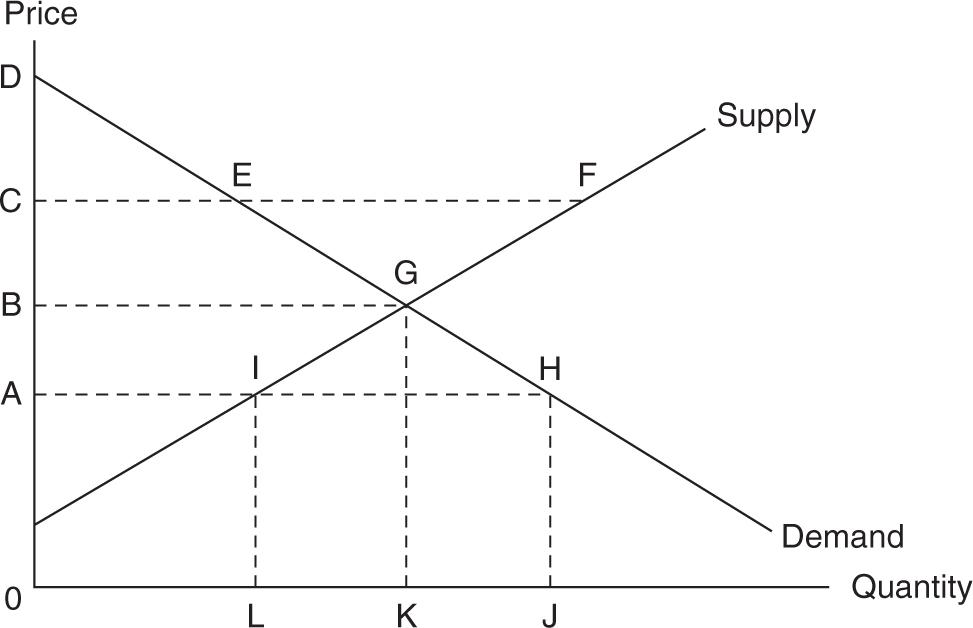
7 . Assuming no government involvement in this market, if the current price were at the level of 0A, we would expect
(A) a surplus in the market to be eliminated by rising prices.
(B) a shortage in the market to be eliminated by falling prices.
(C) a surplus in the market to be eliminated by falling prices.
(D) a shortage in the market to be eliminated by rising prices.
(E) a decrease in quantity supplied and an increase in quantity demanded as the price rises.
8 . If the market is initially in equilibrium, which of the following would create a new equilibrium at point H?
(A) A decrease in consumer income if this good is normal.
(B) An increase in the price of a substitute for this good.
(C) A decrease in the cost of a production input for this good.
(D) An increase in the number of consumers of this good.
(E) An increase in consumer income if this good is normal.
9 . If the price were to rise from 0B to 0C,
(A) dollars spent on this good would increase if demand for the good were price elastic.
(B) dollars spent on this good would decrease if demand for the good were price inelastic.
(C) dollars spent on this good would increase if demand for the good were price inelastic.
(D) dollars spent on this good would increase if demand for the good were unitary price elastic.
(E) dollars spent on this good would decrease if demand for the good were unitary price elastic.
10 . Every day Melanie spends her lunch money consuming apples, at $1 each, and oranges, at $2 each. At her current level of consumption, Melanie’s marginal utility of apples is 12 and her marginal utility of oranges is 18. If she has already spent all of her lunch money, how should Melanie change her consumption decision to maximize utility?
(A) She should make no changes; she is consuming the utility maximizing combination of apples and oranges.
(B) She should increase her apple consumption and decrease her orange consumption until the marginal utility per dollar is equal for both.
(C) She should decrease her apple consumption and increase her orange consumption until the marginal utility per dollar is equal for both.
(D) She should increase her apple consumption and decrease her orange consumption until the marginal utility is equal for both.
(E) She should decrease her apple consumption and increase her orange consumption until the marginal utility is equal for both.
11 . When the production or consumption of a good creates a positive externality, it is deemed a market failure because at the market quantity
(A) the marginal social benefit exceeds the marginal social cost.
(B) the marginal social cost exceeds the marginal social benefit.
(C) society produces too much of the good.
(D) the private benefits from consuming the good exceed the social benefits.
(E) a surplus of the good always exists without government intervention.
12 . Which of the following would best complete a short definition of economics? “Economics is the study of . . .”
(A) how unlimited resources are allocated between scarce wants.
(B) how money is circulated through the economy.
(C) how corporations maximize the share price of their stock.
(D) how nations trade goods and services in a global marketplace.
(E) how scarce resources are allocated to satisfy unlimited wants.
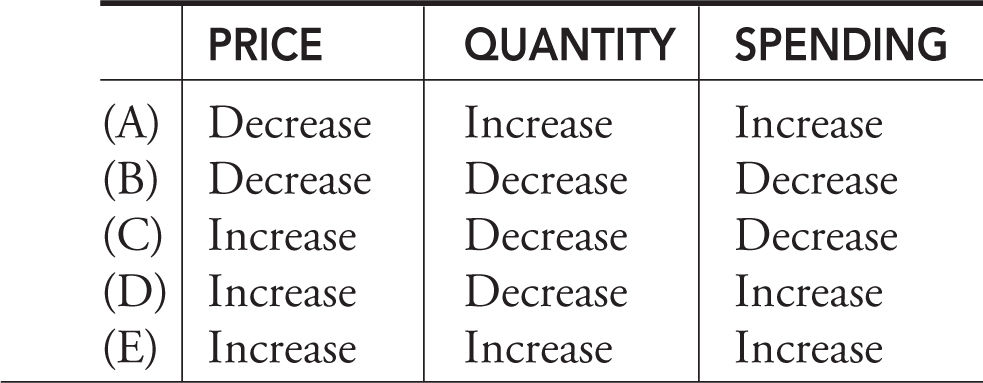
13 . Suppose the price elasticity of demand for cigarettes is less than one. When an excise tax is imposed on cigarette production, it changes the price, quantity, and consumer spending in which of the following ways?
14 . Which of the following is true of a price floor?
(A) The price floor shifts the demand curve to the left.
(B) An effective floor creates a shortage of the good.
(C) The price floor shifts the supply curve of the good to the right.
(D) To be an effective floor, it must be set above the equilibrium price.
(E) The government sets the price floor to assist consumers who are exploited at the equilibrium price.
15 . You are told that the income elasticity for DVDs is + 1.5. This means that
(A) a 10 percent increase in income produces a 15 percent increase in consumption of DVDs. DVDs are a normal luxury good.
(B) a 10 percent increase in income produces a 15 percent increase in consumption of DVDs. DVDs are an inferior good.
(C) a 10 percent increase in income produces a 15 percent decrease in consumption of DVDs. DVDs are an inferior good.
(D) a 10 percent increase in the price of DVDs produces a 15 percent decrease in consumption of DVDs. DVDs are a price elastic good.
(E) a 10 percent increase in the price of DVDs produces a 15 percent decrease in consumption of DVDs. DVDs are a price inelastic good.
16 . Which of the following causes the supply curve of paper to shift to the left?
(A) Paper producers expect lower paper prices in the months ahead.
(B) The price of pencils, a complement to paper, increases.
(C) Improvements in the technology used to produce paper.
(D) Household income falls.
(E) Environmental concerns reduce the yearly amount of timber that can be harvested.
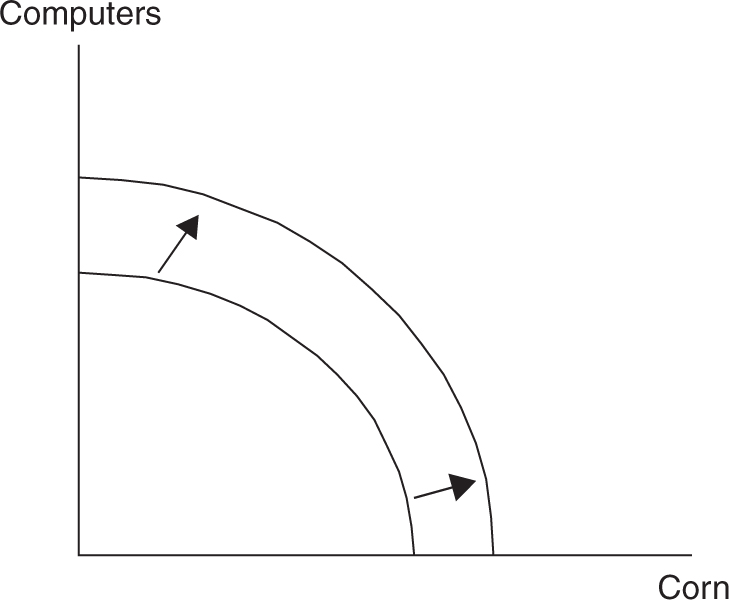
17 . Using the diagram above, which of the following might have caused the outward movement of the production possibility frontier?
(A) A decrease in the availability of fertile farmland
(B) A plague of destructive grasshoppers
(C) An increase in the productivity of the labor force
(D) A severe and long-lasting drought
(E) A decline in the rate of technological improvements
18 . Suppose the county government sends each parent a coupon that can be used to subsidize the cost of sending each child to daycare. What would you expect to occur in the market for daycare services?
(A) The demand for daycare falls, lowering the market price.
(B) The demand for daycare rises, increasing the market price.
(C) The supply of daycare rises, lowering the market price.
(D) The supply of daycare falls, increasing the market price.
(E) A permanent shortage of daycare services exists.
19 . Monopoly deadweight loss is the result of
(A) setting the price above marginal cost.
(B) setting the price above average total cost.
(C) monopoly output being greater than the competitive output.
(D) long-run normal profits.
(E) marginal revenue equaling marginal cost.
20 . The market for Cincinnati Reds baseball tickets is currently in equilibrium. Which of the following events would most likely increase the consumer surplus received by Reds fans?
(A) The Reds offer discounted parking for all home games.
(B) The Reds increase hot dog prices to reflect a higher cost of buns.
(C) The city of Cincinnati is undertaking a huge highway construction project that strands fans in pregame traffic jams for hours.
(D) The Reds must increase ticket prices to afford the most talented players.
(E) Fans must pay a steep service charge in order to purchase tickets online or over the phone.
21 . If Matt’s total utility from consuming bratwurst increased at a constant rate, no matter how many bratwurst Matt consumed, what would Matt’s demand curve for bratwurst look like?
(A) Vertical
(B) Horizontal
(C) Downward sloping
(D) Upward sloping
(E) First upward, but eventually downward sloping
22 . When a firm is earning a normal profit from the production of a good, it is true that
(A) total revenues from production are equal to explicit costs.
(B) explicit costs are equal to implicit costs.
(C) total revenues from production are equal to implicit costs.
(D) total revenues from production are equal to the sum of explicit and implicit costs.
(E) implicit costs are greater than explicit costs.
23 . You are told that the cross-price elasticity between goods X and Y is +2.0. This means that
(A) goods X and Y are normal goods.
(B) goods X and Y are inferior goods.
(C) goods X and Y are complementary goods.
(D) goods X and Y are substitute goods.
(E) good X is twice as elastic as good Y.
24 . Which of the following is an example of a long-run adjustment for the owners of a small café?
(A) The owners switch from whole wheat to sourdough bread.
(B) The owners hire several part-time workers to cover the dinner shifts.
(C) The owners work overtime on a busy weekend.
(D) The owners install more energy-efficient lightbulbs in all of the light fixtures.
(E) The owners buy the office next door, and this doubles the customer seating.
25 . If total product of labor is rising at an increasing rate,
(A) marginal product of labor is rising.
(B) marginal product of labor is at its minimum.
(C) marginal product of labor is at its maximum.
(D) marginal cost is rising.
(E) average product of labor is at its minimum.
26 . The demand curve for a perfectly competitive firm’s product is
(A) downward sloping and equal to the market demand curve.
(B) perfectly elastic.
(C) perfectly inelastic.
(D) “kinked” at the going market price.
(E) the same as the firm’s marginal cost curve.
27 . Which of the following is true in the long run in perfect competition?
(A) P = MR = MC = ATC
(B) P = MR = MC > ATC
(C) P > MR = MC = ATC
(D) P = MR > MC = ATC
(E) P > MR = MC > ATC
28 . If the market price is above the perfectly competitive firm’s average total cost curve, we expect that in the long run,
(A) the industry contracts as firms exit the market.
(B) the industry expands as firms exit the market.
(C) the industry contracts as firms enter the market.
(D) the industry expands as firms enter the market.
(E) the government seeks to regulate the market to ensure efficient outcomes.
29 . If a market is organized by a cartel, we can expect
(A) normal profits for all cartel firms.
(B) an incentive for cartel firms to cheat on the cartel agreement.
(C) profit maximization by individual firms in the cartel.
(D) allocative efficiency.
(E) perfectly competitive prices.
30 . Jason cleans swimming pools in a perfectly competitive local market. A profit maximizer, he can charge $10 per pool to clean 9 pools per day, incurring total variable costs of $80 and total fixed costs of $20. Which of the following is true?
(A) Jason should shut down in the short run, with economic losses of $20.
(B) Jason should shut down in the short run, with economic losses of $10.
(C) Jason should clean 9 pools per day, with economic losses of $20.
(D) Jason should clean 9 pools per day, with economic losses of $10.
(E) Jason should clean 9 pools per day, with economic profits of $10.
31 . Which of the following might explain how a price decrease might cause a decrease in quantity demanded and an upward-sloping demand curve?
(A) The good is inferior and the income effect is stronger than the substitution effect.
(B) The good is normal and the income effect is stronger than the substitution effect.
(C) The good is normal and the income effect is weaker than the substitution effect.
(D) The good is inferior and a luxury.
(E) The good is highly subsidized, creating a large increase in marginal utility per dollar.
32 . For the perfectly competitive firm, the profit-maximizing decision to shut down is made when the price
(A) falls below minimum average total cost.
(B) is greater than minimum average variable cost, but lower than minimum average total cost.
(C) falls below minimum average variable cost.
(D) is equal to minimum average total cost.
(E) is equal to average fixed cost.
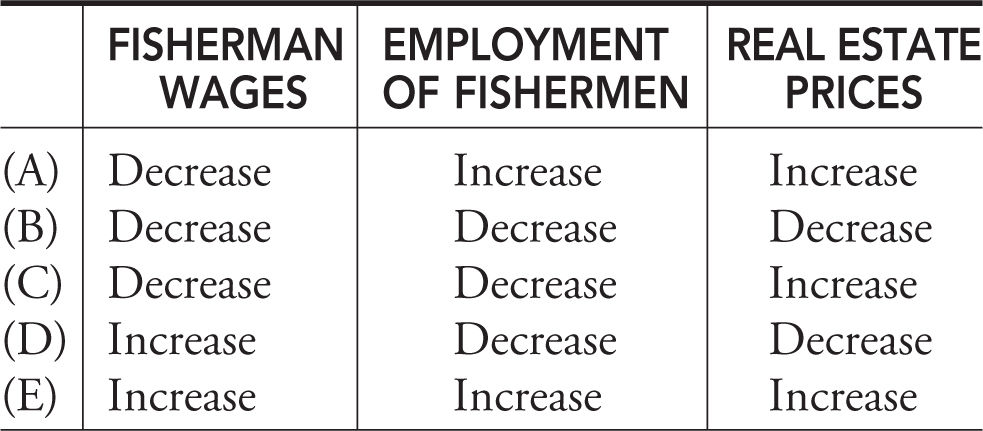
33 . Declining populations of tuna in the Atlantic Ocean have likely had which of the following impacts on the wages of tuna fishermen, the employment of tuna fishermen, and real estate prices in New England fishing towns?
34 . Which of the following is true of monopoly markets?
(A) Deadweight loss exists in the short run, but not in the long run.
(B) A homogenous product allows for long-run entry of competing firms.
(C) Collusion between close rivals creates pricing above marginal cost.
(D) Barriers to entry allow for the power to set prices above marginal cost.
(E) Allocative efficiency is guaranteed because marginal revenue equals marginal cost.
Questions 35 to 36 refer to the graph below.
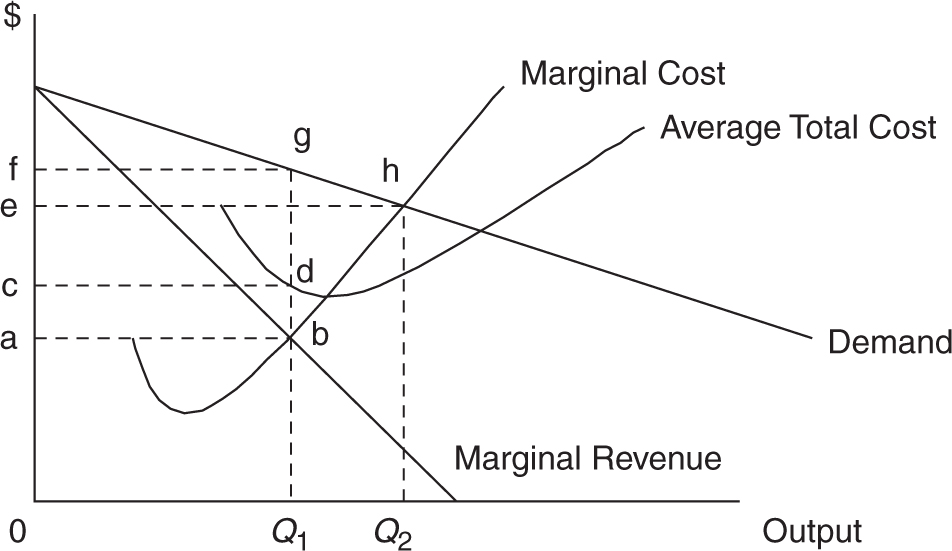
35 . If this firm were a profit-maximizing monopolist, the price and output would be which of the following?
(A) 0a and Q 1
(B) 0c and Q 1
(C) 0e and Q 1
(D) 0e and Q 2
(E) 0f and Q 1
36 . Deadweight loss is equal to which of the following areas?
(A) abcd
(B) cdfg
(C) 0abQ 1
(D) Q 1Q 2gh
(E) bdgh
Two competing firms are deciding whether to enter a new market or maintain the status quo. Use the following profit matrix to respond to question 37.
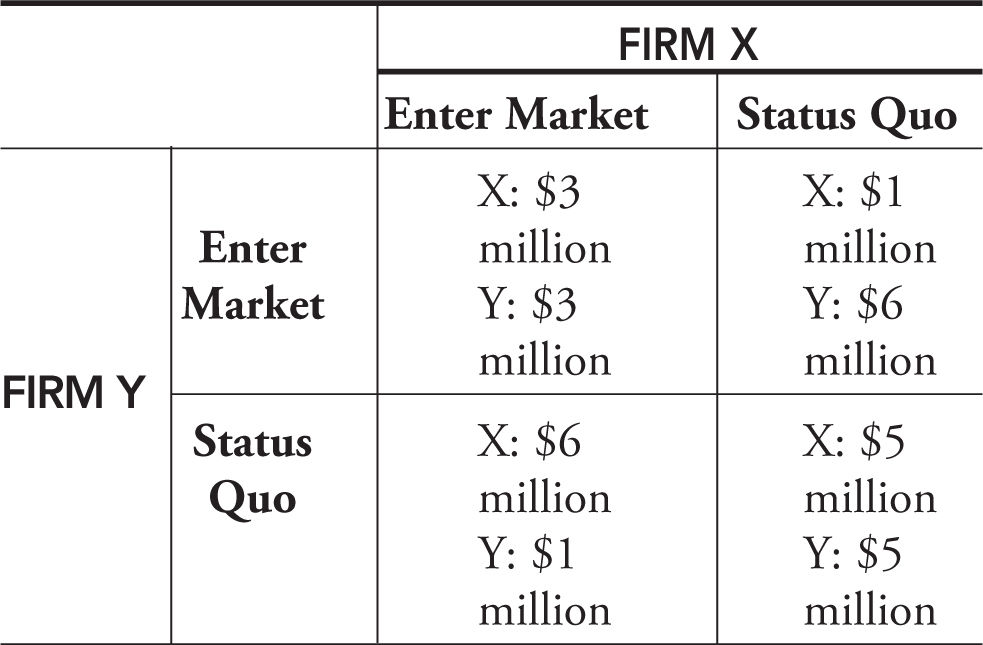
37 . If these firms do not collude, the outcome will be
(A) both firms maintain the status quo.
(B) both firms enter the market.
(C) Firm X enters the market and Firm Y maintains the status quo.
(D) Firm Y enters the market and Firm X maintains the status quo.
(E) both firms alternate between entering the market and maintaining the status quo.
38 . When the marginal product of labor is equal to the average product of labor,
(A) marginal product of labor is at its maximum.
(B) marginal cost of production is at its minimum.
(C) marginal cost is equal to minimum average variable cost.
(D) average total cost is at its minimum.
(E) total product of labor is at its maximum.
Questions 39 to 41 refer to the graph below.
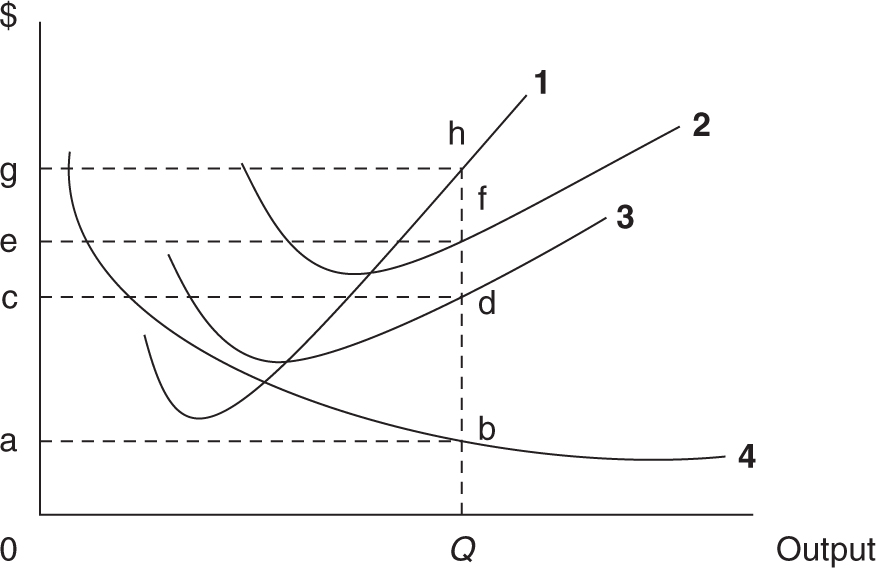
39 . The area 0abQ is equal to
(A) total cost.
(B) total variable cost.
(C) total fixed cost.
(D) marginal cost.
(E) average product of labor.
40 . The curve labeled 1 represents which of the following?
(A) Marginal cost
(B) Marginal product of labor
(C) Average total cost
(D) Average variable cost
(E) Average fixed cost
41 . If this firm was operating in a perfectly competitive market, and the price was equal to 0g, economic profit would be equal to which of the following areas?
(A) abcd
(B) cdgh
(C) cdef
(D) eghf
(E) abgh
42 . Which is true of monopolistic competition?
(A) Firms earn long-run economic profits.
(B) P = MR = MC = ATC.
(C) Firms spend money to differentiate and advertise their products.
(D) In the long run the market is allocatively efficient.
(E) Excess capacity is eliminated in the long run.
43 . If firms are entering an industry that is monopolistically competitive, we would expect
(A) the demand for existing firms to shift rightward.
(B) the market price of the product to increase.
(C) the demand for existing firms to become more inelastic.
(D) economic profits to rise for all firms.
(E) the demand for existing firms to shift leftward.
44 . Monopolistic competition is said to be productively inefficient because
(A) the long-run price is above minimum average total cost.
(B) long-run profits are positive.
(C) firms engage in collusive behavior.
(D) there exist no barriers to entry.
(E) there exist diseconomies of scale.
45 . One of the reasons that the government discourages and regulates monopolies is that
(A) producer surplus is lost and consumer surplus is gained.
(B) monopoly prices ensure productive efficiency but cost society allocative efficiency.
(C) monopoly firms do not engage in significant research and development.
(D) consumer surplus is lost with higher prices and lower levels of output.
(E) lower prices and higher levels of output create deadweight loss.
46 . What is one reason why the government discourages collusion between large firms in the same industry?
(A) Collusive output levels tend to increase, driving the price above competitive levels.
(B) Consumer surplus falls as the price is driven downward.
(C) Collusive output levels tend to decrease, driving the price down to competitive levels.
(D) Joint profit maximization drives profits downward, forcing colluding firms to exit the industry.
(E) Joint profit maximization costs society consumer surplus as the price rises above competitive levels.
47 . In a competitive labor market for housepainters, which of the following would increase the demand for housepainters?
(A) An effective minimum wage imposed on this labor market.
(B) An increase in the price of gallons of paint.
(C) An increase in the construction of new houses.
(D) An increase in the price of mechanical painters so long as the output effect exceeds the substitution effect.
(E) An increase in home mortgage interest rates.
48 . If a monopsony labor market suddenly were transformed into a perfectly competitive labor market, how would the wage and employment change?
(A) Both would increase.
(B) Both would decrease.
(C) The wage would remain constant, but employment would increase.
(D) The wage would fall, but employment would increase.
(E) The wage would rise, but employment would decrease.
49 . Which of the following is most likely to be true in the long run for a monopoly firm?
(A) P = MR = MC = ATC
(B) P = MR = MC > ATC
(C) P > MR = MC = ATC
(D) P = MR > MC = ATC
(E) P > ATC > MR = MC
Questions 50 to 51 refer to the table below, which describes employment and production of a firm.
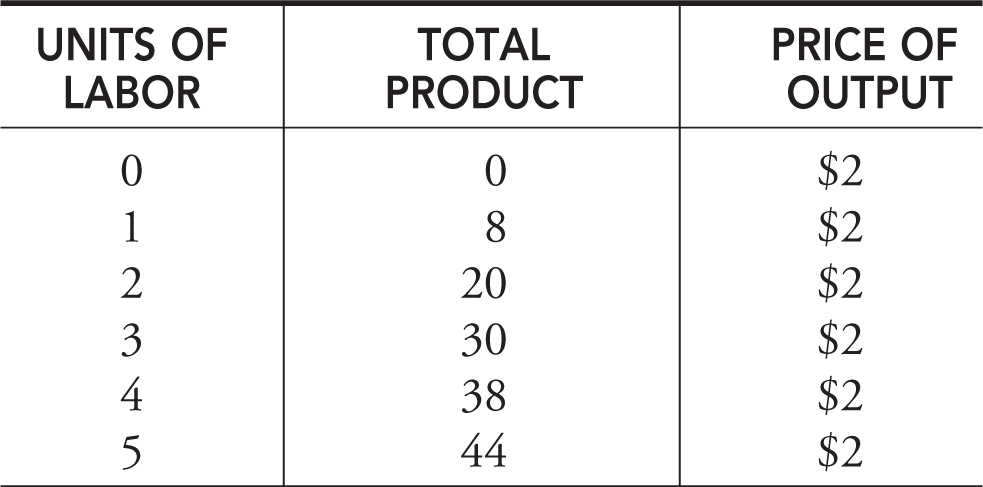
50 . The marginal revenue product of the fourth unit of labor is equal to
(A) $19.
(B) $16.
(C) $8.
(D) $20.
(E) $2.
51 . If the wage paid to all units of labor is $20, how many units of labor are employed?
(A) 1
(B) 2
(C) 3
(D) 4
(E) 5
52 . An industry described as an oligopoly would most likely have
(A) normal profits in the long run.
(B) no opportunities for collusive behavior.
(C) significant barriers to entry.
(D) price-taking behavior.
(E) one firm with no close rivals.
53 . A minimum wage in the market for fast-food workers is likely to produce
(A) an increase in the demand for fast-food workers.
(B) a decrease in the supply of fast-food workers.
(C) a shortage of fast-food workers.
(D) a lower price of fast-food products.
(E) a surplus of fast-food workers.
54 . In order to hire the least-cost combination of labor and capital, the firm must do which of the following?
(A) Find the combination of labor and capital where the marginal product of labor is equal to the marginal product of capital.
(B) Find the combination of labor and capital where the ratio of the marginal product of labor to the marginal product of capital is equal to one.
(C) Find the combination of labor and capital where the marginal product of labor divided by the price of labor is equal to the marginal product of capital divided by the price of capital.
(D) Find the combination of labor and capital where the price of labor is equal to the price of capital.
(E) Find the combination of labor and capital where the marginal revenue product of labor is equal to the marginal revenue product of capital.
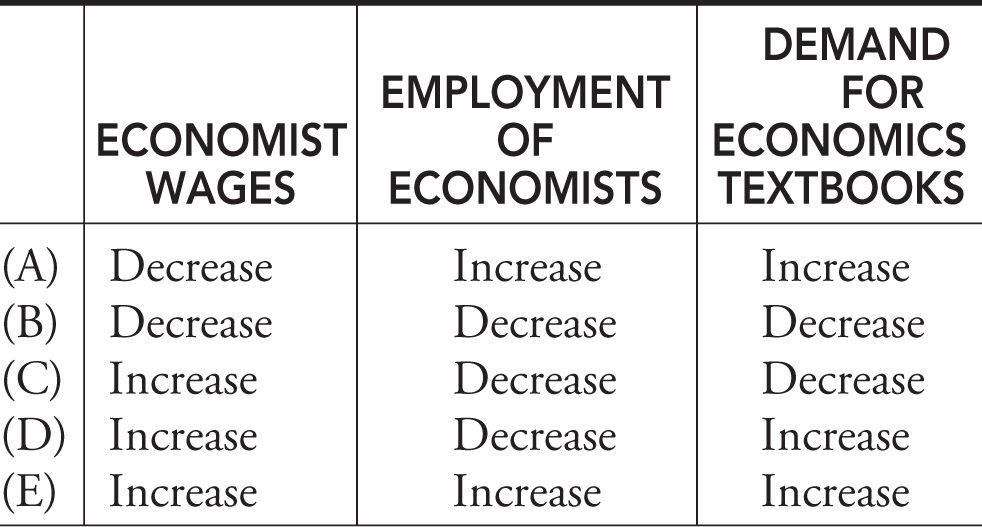
55 . More college students are graduating with BA degrees in economics. Given this trend, we would expect the wage of economists, the employment of economists, and the demand for economics textbooks to change in which of the following ways?
56 . Which of the following is the best example of a negative externality and the appropriate plan for eliminating it?
(A) Air pollution from a factory blows downwind and harms children in a small community. Tax the citizens of the community.
(B) Your neighbor plants a fragrant blooming cherry tree in her front yard. Give a tree subsidy to your neighbor.
(C) The waste from a hog farm pollutes a neighbor’s drinking water. Give a subsidy to the hog farmer.
(D) A cigarette smoker suffers multiple health problems from using tobacco. Tax the cigarettes that he is smoking.
(E) Air pollution from a power plant is blowing downwind and harming the trees in your community. Tax the production of electricity.
57 . A perfectly competitive employer hires labor up to the point where
(A) Wage = Marginal factor cost.
(B) Wage = Marginal product of labor.
(C) Wage = Marginal revenue.
(D) Wage = Marginal revenue product of labor.
(E) Wage = Price of the good produced by the labor.
58 . The sales tax that you pay at the grocery store is commonly labeled a
(A) progressive tax.
(B) regressive tax.
(C) proportional tax.
(D) excise tax.
(E) tax bracket.
59 . Which of the following is the best example of the free-rider effect?
(A) You and a friend take a road trip to Florida in your friend’s car. You pay for the gas.
(B) In exchange for tutoring your friend in economics, she helps you with your geometry assignment.
(C) You have ordered a big college football game on pay-per-view, and several of your buddies show up unannounced to watch it at your place.
(D) You buy your date dinner, but your date insists on leaving a tip for the server.
(E) A local Girl Scout troop is giving a “free” carwash. You give them a $5 donation.
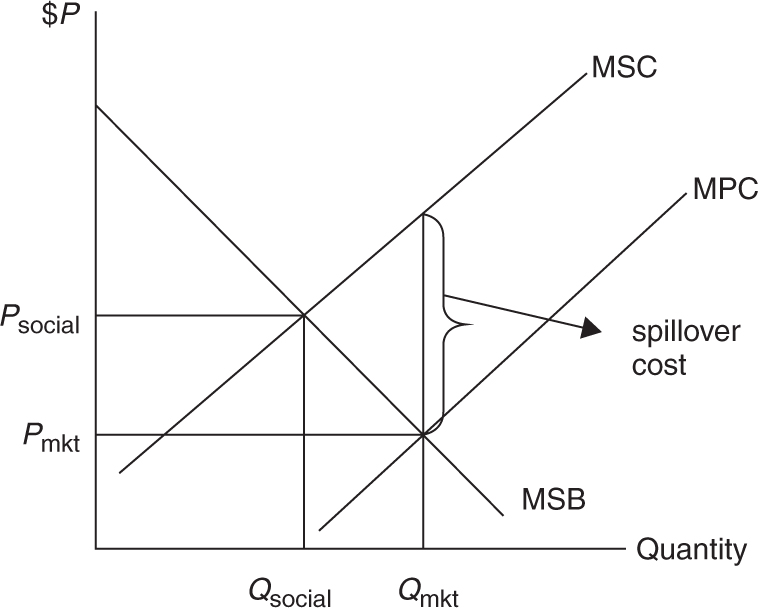
Question 60 refers to the graph below.
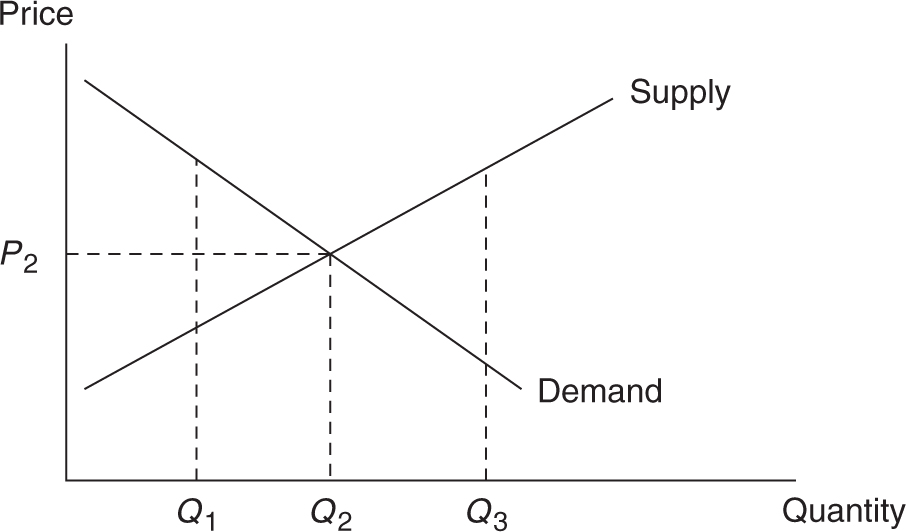
60 . If the market for this good was in equilibrium at Q 2 but the socially optimal output was Q 1, the government could best remedy this —— of resources by legislating a —— on —— of the good.
(A) underallocation, per unit tax, consumers
(B) overallocation, per unit subsidy, consumers
(C) underallocation, per unit tax, producers
(D) overallocation, per unit subsidy, producers
(E) overallocation, per unit tax, producers
![]() Answers and Explanations
Answers and Explanations
1 . D— You have to assume that Skylar evaluated the marginal benefits and marginal costs of the second piece of cake and decided that he should consume it.
2 . A— The opportunity cost is the value of the most attractive alternative; in this case, the babysitting wage.
3 . B— If demand increases and supply decreases, the price definitely rises. The quantity is ambiguous and depends upon which effect is stronger. Draw these shifting curves in the margin of your exam book.
4 . B— Trading nations specialize in the good in which they have lower opportunity costs. A nation trades this good to the other in exchange for the good for which it does not have comparative advantage.
5 . B— Public goods like police and fire protection are received by all citizens, even if they do not pay.
6 . E— The citizens privately own resources in capitalist systems.
7 . D— Prices below equilibrium create shortages, but they do not last.
8 . C— A rightward shift in supply would move the market to point H and lower input prices would do just that.
9 . C— If E d < 1, a given % increase in the price outweighs the % decrease in quantity demanded, thus increasing total dollars spent on the good.
10 . B— The utility maximizing rule requires that MU/P is equal for both goods. Now the MU/P is greater for apples than for oranges. Melanie consumes more apples and fewer oranges, which lowers MU of apples and increases the MU of oranges.
11 . A— Market equilibrium occurs where marginal private benefit equals marginal cost to society. With a positive externality, the MSB > MPB at the market quantity.
12 . E— This is the definition of economics!
13 . D— Excise taxes shift a supply curve leftward, increase price, and decrease quantity. If E d < 1, cigarette consumers spend more on cigarettes.
14 . D— Price floors are legal minimum prices so they are set above equilibrium. A surplus results.
15 . A— When E I > 0, it is a normal good. When E I > 1, it is a luxury good.
16 . E— Restricting the supply of a raw material to paper would increase the price of the production input and decrease the supply of paper.
17 . C— Economic growth is the result of better, or more economic, resources or more technological progress. A more productive labor force increases the PPF for both goods.
18 . B— A subsidy given to consumers acts as an increase in income. Demand for daycare rises, raising the price of daycare.
19 . A— If P = MC, the market is allocatively efficient and there is no deadweight loss. If the monopoly P > MC, DWL emerges.
20 . A— Anything that effectively lowers the price of attending the Reds game increases CS.
21 . B— Downward-sloping demand is the result of diminishing marginal utility. This consumer’s MU is constant, so the demand curve for bratwurst is horizontal.
22 . D— Normal profits are also thought of as breakeven economic profits.
23 . D— If Exy > 0, goods are substitutes.
24 . E— Long-run adjustments change the production capacity of a firm.
25 . A— MPL tells you how TPL is changing when more labor is hired. If more labor is increasing TPL at a faster and faster rate, MPL is rising.
26 . B— Perfectly competitive firms are price takers, so demand for each firm’s product is horizontal: E d = ∞.
27 . A— A defining outcome of long-run equilibrium in perfect competition.
28 . D— If P > ATC, positive short-run economic profits exist. Long-run entry expands the market.
29 . B— Cartels are illegal collusive agreements to lower output, raise the price, and maximize joint profits. Each member has an incentive to cheat by producing a little more.
30 . D— TR > TVC, so Jason does not shut down. Subtracting all costs from TR, he is losing $10 per day.
31 . A— Income and substitution effects work in opposite directions for inferior goods. A lower price prompts a substitution effect, increasing quantity demanded of the good. A lower price increases purchasing power, and for an inferior good, it decreases consumption. If the income effect outweighs the substitution effect, we can see an upward-sloping demand curve.
32 . C— This is the shutdown point.
33 . B— Decreased labor demand lowers wage and employment. Lower incomes and higher unemployment decrease real estate prices.
34 . D— Barriers to entry are the key to monopoly pricing power.
35 . E— Find the output where MR = MC and the price is found vertically at the demand curve.
36 . E— DWL is the area above MC and below the demand curve, between the monopoly output and the perfectly competitive output.
37 . B— Entering is a dominant strategy for both firms.
38 . C— MC and AVC are inverses of MPL and APL . Because MPL = APL at the maximum of APL , MC = AVC at the minimum of AVC.
39 . C— Familiarity with cost curves identifies curve 4 as AFC. The area of this rectangle is Q × AFC = TFC.
40 . A— Quickly recognize this as MC.
41 . D— The profit rectangle is the quantity multiplied by the vertical distance between price and ATC.
42 . C— With product differentiation, monopolistically competitive firms spend money to promote their product as different from the others.
43 . E— Entry of new firms takes market share from existing firms, so demand curves begin to shift to the left.
44 . A— Profits are normal and P = ATC, but unlike perfect competition, P > minimum ATC, so the industry is not productively efficient.
45 . D— Lost CS is a big reason why government keeps an eye on the monopoly power of firms.
46 . E— Colluding members of an oligopoly act as a monopolist, restraining competition, restricting output, and increasing the price.
47 . C— This is the idea of derived demand.
48 . A— Monopsony lowers both wage and employment when compared to the competitive labor market.
49 . E— Like the competitive firm, the monopolist produces where MR = MC, but the P > ATC, which is most likely even further above MR = MC.
50 . B— MRP = MP × P . Calculate MP by looking at the difference in TP as one more unit of labor is hired.
51 . C— Labor is hired to the point where W = MRP, so quickly find the point in the table where MP = 10, which when multiplied by P = $2 gives you MRP = $20.
52 . C— This is a main identifier of oligopoly.
53 . E— Minimum wages are price floors in a labor market. A surplus results.
54 . C— This choice describes the least-cost rule for hiring inputs.
55 . A— Increased labor supply lowers the wage, increases employment, and increases demand for goods that are “tools of the trade.”
56 . E— The appropriate fix to a negative externality is to tax either the producers or the consumers of electricity. The health problems of the smoker are not a negative externality, as the smoker is not a third party. The nonsmoking spouse of the smoker whose health is impaired would be a negative externality.
57 . D— This describes the choice that is made by employers in competitive labor markets.
58 . B— Sales taxes are typical examples of regressive taxes.
59 . C— Free riders receive the benefit of a public good without contributing to its production.
60 . E— If equilibrium output exceeds the socially desirable output, resources are overallocated to production of this good. This negative externality can be fixed with a tax on producers or sometimes on consumers.
AP Microeconomics Practice Exam 1, Section II
Free-Response Questions
Planning time —10 minutes
Writing time —50 minutes
At the conclusion of the planning time, you have 50 minutes to respond to the following three questions. Approximately half of your time should be given to the first question, and the second half should be divided evenly between the remaining two questions. Be careful to clearly explain your reasoning and to provide clear labels to all graph axes and curves.
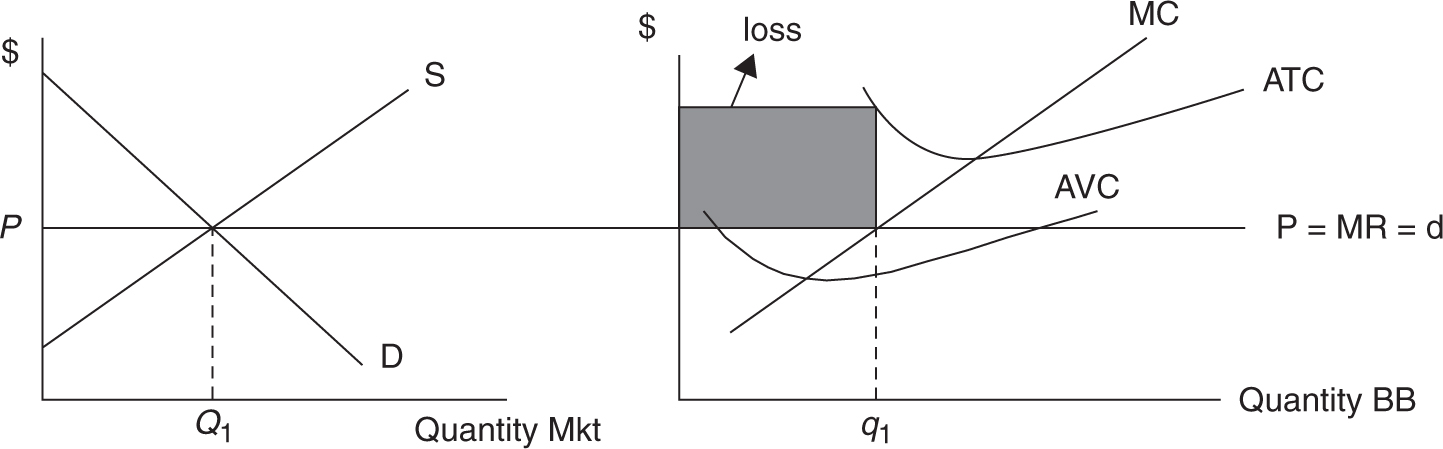
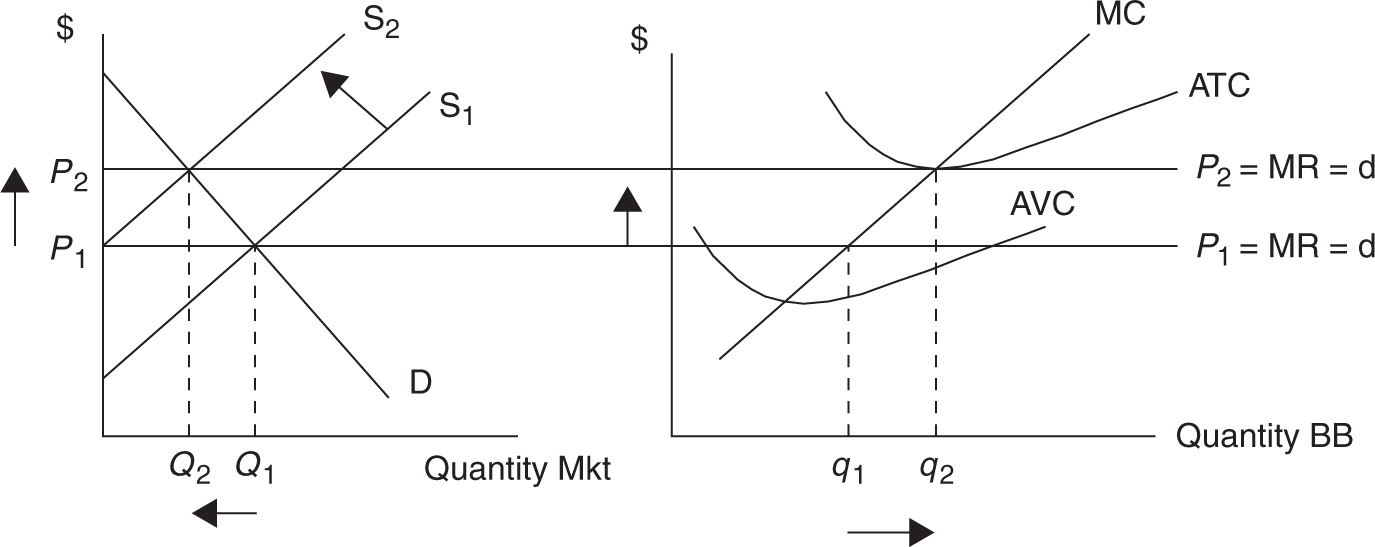
1. Bob’s Beans is a perfectly competitive soybean producer. The short-run price of soybeans is currently below average total cost, but above Bob’s shutdown point.
(A) Using two correctly labeled graphs, show the soybean market side by side with Bob’s Beans. Clearly indicate which graph represents the market and which represents Bob’s Beans. In your graphs, identify
i. price and quantity in the soybean market.
ii. price and quantity for Bob’s Beans.
iii. the area of economic profit or loss for Bob’s Beans.
(B) In a new set of side-by-side graphs for both the market and Bob’s Beans, show the long-run adjustment in each of the following:
i. Price and quantity in the soybean market
ii. Price and quantity for Bob’s Beans
(C) Suppose now that Bob’s Beans is a monopoly producer of soybeans. In a correctly labeled graph, show a profit-maximizing monopolist and indicate each of the following:
i. Price
ii. Output
iii. The area of economic profit or loss for Bob’s Beans
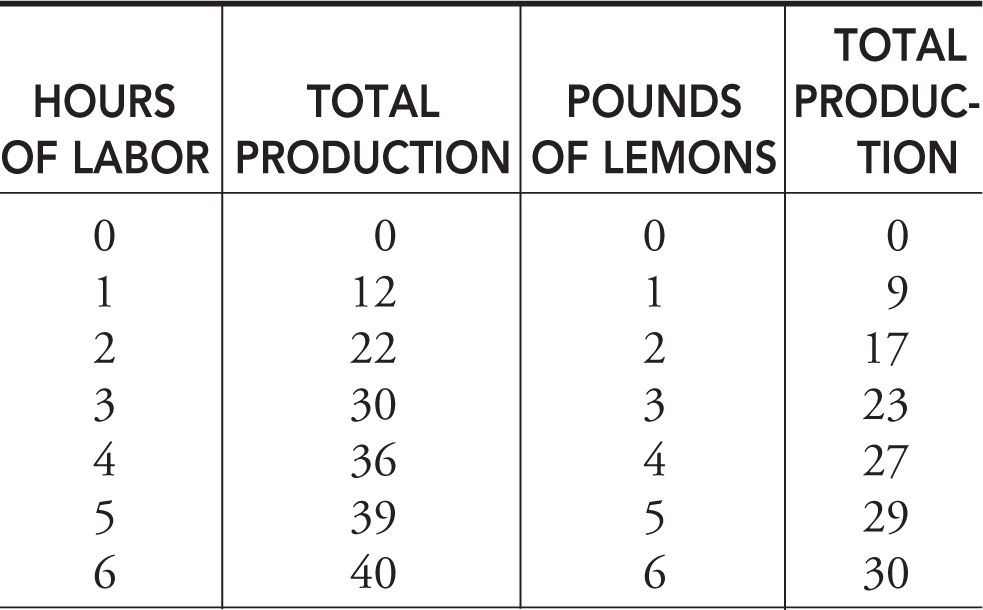
2. Eli’s lemonade stand employs only labor and lemons to produce lemonade. The table below shows how total production changes at different combinations of labor and lemons. Lemonade sells in a competitive market at $1 per cup.
(A) In competitive input markets, each hour of labor costs $6 to employ and each pound of lemons costs $2 to employ. If Eli has a $14 budget for hiring inputs, identify the least-cost combination of labor and lemons. Explain your reasoning.
(B) At the least-cost combination of labor and lemons, calculate each of the following:
i. The output produced. Show your work.
ii. The economic profit earned. Show your work.
(C) Identify the profit-maximizing quantities of labor and lemons. At the profit-maximizing quantities of labor and lemons, calculate each of the following:
i. The output produced. Show your work.
ii. The economic profit earned. Show your work.
3. The production of pork on large corporate hog farms generates pollution that seeps into the ground and can pollute the local well-water supply.
(A) From society’s perspective, use marginal analysis to explain how the competitive market creates a misallocation of resources in the market for pork.
(B) In a correctly labeled graph, illustrate the market for pork and identify the following:
i. The market equilibrium price and quantity of pork
ii. The socially optimal price and quantity of pork
(C) Recommend an appropriate policy that would correct for the misallocation of resources in the pork industry.
![]() Free-Response Grading Rubric
Free-Response Grading Rubric
Note: Based on my experience, these point allocations roughly approximate the weighting on similar questions on the AP examinations. I have also tried to provide you with notation on where points would likely be deducted for responses that were not acceptable enough for full credit. However, be aware that every year the point allocations change and partial credit is awarded differently.
Question 1 (12 points)
Part (A): 4 points
These points are graphing points.
i. 1 point: Price and quantity correctly labeled in the correctly drawn soybean market.
ii. 2 points: The price is shown as horizontal and the quantity is found at P = MR = MC.
You cannot have a downward-sloping MR curve here.
iii. 1 point: The correctly labeled loss rectangle.

TIP 1: On graphing problems, you can lose a point for not indicating which variables lie on each graphical axis. In this case, it would be as simple as a $ and a Q .
TIP 2: When asked to identify equilibrium price and quantity, do these in some way. Dashed lines from the intersection to the axes are enough, or label the intersection E1.
TIP 3: Draw your graphs large enough for you to clearly identify the area of profit/loss. If your graph is the size of a postage stamp, it becomes more difficult for you to identify all relevant parts. It is also very tough for the reader to find all of the points.
When completing graphs, label everything and indicate direction of change and you will lose fewer points.
Part (B): 4 points
i. 1 point: Showing the leftward shift in market supply due to exit of firms.
1 point: Showing how the decreased supply increases the market price and decreases market quantity.
TIP: You can lose points if you do not indicate, somehow, that the supply curve has shifted leftward. Do this with arrows or with a clear numbering system like S1 and S2.
ii. 1 point: Upward shift in the P = MR curve for Bob’s Beans.
1 point: Showing Bob producing at the point where ATC is minimized.
Question: OK, so what if I screwed up part (A)? Am I doomed in part (B)?
Answer: Maybe not, but you don’t want to risk your “5” on generous partial credit.
Suppose in part (A) that you drew a graph that showed Bob earning positive profits rather than losses. This is incorrect, and so the 4th point in part (A) cannot be given to you. But—and here is where the partial credit may differ from year to year—if in part (B) you correctly described the long-run adjustment to profits, you may (and I stress may ) receive some or all of the 4 points in part (B).
Part (B): Alternative scoring to an incorrect presumption of profits in part (A).
1 point: Because positive economic profits were being made in part (A), firms enter the soybean industry, shifting the supply to the right.
1 point: The higher supply for beans decreases the price and increases the market quantity.
1 point: Downward shift in the P = MR curve for Bob’s Beans.
1 point: Showing Bob producing at the point where ATC is minimized.
Part (C): 4 points
1 point for a correctly labeled graph with a downward-sloping market demand curve and a downward-sloping MR curve that lies below demand.
i. 1 point: Showing the quantity where MR = MC.
ii. 1 point: Showing the price from the demand curve.
iii. 1 point: Identifying the area of profit.
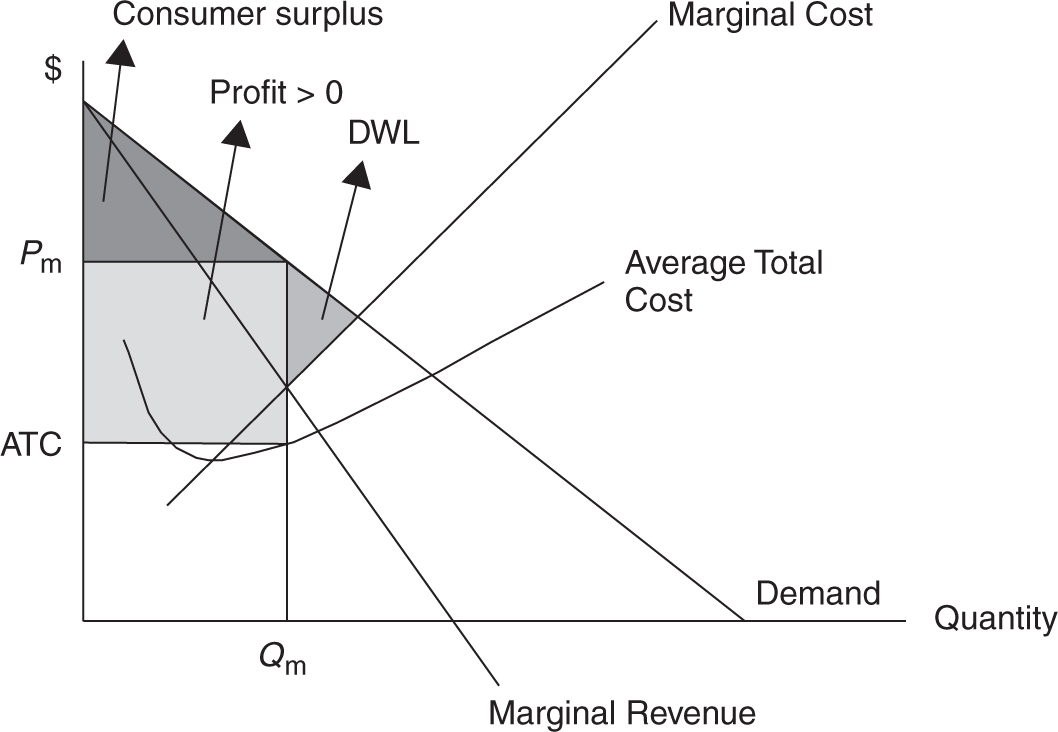
Note: I’ve also shaded the areas of consumer surplus and deadweight loss, which were not required in this practice problem. Because a more thorough analysis of monopoly has been asked on recent exams, be sure that you can identify monopoly profit, deadweight loss, and consumer surplus.
Question: So I’ve messed up the monopoly quantity, have I lost all points in part (C)?
Answer: Again, maybe not, but the rest of your response must be consistent with the incorrectly labeled output. In the figure below I have tried to replicate one possible incorrectly identified output, but consistent price and profit.
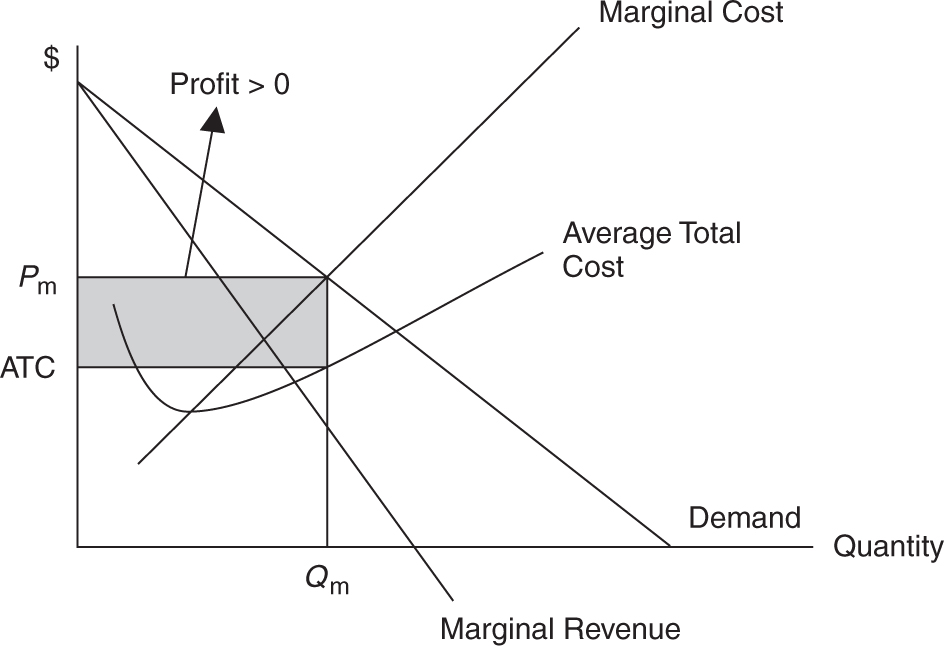
An Alternative Scoring for Part (C).
This graph shows output where demand intersects MC, not where MR = MC. This response cannot be given the point for a correct level of output. However, you would likely get a point for a correctly drawn monopoly figure, a price P m that is consistent with the Q m in this figure, and a profit area that is also consistent with Q m and P m .
Question 2 (7 points)
Part (A): 2 points
1 point: Labor = 1, Lemons = 4
1 point: This is the least-cost combination of inputs because the ratio of marginal product per dollar is equal for both inputs and Eli stays within his budget of $14.
MPlabor /Plabor = MPlemons /Plemons
TIP: Quickly write down the marginal products and highlight the options that satisfy the least-cost condition. With the price of labor being $6 and the price of lemons $2, find those ratios that are 3:1 and ignore all other possibilities.
Part (B): 2 points
i. 1 point: Output = 39 (12 from 1 labor and 27 from 4 lemons)
ii. Total revenue = $1 × 39 = $39
– Total cost = $6 × 1 + $2 × 4 = $14
1 point: Economic profit = $25
If you do not show your work, you will not earn these points.
Note: Once again, if you happened to pick an incorrect combination of labor and lemons in part (A), it may be possible to receive both points in part (B) if you find the consistent level of output and profit.
Part (C): 3 points
1 point: The profit-maximizing amount of labor is 4 (find MRP = Input price = $6).
The profit-maximizing amount of lemons is 5 (find MRP = Input price = $2).
i. 1 point: Output = 65 (36 from 4 labor and 29 from 5 lemons)
ii. Total revenue = $1 × 65 = $65
– Total cost = $6 × 4 + $2 × 5 = $34
1 point: Economic profit = $31
Note: Once again, if you happened to pick an incorrect combination of labor and lemons in the first part of (C), it may be possible for you to receive the last two points in part (C) if you find the consistent level of output and profit.
Question 3 (5 points)
Part (A): 2 points
1 point for explaining that a negative externality creates a situation where the marginal social cost exceeds the marginal social benefit.
1 point for explaining how this market failure results in an overallocation of resources to pork production. Too much pork is being produced.
Part (B): 2 points
i. 1 point: The market price and quantity identified at the intersection of marginal social benefit and marginal private costs. Note that the MSB curve can also be labeled as a demand curve. The MPC curve can be labeled as market (or private) supply and the MSC curve can also be labeled as the social supply curve.
ii. 1 point: The socially optimal price and quantity are identified at the intersection of marginal social benefit and marginal social costs. Quantity must be less than the market quantity, and price must be higher than the market price.
Part (C): 1 point
An appropriate policy for this kind of negative externality would be to levy a tax on pork production to shift the MPC upward and closer to the MSC. Note that you might also receive this final point if you advocated a tax on consumers of pork as this would also serve to reduce the quantity of pork produced in the market.
Remember, too much pork is being produced at a price that is too low, so you do not want to advocate a policy that would increase pork production or lower the price of pork.
Scoring and Interpretation
AP Microeconomics Practice Exam 1
Multiple-Choice Questions:
Number of correct answers: _____
Number of incorrect answers: _____
Number of blank answers: _____
Did you complete this part of the test in the allotted time? Yes/No
Free-Response Questions:
1. _____/12
2. _____/7
3. _____/5
Did you complete this part of the test in the allotted time? Yes/No
Calculate Your Score:
Multiple-Choice Questions:

Free-Response Questions:

Add the raw scores from the multiple-choice and free-response sections to obtain your total raw score for the practice exam. Use the table below to determine your grade, remembering these are rough estimates using questions that are not actually from AP exams, so do not read too much into this conversion from raw score to AP score.