High School Algebra I Unlocked (2016)
Chapter 7. Function Basics
GOALS
By the end of this chapter, you will be able to:
•Describe the characteristics of a function
•Evaluate functions from equations, graphs, and tables
•Determine the domain and range of functions
•Express the domain and range of a function in interval notation
•Graph linear and non-linear functions
•Determine whether a relation is a function using the vertical line test
•Classify functions as increasing, decreasing, or constant
Lesson 7.1. Function Fundamentals
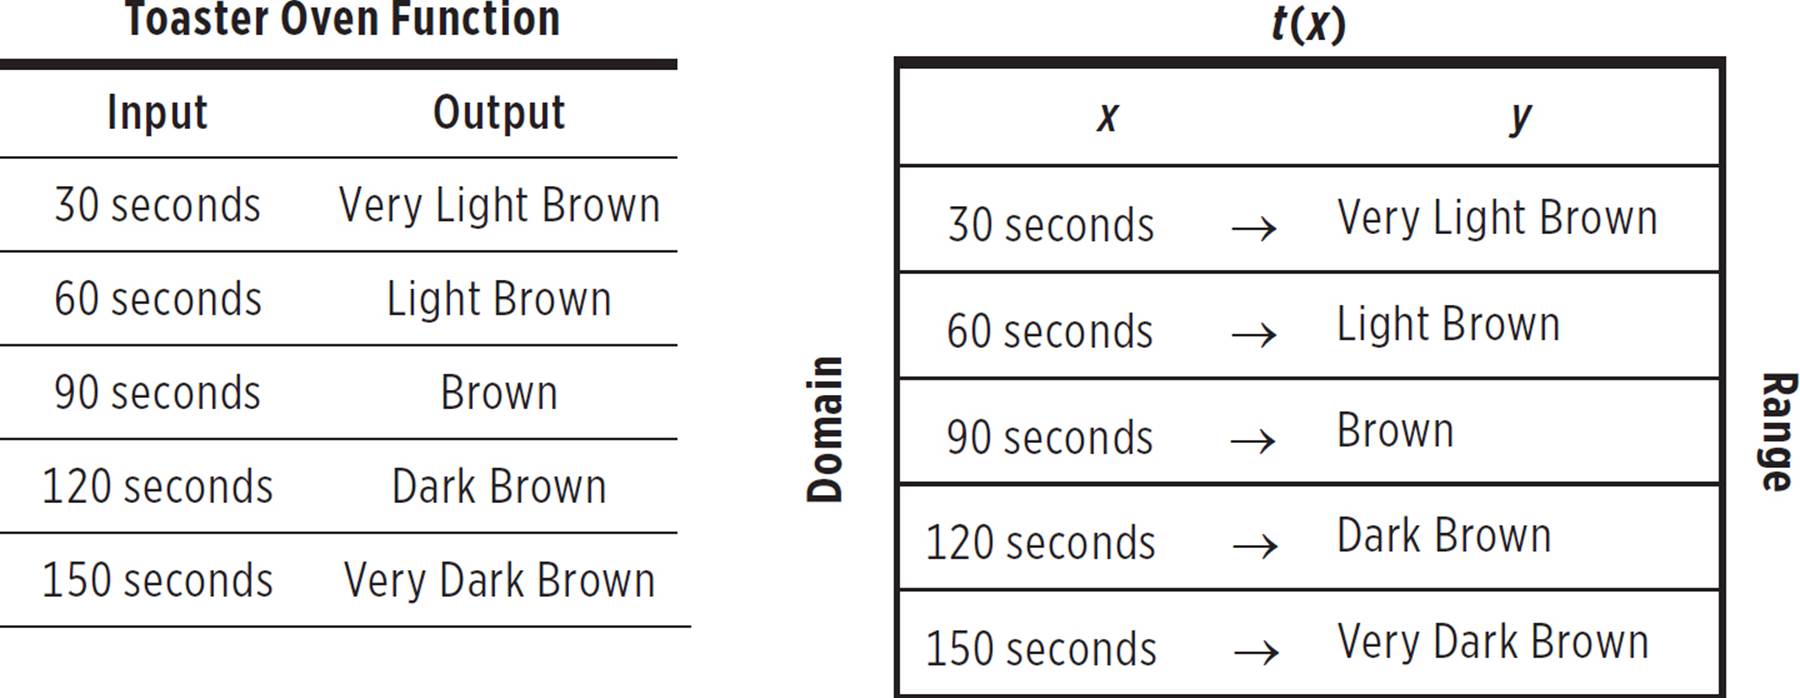
Consider a toaster. What is the purpose, or function, of a toaster? If you’re thinking, “A toaster is used to toast things—duh,” you are absolutely correct. A toaster, using the powers of heat and energy, transforms a piece of regular, untoasted bread into a golden-brown piece of crispy bread. In essence, a toaster is a function: a relation from a set of inputs to a set of possible outputs. Look at the following table.
|
Toaster Oven Function |
|
|
Input |
Output |
|
30 seconds |
Very Light Brown |
|
60 seconds |
Light Brown |
|
90 seconds |
Brown |
|
120 seconds |
Dark Brown |
|
150 seconds |
Very Dark Brown |
So, if you put a slice of bread in the toaster oven for 30 seconds, the output will be a very light brown slice of toast. But if you put a piece of bread in the toaster oven for 120 seconds, the output will be a dark brown piece of toast. The input value affects the output value.
Functions are generally written in the following form:
ƒ(x) = x + 1
In the example ƒ(x) = x + 1, ƒ is the name of the function, x is the input and the x-value that goes into the function, and x + 1 is the output, the associated y-value.
While functions are most
commonly named ƒ, they
can have names such as
g, h, or even kitten. So,
if you were told that
kitten(x) = x + 1, you
would know that the
function kitten takes
in x, adds 1 to the
value of x, and outputs
the value of x + 1.
Now that you know some basic terminology, let’s talk about how to deal with mathematical functions. Here’s the good news: Functions are similar to equations. Consider the equation y = x + 1. Here, you put in a value for x and find the corresponding value of y. Similarly, you can solve, or evaluate, the function ƒ(x) = x + 1 by putting in a value for x and finding the corresponding value for ƒ(x). Let’s see how this works.
EXAMPLE 
If ƒ(x) = x + 1, what is ƒ(3) ?
Whenever you encounter a question that asks you to find ƒ(value) for a given function, plug that value in for the variable in the function and simplify as follows:
ƒ(x) = x + 1
ƒ(3) = 3 + 1
ƒ(3) = 4
That’s it—you’ve successfully evaluated a function and found that ƒ(3) = 4.

Now let’s try a few function evaluation questions to make sure you understand the terminology and basic concepts.
EXAMPLE 
If ƒ(x) = x2 + 4, what is the value of ƒ(4) ?
This question requires you to evaluate the value of ƒ(4), given the function ƒ(x) = x2 + 4. To evaluate this function, you need to substitute in 4 for every x you see in the function ƒ(x) = x2 + 4 and simplify:
ƒ(4) = 42 + 4
ƒ(4) = 16 + 4
ƒ(4) = 20
Therefore, the value of ƒ(4) = 20.

EXAMPLE 
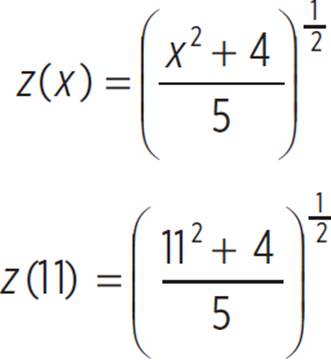
If z(x) = 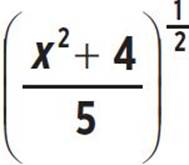 , what is the value of z(11) ?
This question requires you to tackle functions and exponents at the same time. Simply substitute in x = 11 for all x values in the function x(x) = 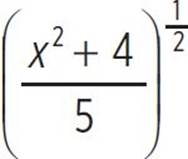 and simplify.
Next, simplify the expression inside the parentheses.
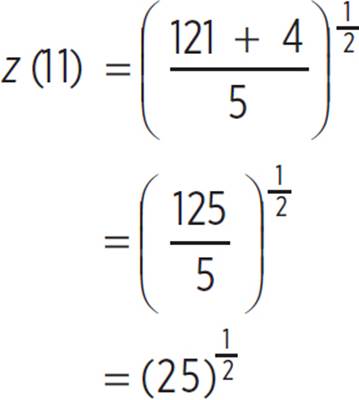
Finally, tackle the exponent and simplify.
z(11) = (25)
= ![]()
= 5
Thus, for the function z(x) = , z(11) = 5.

You can also evaluate functions graphically by using a process similar to the one you use for evaluating functions numerically. Let’s take a look at an example.
EXAMPLE 
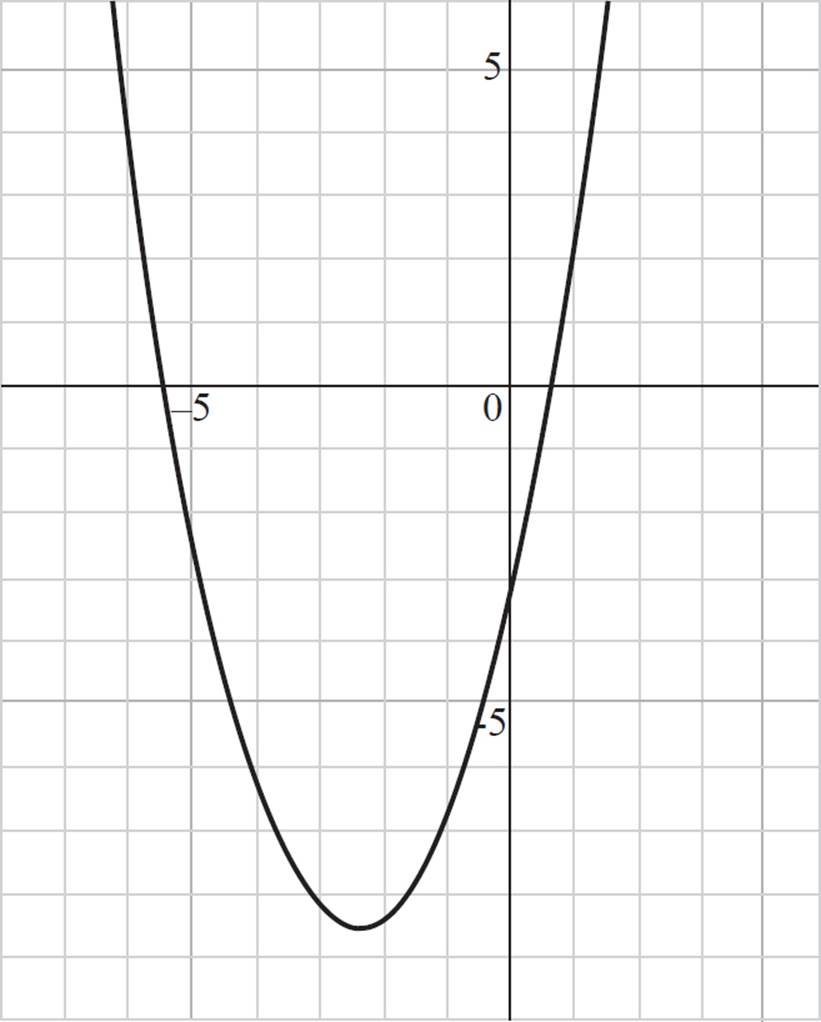
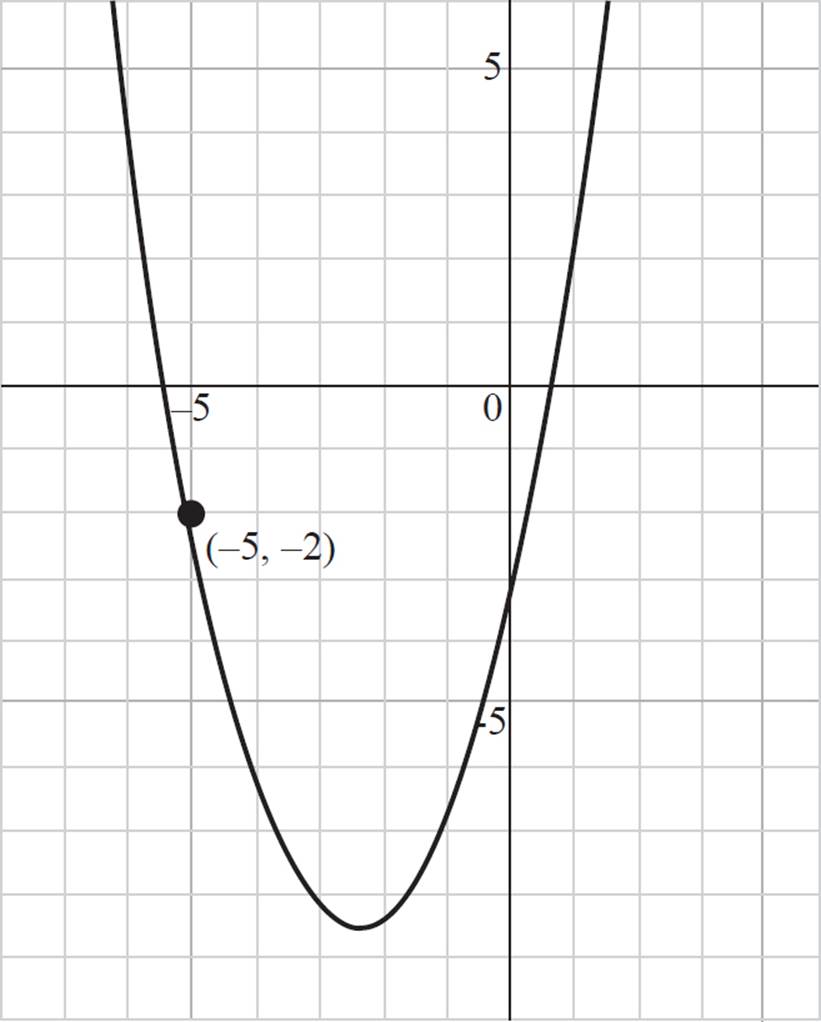
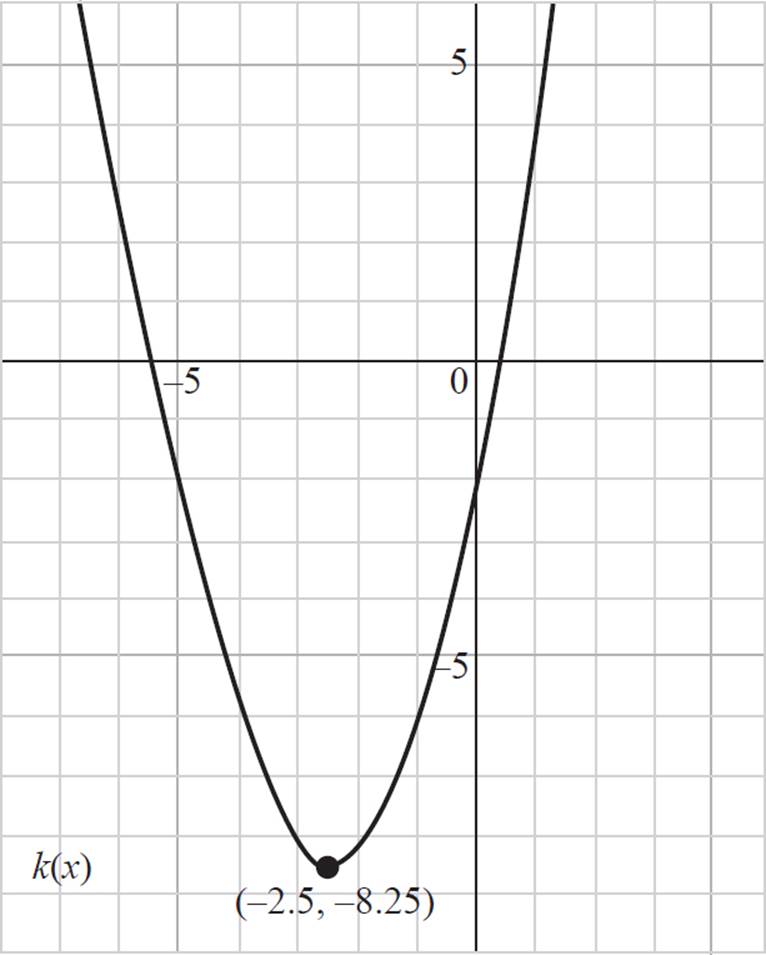
In the graph of k(x), what is the value of k(−5) ?
This question requires you to evaluate the value of k(−5), given the graph of k(x). Since you are given the input value, x = −5, your goal is to find the associated output value, or y-value, of the function. Based on the graph of k(x), k(−5) = −2, as shown in the following graph:

EXAMPLE 
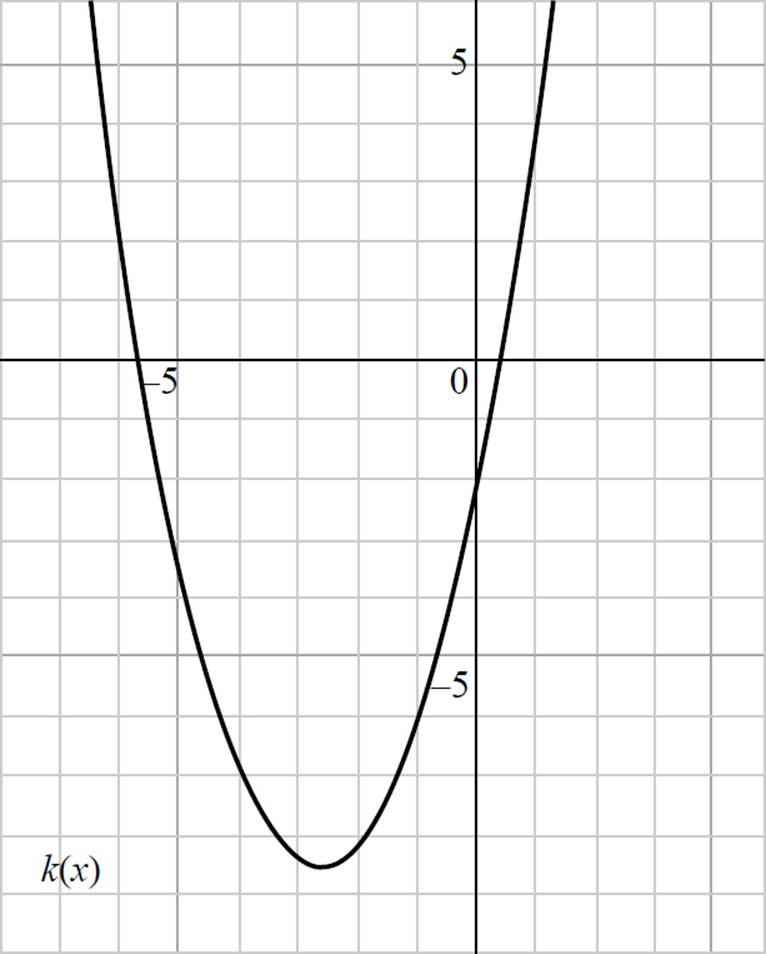
In the graph of k(x), if k(x) = −8.25, what is the value of x ?
Like the previous question, you are asked to find a value based upon the graph of k(x). However, here you are given the output value, k(x) = −8.25, and you need to find the associated input value, or x-value, of the function. Based on the graph of k(x), when the graph has a y-value of −8.25, it has an x-value of −2.5.

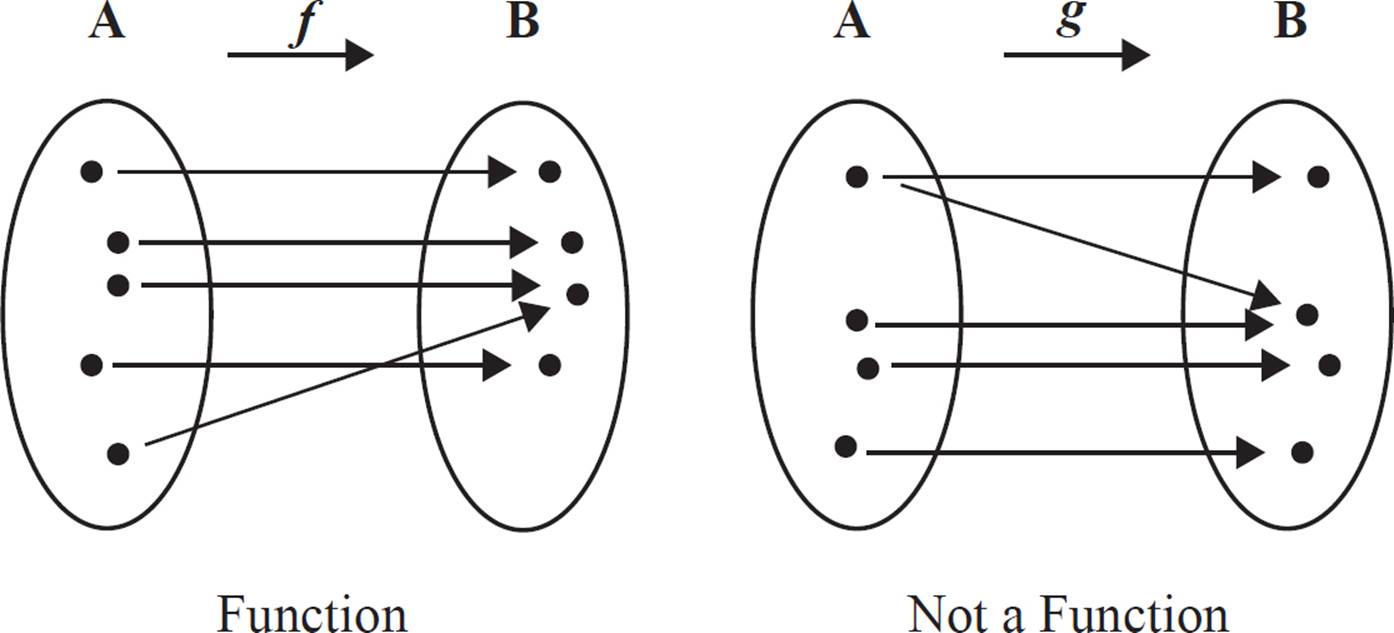
A major difference between functions and equations is that each input is related to exactly one output in a function. Note that each input must relate to a single output, but multiple inputs can result in a single output.
Furthermore, unlike the method used to write equations, function notation provides more flexibility; rather than using “y =” for every equation, you can effectively and efficiently use informative, descriptive variables.
In order to be a function, each input (x-value) must correspond to only one output (y-value).
Based on this information, let’s look at a function question that is slightly different than the previous examples.

Here is how you may see functions on the SAT.
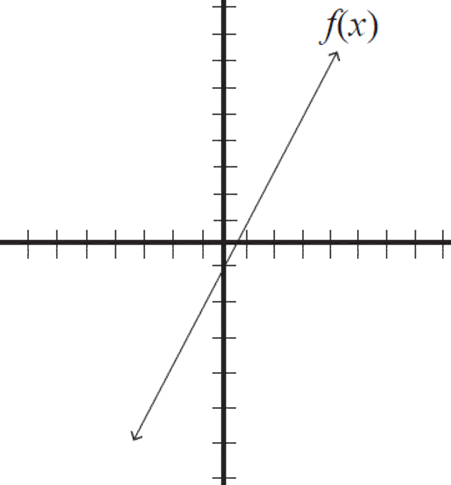
The graph of ƒ(x) is shown below. If the function d is defined by d(x) = ƒ(![]() x − 1), what is the value of d(6) ?
x − 1), what is the value of d(6) ?
A) −1
B) 1
C) 3
D) 5
EXAMPLE 
Which of the following relations is NOT a function?
A)
|
x |
y |
|
2 |
1 |
|
4 |
2 |
|
6 |
3 |
|
8 |
4 |
|
10 |
5 |
B)
|
x |
y |
|
1 |
1 |
|
2 |
2 |
|
3 |
1 |
|
4 |
2 |
|
5 |
1 |
C)
|
x |
y |
|
2 |
3 |
|
4 |
6 |
|
6 |
9 |
|
2 |
12 |
|
10 |
15 |
D)
|
x |
y |
|
1 |
10 |
|
3 |
6 |
|
6 |
9 |
|
8 |
7 |
|
10 |
8 |
This question, which requires you to identify the relation that is not a function, is concerned with the definition of a function, a relation in which each input is related to exactly one output. In the first set shown in (A), each x-value is related to a single y-value; 2→1, 4→2, 6→3, 8→4, and 10→5. Therefore, (A) is a function and can be eliminated.
In the second set shown in (B), each x-value is related to a single y-value; 1→1, 2→2, 3→1, 4→2, and 5→1. Keep in mind that, while each input must relate to a single output, more than one input can relate to a single output; thus, (B) is a function and can be eliminated.
In the third set shown in (C), the input value of 2 is related to output values of 3 and 12; 2→3 and 2→12. Since a single input is related to more than one output, (C) is not a function and should be kept.
In the final set shown in (D), each x-value is related to a single y-value; 1→10, 3→6, 6→9, 8→7, and 10→8. Therefore, (D) is a function and can be eliminated.
Thus, all of the sets are functions except for (C), which is the answer.

You may also encounter questions that ask you to determine the domain and range of a function.
In a function, the set of input elements, or x-values, is known as the domain. The set of output elements, or y-values, is known as the range.
Let’s look back at our toaster oven example to see how domain and range works.

The question states that the function d(x) = ƒ(1/2x − 1) and asks you to find the value of d(6). Start by setting x = 6 into the expression d(x) = ƒ(1/2x − 1):
d(6) = ƒ(1/2(6) − 1)
d(6) = ƒ(3 − 1)
d(6) = ƒ(2)
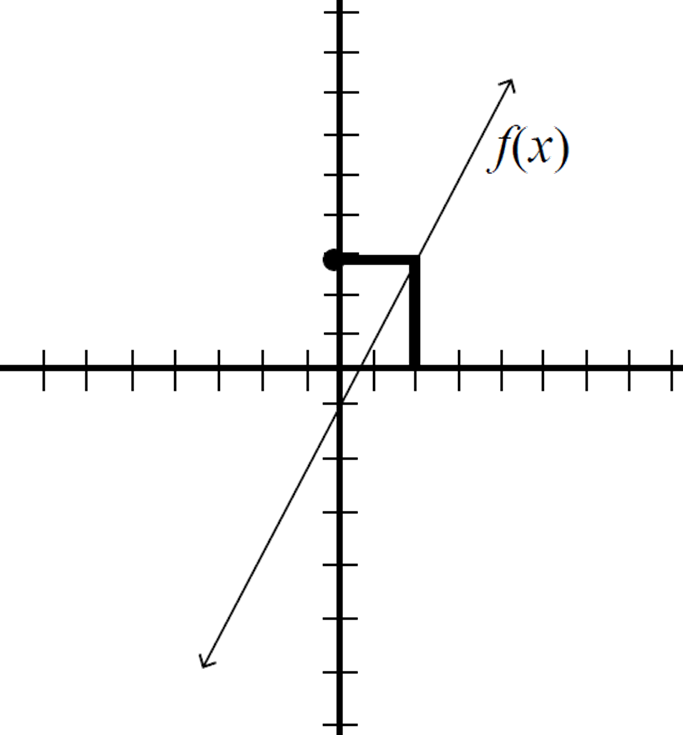
Thus, the value of d(6) is ƒ(2), which can be found using the provided graph of ƒ(x). Draw a vertical line upwards from x = 2 until you hit the ƒ(x) line, and then draw a horizontal line to the y-axis to find that the y-value for ƒ(2) is 3.
So the value of d(6) = 3, and (C) is correct.
The following charts show how each input is mapped to a single output in the toaster function, t(x). For example, t(60) = Light Brown, indicating that a piece of bread toasted for 60 seconds will only ever be light brown, and t(120) = Dark Brown, indicating a piece of bread toasted for 120 seconds will only ever be dark brown. The domain of our toaster function is x: {30, 60, 90, 120, 150}, and the range of our toaster function is y: {Very Light Brown, Light Brown, Brown, Dark Brown, Very Dark Brown}.
Here are a couple of questions that deal with the domain and range of a function.
EXAMPLE 
Consider the points (1, 2), (−1, 3), (0, 0), (2, 1), and (3, 5). State the domain and range of the relation. Is this relation a function?
This question is slightly different than others we’ve looked at thus far. The key knowledge you need to tackle this problem is that the domain of a relation is equal to all the x-values, while the range of a relation is equal to all the y-values. Based on the points (1, 2), (−1, 3), (0, 0), (2, 1), and (3, 5), we would find the following as our domain and range:
Domain: {−1, 0, 1, 2, 3}
Range: {0, 1, 2, 3, 5}
In this scenario, each input is related to a unique output and, therefore, is considered a function.

Alternatively, you may be asked to determine the domain of a function given the equation of the function. While it may be tempting to simply plug the function into a graphing calculator, you may not always be allowed to use a calculator. Let’s see how we can determine the domain and range of a function by using only the formula of the function.
EXAMPLE 
Determine the domain of the function ƒ(x) = 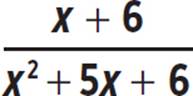 .
.
To answer this question, you need to know that the domain of a function is all the x-values of that function. In a linear function, such as ƒ(x) = x + 3, the domain would be all real numbers, as the function extends indefinitely across all values of x. In this function, however, we have a quadratic in the denominator, indicating that it is possible to have an x-value that would lead to having zero in the denominator. Thus, the domain for this function is all real numbers except those that would cause division by zero.
But how do we find the numbers that would cause division by zero? First, set the quadratic in the denominator, x2 + 5x + 6, equal to zero. Then factor it as you would any quadratic equation and find the zeros.
x2 + 5x + 6 = 0
(x + 3)(x + 2) = 0
x = −3 or x = −2
Therefore, the function ƒ(x) = 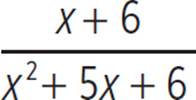 will have a zero in the denominator when x = −3 or x = −2. Thus, the domain of this function is all real numbers except −3 and −2.

Another way to express the domain and range of a function is with interval notation. Let’s see how this works.