High School Algebra I Unlocked (2016)
Chapter 9. Manipulating Functions
Lesson 9.2. Vertical and Horizontal Translations
Since you’re now basically a professional quadratic equation and function writer, you know that the vertex form of a quadratic function is f(x) = (x − h)2 + k. The values of the constants play a huge role in how a function is graphed. Consider again the most basic function, ƒ(x) = x2.
But what would happen if you altered the value of the constant, k? If you change the value of k, the image will experience horizontal or vertical shifts that change the location, but not the size of the figure. So how does the value of k hold so much power? Take a look at the following examples.
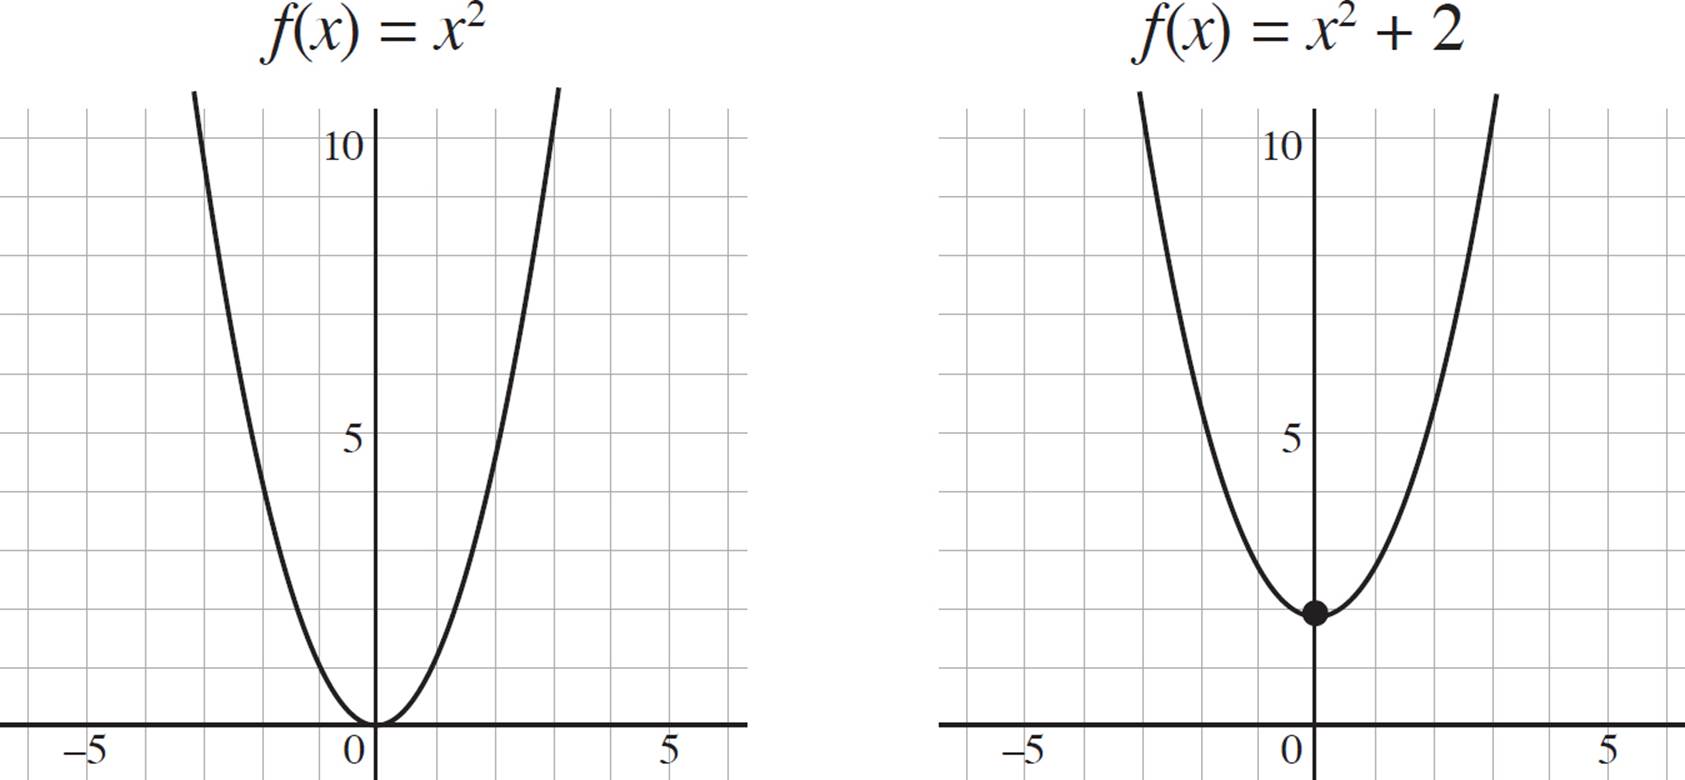
Consider our original function ƒ(x) = x2, and a second function, ƒ(x) = x2 + 2, in which k = 2. Here, the function experiences a vertical shift up by 2, as shown on the following graph.
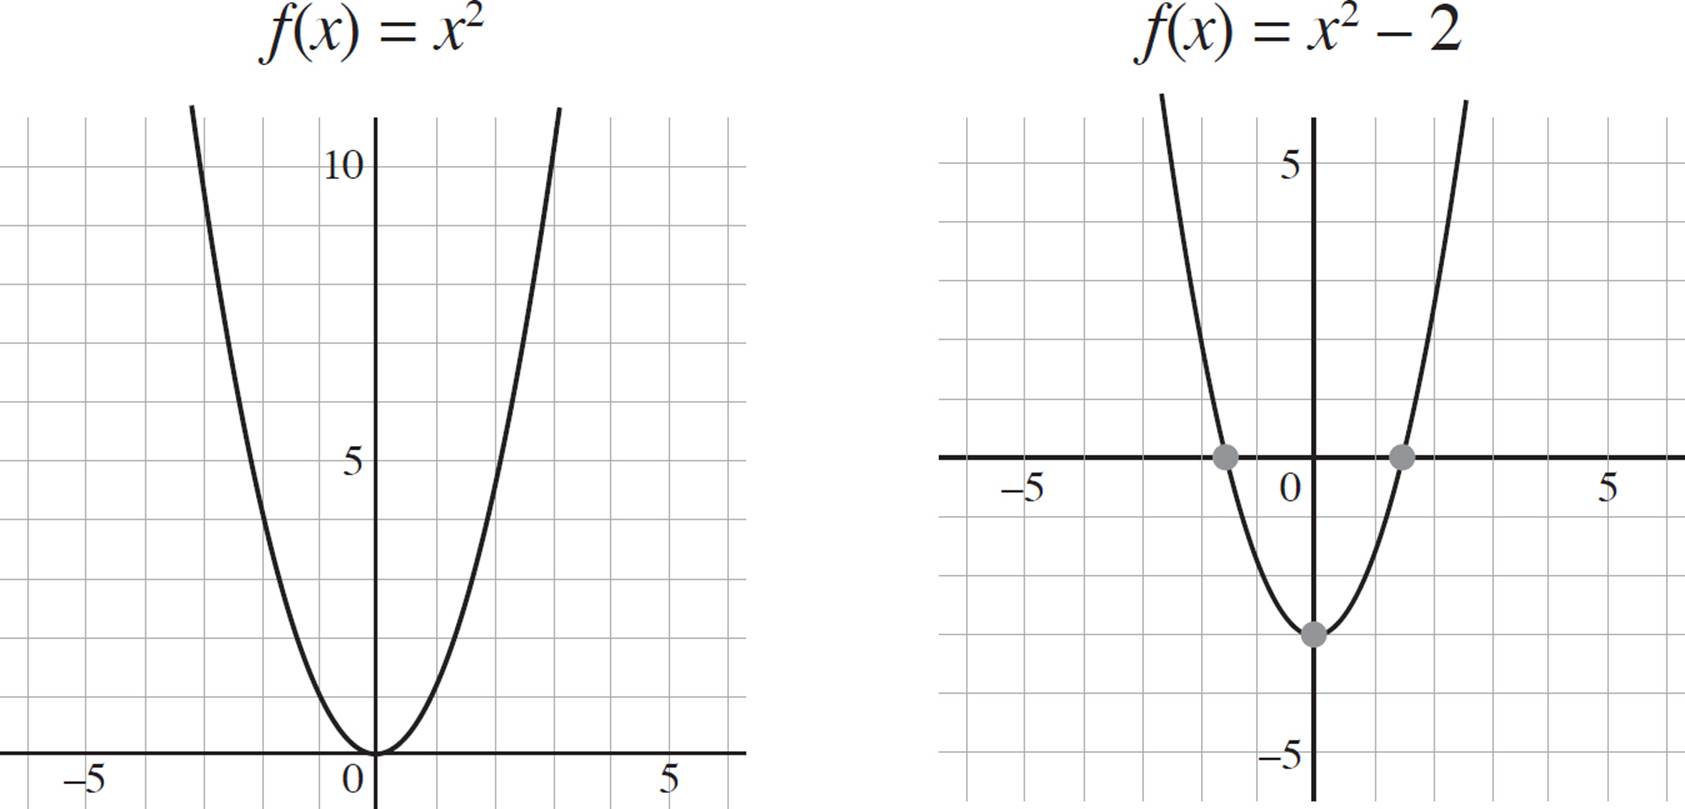
On the other hand, if k = −2, the function ƒ(x) = x2 becomes ƒ(x) = x2 − 2, and the function will experience a vertical shift down by 2:
No matter what, if the k-term is not zero, you will have a vertical translation, and the resulting image will have the same x-coordinates as the pre-image, but different y-coordinates.
Given the function ƒ(x) = x2 + k:
If k > 0, the function shifts upwards by k units.
If k < 0, the function shifts downwards by k units.
Shifting the graph up or down is a vertical translation.
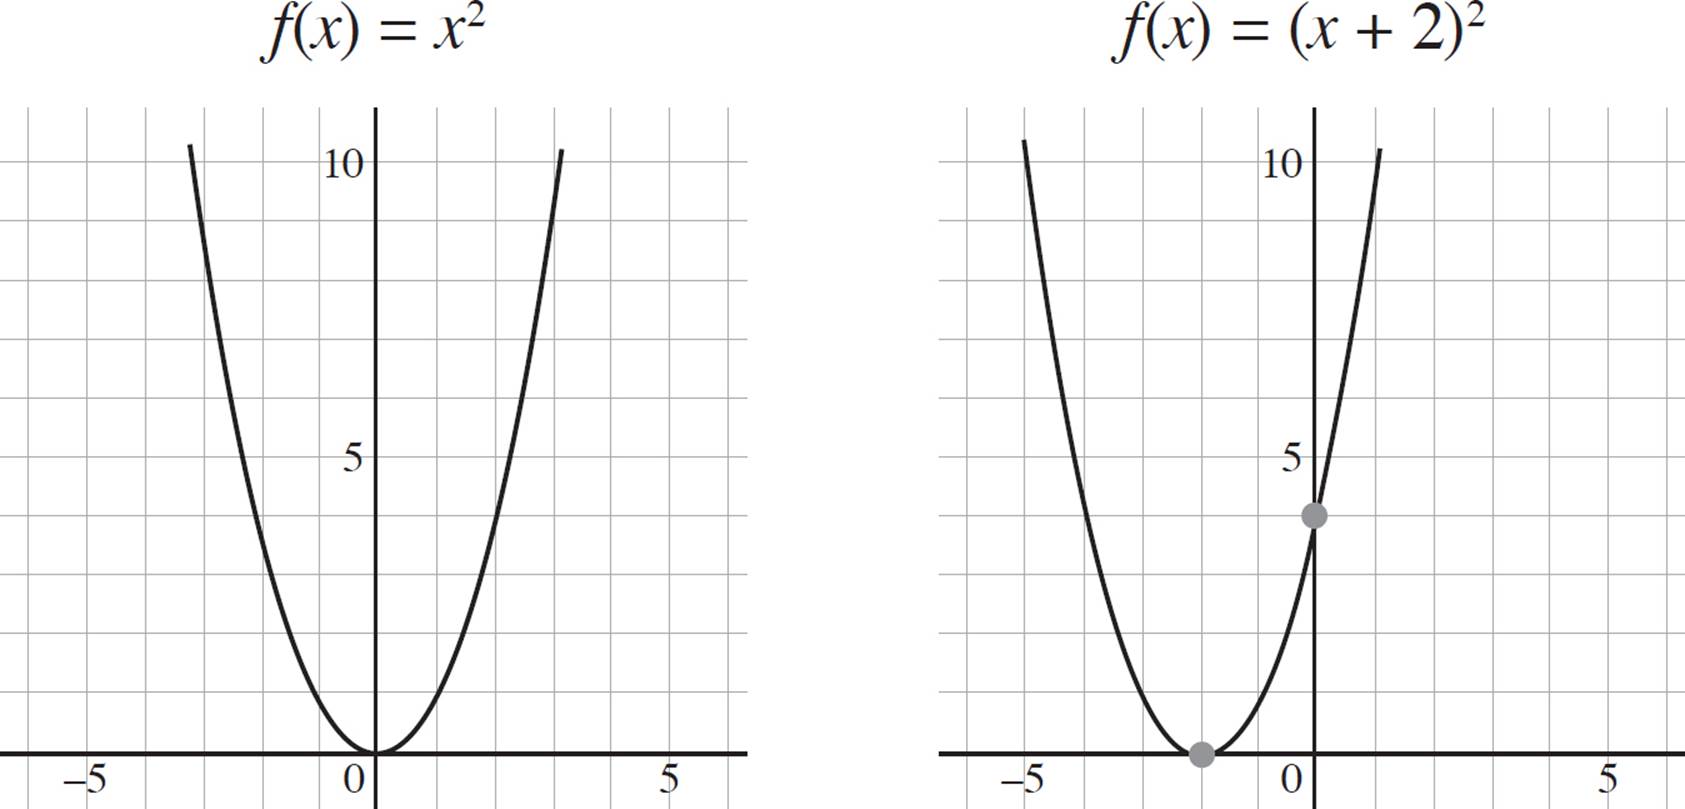
But that’s not all! Again, let’s consider vertex form of a quadratic function is ƒ(x) = (x − h)2 + k. If the value of h is grouped with the x-term, the resulting graph will be shifted either left or right. For example, if the function ƒ(x) = x2becomes ƒ(x) = (x − (−2))2 or ƒ(x) = (x + 2)2, the value h = −2 is grouped with the x-term. This shifts the graph to the left by 2 units on the x-axis. Refer to the following graphs.
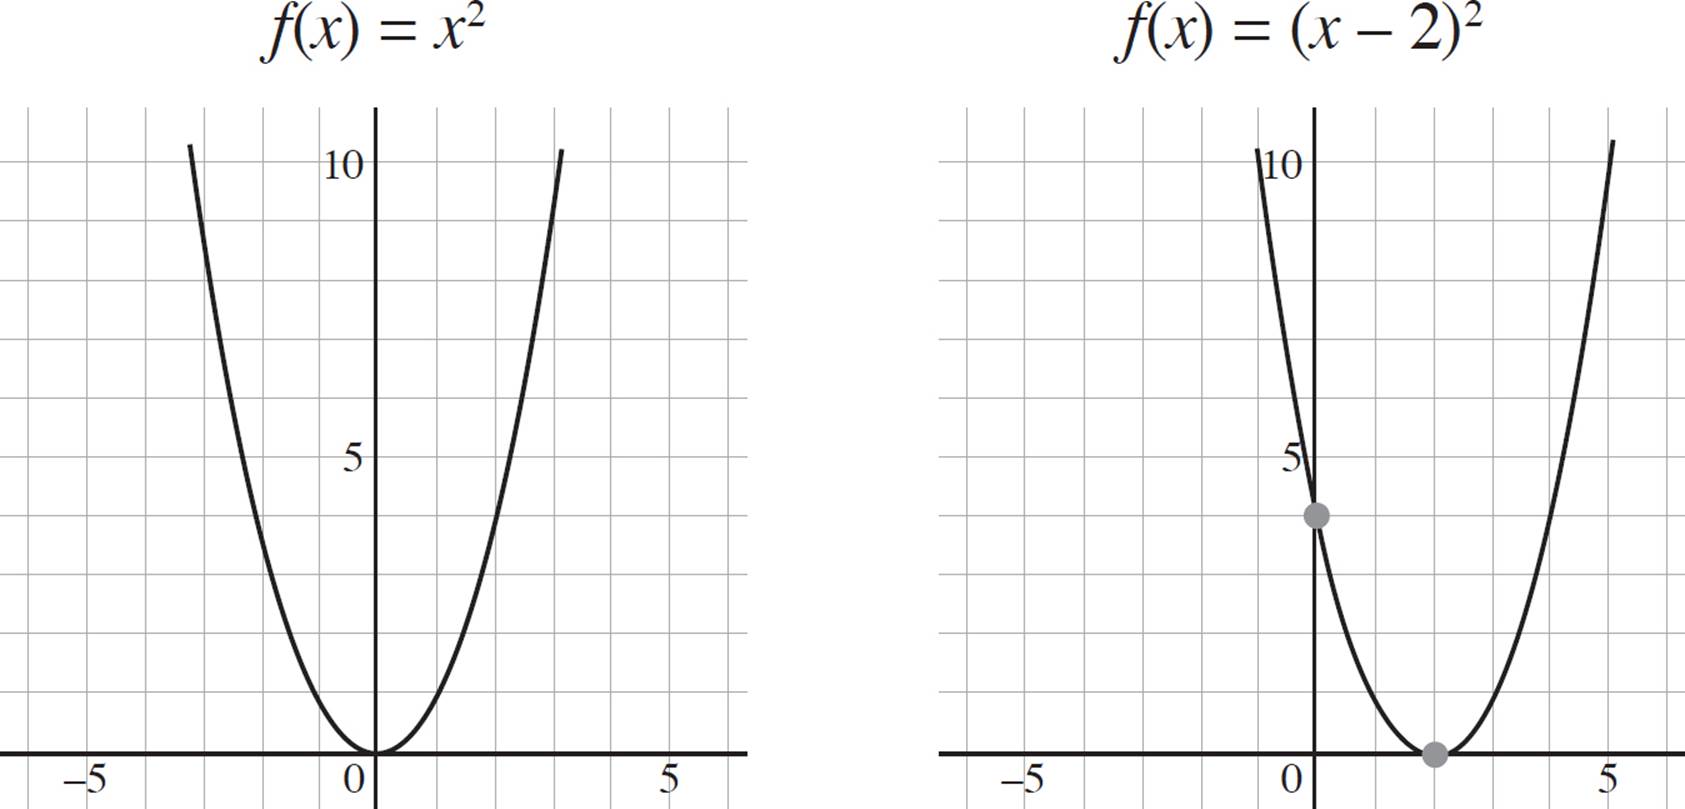
Conversely, if the function ƒ(x) = x2 becomes ƒ(x) = (x − 2)2, the value h = 2 is grouped with the x-term. Thus, the graph shifts to the right by 2 units on the x-axis:

Here is how you may see vertical translations on the SAT.
Let the function ƒ be defined such that ƒ(x) = x2 − c, where c is a constant. If ƒ(−2) = 6, what is the value of c ?
A) −10
B) −2
C) 0
D) 2
Just remember: If the h-term is grouped with the x-term, you will have a horizontal translation, and the resulting graph will have the same y-coordinates but different x-coordinates.
Given the function ƒ(x) = (x + h)2:
If h > 0, the function shifts to the left by h units.
If h < 0, the function shifts to the right by h units.
Shifting the graph left or right is a horizontal translation.
While the previous examples show each of these translations in isolation, you should know that vertical and horizontal translations can occur simultaneously. Let’s try some questions that deal with function translations.
If you’re having a difficult
time remembering
the transformation
caused by a constant,
remember the following
mnemonic device:
Add to y, go up high.
Add to x, go to the left.
EXAMPLE 
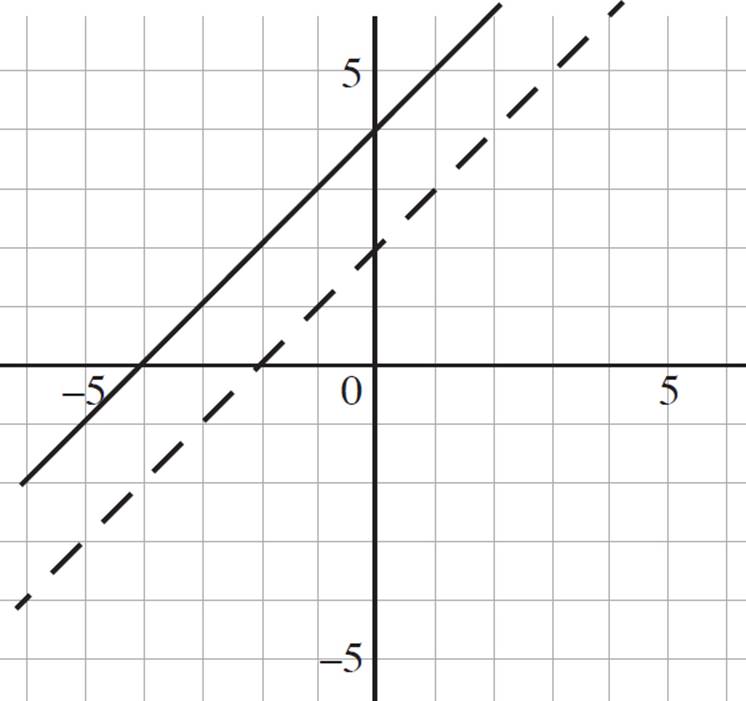
Graph r(x) and s(x) in the coordinate plane, given that r(x) = x + 4 and s(x) = r(x) − 2.
You are told that r(x) = x + 4 and s(x) = r(x) − 2, and you’re asked to graph both functions. Start with r(x), graphing it as you would any linear equation. To find the y-intercept of r(x), set x = 0 and solve for r(x), or y; here, the y-intercept is at (0, 4). Conversely, to find the x-intercept of r(x), set r(x) = 0 and solve for x; here, the x-intercept is at (−4, 0). The graph of r(x), depicted with a solid line, is shown in the graph below.
Next, you are told that s(x) = r(x) − 2. Since the −2 is not associated with the x-term, you will shift r(x) two units downwards. The graph of s(x), depicted with a dashed line, is shown in the following graph.

Now let’s try a slightly trickier question.
EXAMPLE 
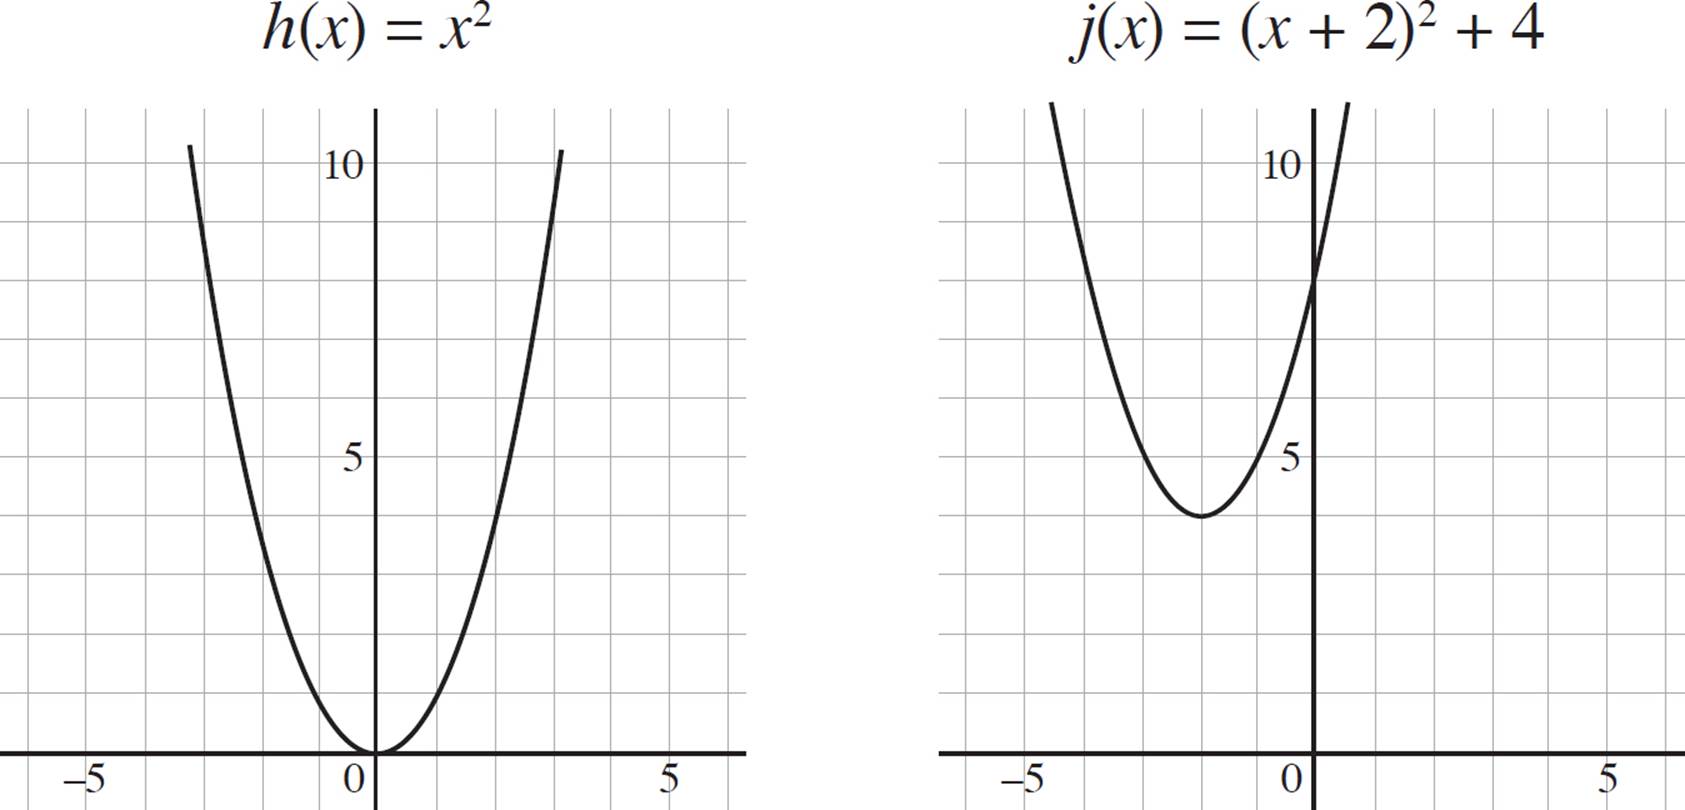
What is the equation that represents j(x) if h(x) = x2, and j(x) is obtained by shifting h(x) four units upwards and two units to the left?
There’s a lot going on in this question, so break it up into pieces. The question states that j(x) is found by shifting the original function, h(x) = x2, four units up and two units to the left. Based on the information we’ve covered so far, we know that a function shifts up or down if a constant not grouped with x is added to the function. Thus, we know that we have to have a constant of 4 added to the base function j(x); j(x) = ___ + 4.
Next, you are told that the graph of h(x) is shifted to the left by two units. In order to shift to the left, the value must be positive and added to the x-term. Therefore, shifting h(x) four units up and two units to the left would result in the function j(x) = (x + 2)2 + 4.
You can always confirm your answer by graphing the two functions and comparing the outputs. Take a look at h(x) and j(x) in the graphs on the next page; j(x) has been shifted to the left by two and up by four.
Conversely, you can consider the vertices of each function. For the original function, h(x) = x2, the vertex is at (0, 0). Since j(x) is a transformation of h(x) that is shifted four units upward and two units to the left, you know that the vertex of j(x) will be at (−2, 4), and, therefore, the equation of the j(x) = (x + 2)2 + 4. So many ways to crack this nut of a question!

Here you’re told that ƒ(x) = x2 − c, c is a constant, ƒ(−2) = 6, and you need to find the value of c. Since ƒ(−2) = 6, plug in −2 for x into the function and solve for c:
ƒ(x) = x2 − c
6 = (−2)2 − c
6 = 4 − c
c = −2
You’re done. The value of the constant is −2, which indicates that ƒ(x) = x2 + (−2) and ƒ(x) = x2 − 2, further indicating that the graph of ƒ(x) would shift downwards two units from the origin, and the correct answer is (B).

Let’s try one more question before moving on.
EXAMPLE 
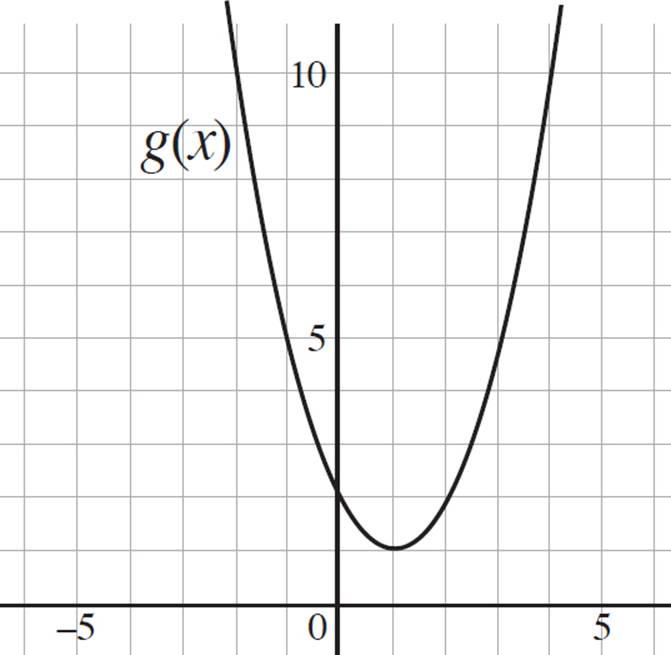
g(x) = (x − 1)2 + 1, and k(x) is obtained by shifting g(x) three units downwards and three units to the right. Graph g(x) and k(x), and write the equation that represents k(x).
This question has many parts, so take it one step at a time. The question states that g(x) = (x − 1)2 + 1, so start by graphing this in the coordinate plane. Recall that g(x) is simply a transformation of y = x2, and since the function is already in vertex form, you know that h = 1, k = 1, and the vertex of g(x) is (1, 1). Therefore, the 1 subtracted from the x-term indicates a shift to the right of the origin by one unit, and the 1 outside the parentheses indicates a shift up from the origin by one unit. Thus, the graph of g(x) is as follows:
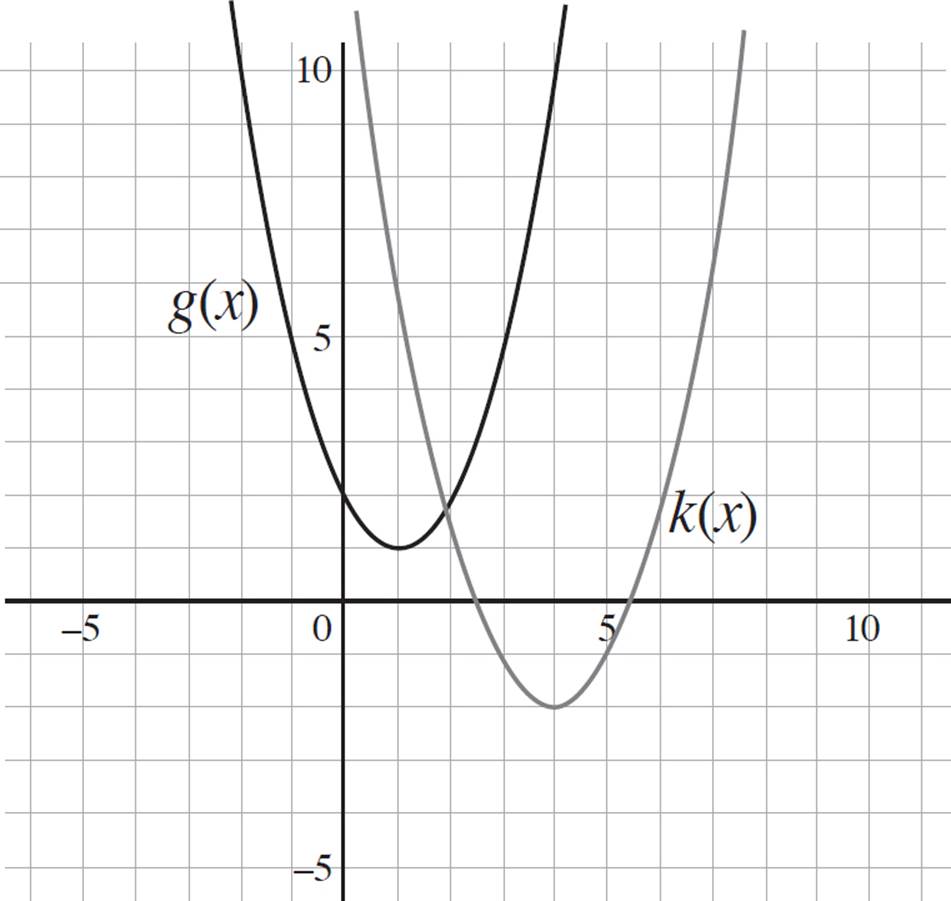
We are then told that the graph of k(x) is shifted three units downwards and three units to the right. A three-unit shift to the right indicates that a positive 3 must be subtracted from the existing x-term, and a three-unit shift downward indicates that 3 must be subtracted from the existing k(x) component. Thus, shifting g(x) three units down and three units to the right would result in the function k(x) = (x − 1 − 3 )2 + 1 − 3, and k(x) = (x − 4)2 − 2. The equation k(x) is now in the vertex form of a quadratic, where y =a(x − h)2 + k and (h, k) is the vertex. Thus, the vertex of k(x) is (4, −2).
Finally, graph both g(x) and k(x). Notice that the vertex of k(x) is three units down and three units to the right of the vertex of g(x). That means we successfully translated the graph of g(x) to k(x) = (x − 4)2 − 2. Well done!

Function transformations are not limited to shifting. Let’s take a look at how a function can be reflected across the x- or y-axis.