High School Algebra II Unlocked (2016)
Chapter 7. Making and Using Mathematical Models
Lesson 7.4. Modeling Situations with Graphs
Graphs may help you to better understand or express the relationships between variables in a function. Many times you will need to translate information in a problem to a function or set of functions before graphing.

In Chapter 6, Lesson
6.2, we looked at
ceiling functions
and their graphs
in Examples 9 and
10. Here, we are
translating given
information about
Rachel’s babysitting
charges into a ceiling
function, which we
will then graph.

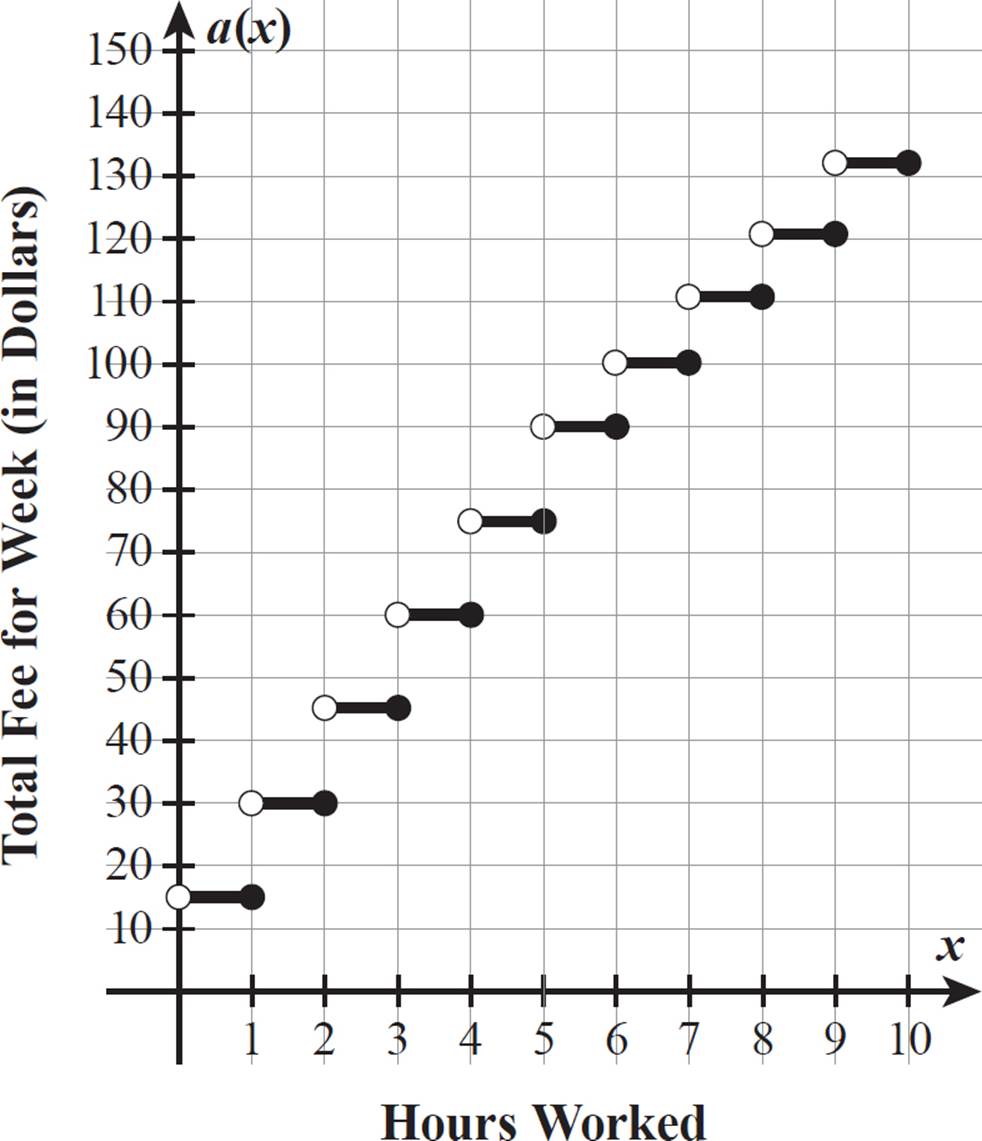
Rachel babysits for a maximum of 10 hours per week. She charges $15 per hour or any part of an hour in her total for the week for each client. If one of her clients hires her for more than 6 hours in one week, she gives them a 30% discount off her usual hourly rate, for all hours over 6 hours. Write and graph a function representing the amount, a(x), a client pays Rachel for a week in which she works x hours for them.
Each part of an hour is rounded up to the next whole hour, so this is a ceiling function.
For up to 6 hours, Rachel charges $15 per hour or part of an hour, so for 0 ≤ x ≤ 6, a(x) = 15 ⋅ ⌈ x⌉. For more than 6 hours, Rachel charges $15 for each of the first 6 hours and 70% of $15 per hour for each additional hour. (A 30% discount means paying 70% of the regular rate.) To show the discounted charge for each additional hour, you must subtract the first 6 hours from x before multiplying by the hourly rate. So, for 6 < x ≤ 10, a(x) = 15(6) + 0.7(15) ⌈x − 6⌉. This equation simplifies to a(x) = 90 + 10.5 ⌈x − 6⌉.
The amount, a(x), a client pays Rachel for a week in which she works x hours for them is given by the piecewise function below.
a(x) = 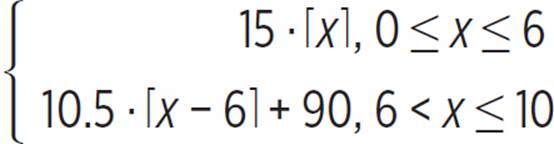
Only a number of hours
(x or x − 6) goes inside
the ceiling symbol,
because it is the
number of hours that
is rounded up to the
next whole number of
hours, not the charge
amount rounding up to
the next whole dollar.
Substitute various values for x to determine the levels of the steps. For example:
a(1) = 15 ⋅ ⌈1⌉ = 15 ⋅ 1 = 15
a(2.5) = 15 ⋅ ⌈2.5⌉ = 15 ⋅ 3 = 45
a(6) = 15 ⋅ ⌈6⌉ = 15 ⋅ 6 = 90
a(7) = 10.5 ⋅ ⌈7 − 6⌉ + 90 = 10.5 ⋅ ⌈1⌉ + 90 = 10.5 ⋅ 1 + 90 = 100.5
a(9.5) = 10.5 ⋅ ⌈9.5 − 6⌉ + 90 = 10.5 ⋅ ⌈3.5⌉ + 90 = 10.5 ⋅ 4 + 90 = 132
Here is a graph of a(x).

For an example of
how graph-modeling
questions appear on
the ACT, please access
the online Student
Tools for this book.


The total number of gallons in the tank will be 180, so the sum of the number of gallons of seawater and the number of gallons of freshwater must equal 180: s + f = 180.
A salinity of 1.5 parts per thousand can be written as 1.5/1000, or 0.0015. The salt content of the 180-gallon mix will be 0.0015 times 180. With a salinity of 35 ppt, the s gallons of seawater have a salt content of 0.035s. With a salinity of 0.5 ppt, the fgallons of freshwater have a salt content of 0.0005f. The sum of the amounts of salt in the saltwater and freshwater equals the amount of salt in the mixed waters.
0.035s + 0.0005f = 0.0015(180)
0.035s + 0.0005f = 0.27
So, the correct system of equations to use for modeling and solving this problem is the one shown in (A).

An eccentric rich philanthropist, Mrs. Z, held a contest, with the winning organization receiving their choice of the following: A) $10,000 per year for the next 50 years, or B) an account with a starting balance of $5, the contents of which Mrs. Z would double each year, for a maximum of the next 20 years. (The organization could choose to empty the account at any point during those 20 years but could not otherwise deposit to or withdraw from the account during that time.) After about how many years do the two prize options have the same value? Which one is the better option for fewer or more than that number of years?
A grant of $10,000 per year for x years adds up to 10,000x dollars. A starting balance of $5 doubled every year for x years can be modeled by the exponential expression 5 ⋅ 2x. To find where these prize values are equal, set the expressions equal to one another: 10,000x = 5 ⋅ 2x. To solve for x, we can define two functions as f(x) = 10,000x and g(x) = 5 ⋅ 2x, graph both functions on the same coordinate grid, and find the point where the graphs intersect. At that point, the x-value is the same for both functions, and they both have the same function value (f(x) = g(x)). The x-value of the point of intersection is the x-value that makes 10,000x = 5 ⋅ 2x true, so it is the solution to the equation.
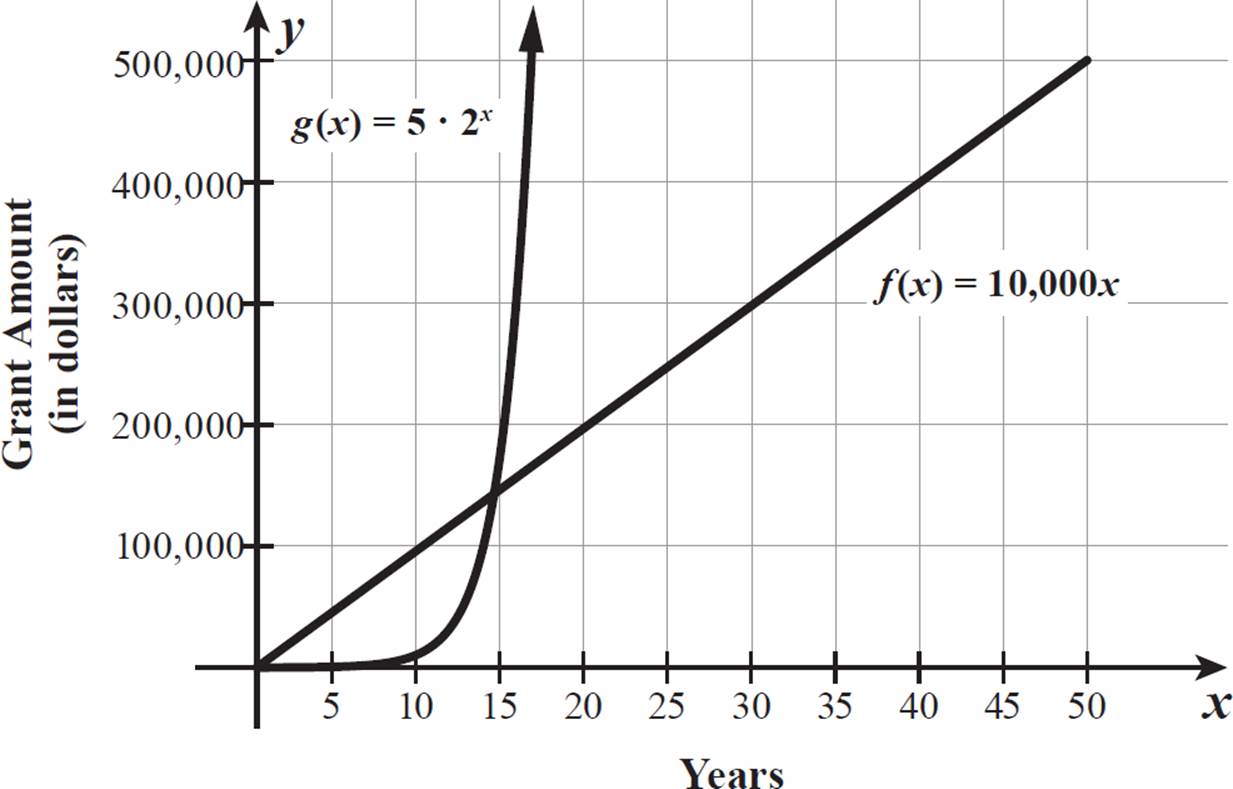
The two function graphs appear to intersect just to the left of 15, with a function value just under 150,000. The two prizes are worth close to the same amount after 15 years. For time periods less than 15 years, f(x) = 10,000x has a greater value, so option (A) is the better choice. For time periods more than 15 years, g(x) = 5 ⋅ 2x has a greater value, so option (B) is the better choice. This exponential function is continuing upward at a very fast rate here, so its endpoint, at x = 20, is not shown on this graph. The endpoint of f(x) = 10,000x is shown, at (50, 500,000).


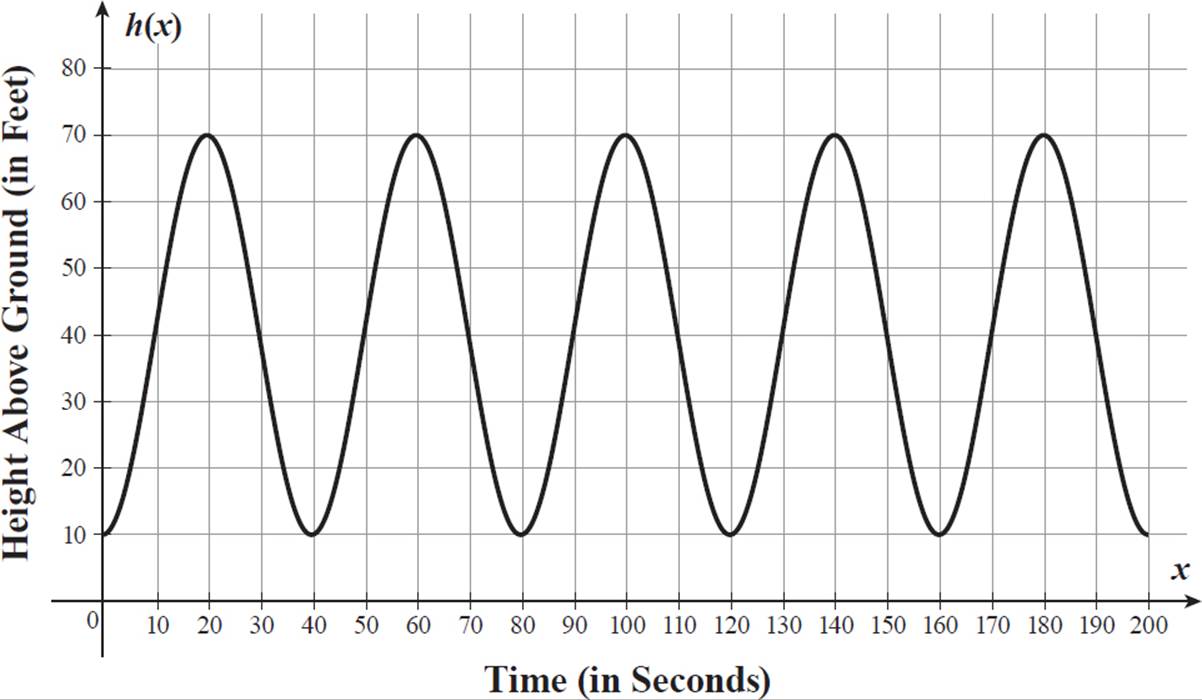
Sylvie went on a Ferris wheel ride. At the top point of the wheel, she was 70 feet above the ground, and at the bottom point, she was 10 feet above the ground. Her ride lasted for a total of 3 minutes and 20 seconds, and made 5 complete revolutions. Write and graph a function modeling Sylvie’s distance from the ground, h(x), in feet, x seconds into her ride.
A Ferris wheel is in the shape of a circle, so the relationship of points along the circle (measured as a central angle measurement) to height above the ground is modeled by a sine or cosine function. Because the Ferris wheel rotates at a constant speed, time is directly proportional to the central angle measure, so the type of function that relates time to height above ground is also a sine or cosine function. Sylvie’s ride begins at the minimum height, so let’s use a cosine function, which starts at its maximum height when x = 0, but starts at its minimum height when reflected across its midline.
This problem is similar
to Example 20 in
Chapter 4, Lesson
4.6, which also
involves translating a
real-life situation to a
trigonometric function
equation and graph.
The motion involved
is still along the arc
of a circle, but in this
case, the motion is
multiple revolutions
of a complete circle.
The Ferris wheel completes 5 revolutions in 3 minutes and 20 seconds, or 200 seconds total, so it completes one full revolution in 200 ÷ 5 = 40 seconds. The period of the cosine curve must be 40 seconds. The period of a cosine function of the form y = a cosb(x − c) + d is 2π/b. We can set 2π/b equal to 40 to solve for b.
2π/b = 40
2π = 40b
2π/40 = b
b = π/20
The Ferris wheel carries Sylvie from a minimum height of 10 feet to a maximum height of 70 feet, so the minimum of the cosine curve is 10 and the maximum is 70. The distance between them is 60, so the amplitude of the cosine curve is 30. The midline is halfway between 10 and 70:  = 40.
= 40.
A cosine function y = a cos b(x − c) + d with an amplitude of 30 (|a| = 30), a period of 40 (b = π/20), no horizontal shift (c = 0), a midline of 40 (d = 40), and reflection across the midline (negative a-value) is y = −30 cos π/20 x + 40. The domain of our function is the time period that Sylvie was riding the Ferris wheel, from x = 0 to x = 240 seconds. The function modeling Sylvie’s distance from the ground after x seconds on the Ferris wheel is h(x) = −30 cos π/20 x + 40, for 0 ≤ x ≤ 240. This function is graphed below.


Zach wants to start selling cupcakes at his bakery, which currently sells only cakes and cookies. From his research, he has learned that the demand curve for cupcakes in the neighborhood is given by the function n = −20p2 + 500, where nrepresents the number of cupcakes sold per day and p represents the price per cupcake. Zach’s cost in ingredients and labor is $1 per cupcake. Write and graph a function f(p) modeling Zach’s daily profit in terms of p, the price per cupcake, in dollars. According to this function, at what price should Zach sell his cupcakes, to the nearest 5 cents? If it turns out that Zach only has the baking capacity for a maximum of 240 cupcakes per day, how does this change your answer for the price at which he should sell his cupcakes? Draw a new graph of the profit function, as a piecewise-defined function, to illustrate your answer.
The demand curve n = −20p2 + 500 tells us how many cupcakes, n, will be sold at price p. The total revenue is the price per cupcake multiplied by the number of cupcakes sold, so revenue r = p ⋅ n = p(−20p2 + 500). This simplifies as r = −20p3 + 500p. Zach’s cost for making n cupcakes at $1 per cupcake is n dollars. Substitute the expression for n in terms of p: cost c = −20p2 + 500. Zach’s profits are his revenue minus his cost, so f(p) = r − c = (−20p3 + 500p) − (−20p2 + 500). Simplified, f(p) = −20p3 + 20p2 + 500p− 500. The graph of this function is shown below, with a domain of 0 ≤ p ≤ 5.
The price per cupcake
cannot be negative, so
p must be greater than
or equal to 0. When
p = 5, the profit is
equal to 0, which
means that 0 cupcakes
were sold. At that
price, there is no
longer any demand
for them. So, the
circumstances require
a domain restriction
to 0 ≤ p ≤ 5.
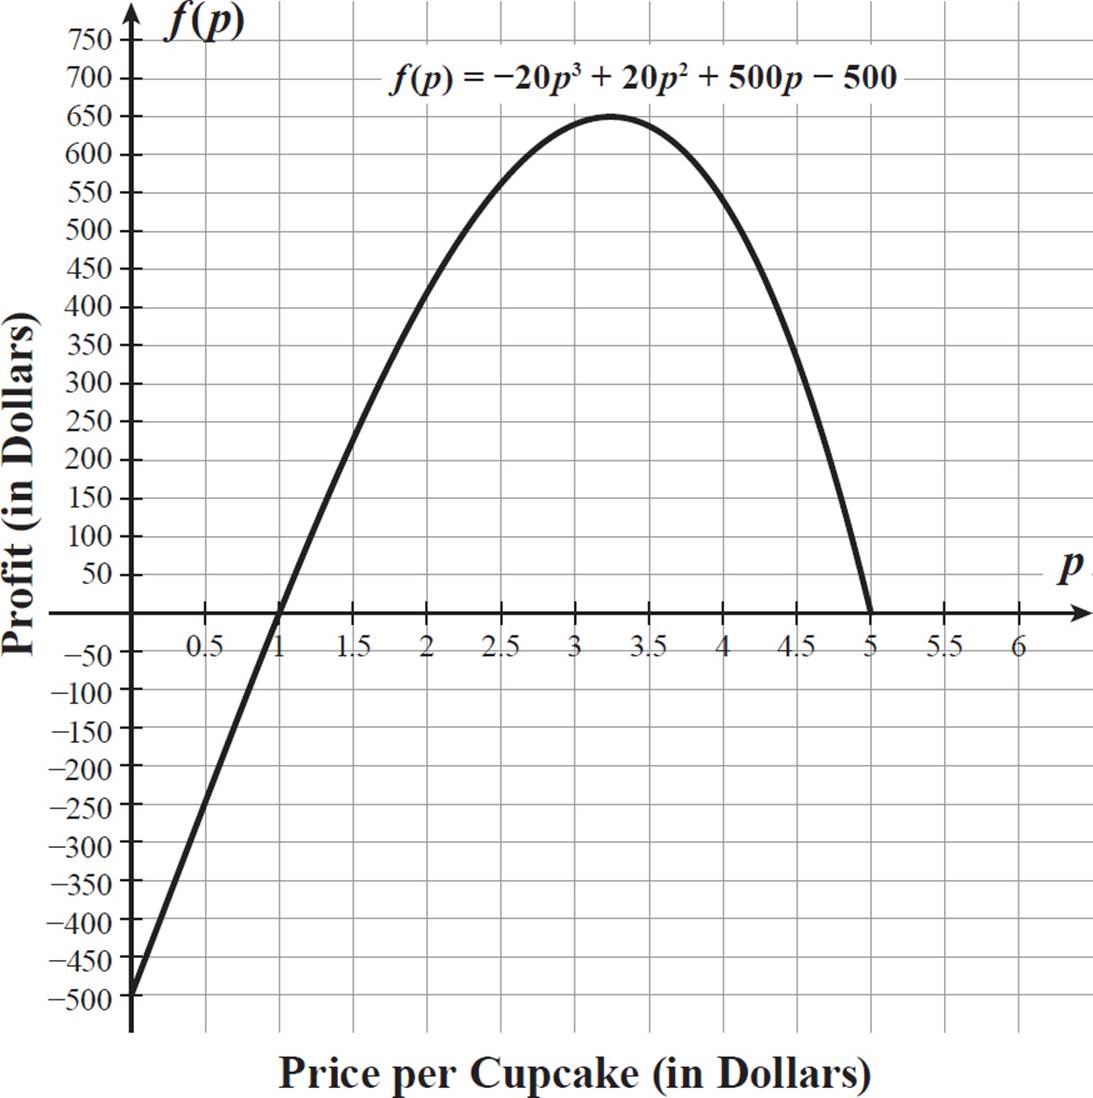
The maximum of this curve is about 650 and occurs around p = 3.24. To maximize his profit, Zach should set the price of a cupcake at $3.25.
Up until this point,
this problem has been
similar to Example 21
in Chapter 1, Lesson
1.6, where we also
used a demand curve
and cost information
to write and graph a
profit curve, solving
for the price point
for maximum profit.
However, in this
situation, there is
a limiting factor,
which changes
the profit function
to a piecewise-
defined function.
If Zach’s bakery can only bake a maximum of 240 cupcakes per day, then the profit function changes. The demand curve only reflects the number of cupcakes sold when its value is less than or equal to 240. Set −20p2 + 500 less than or equal to 240 to represent this limitation.
|
−20p2 + 500 ≤ 240 |
|
|
−20p2 ≤ −260 |
Subtract 500 from both sides. |
|
p2 ≥ 13 |
Divide both sides by −20, including flipping the inequality sign. |
|
p ≥ 3.606 |
Evaluate the positive square root of 13. |
So, the number of cupcakes sold is given by n = −20p2 + 500 only when price p is greater than or equal to $3.61. When the price is $3.60 or less, the number of cupcakes sold is 240, the maximum the bakery can produce, even though the demand is greater. For 240 cupcakes sold, the revenue is 240p and the cost is 240(1), so the profit is 240p − 240. So, Zach’s cupcake profits, f(p), are given by the piecewise-defined function shown below.
The variable p
represents the price
per cupcake, so it must
be a positive number.
You only need to solve
for the positive square
root of 13 in this case.
The graph of the piecewise-defined profit function is shown below.
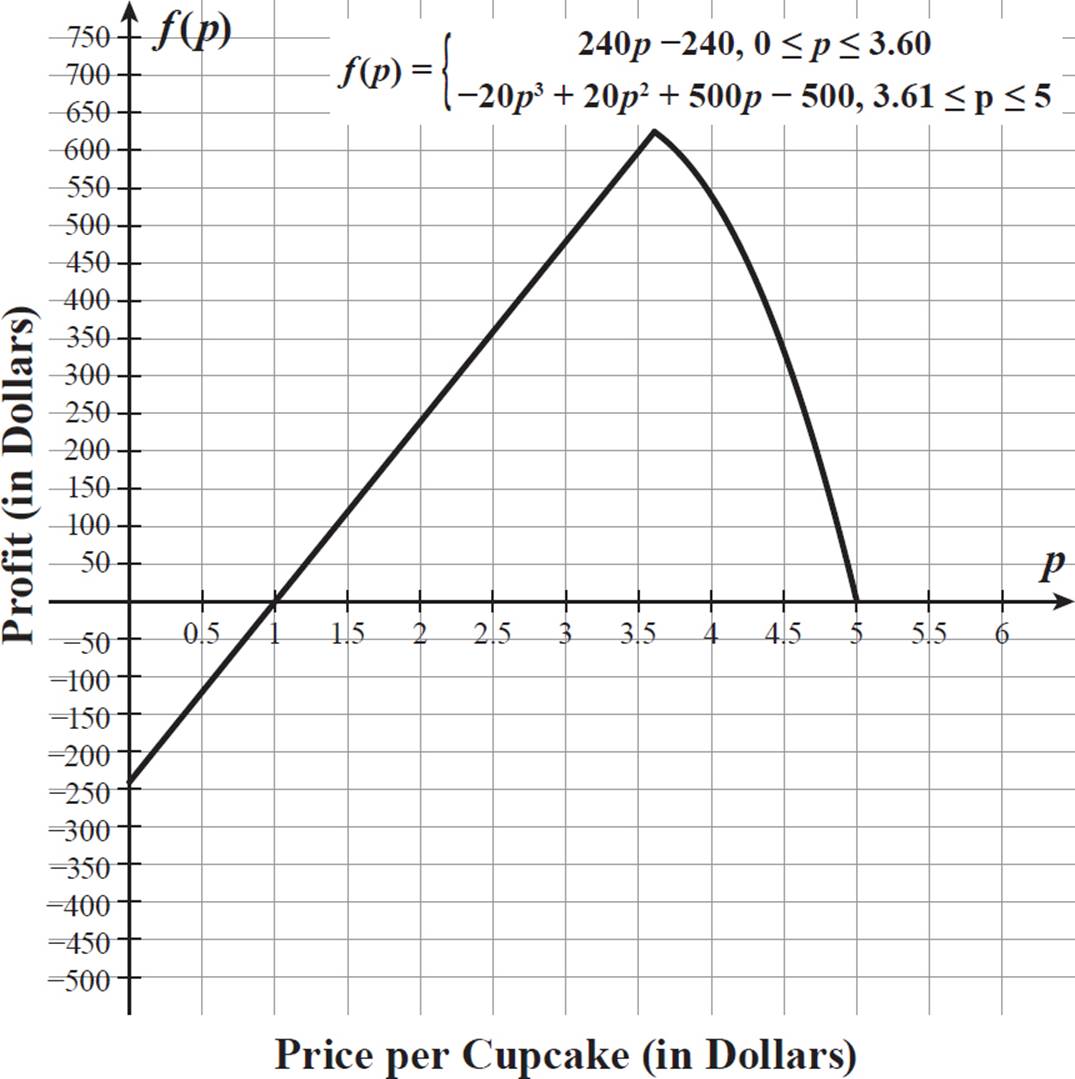
We can use the function to compare profits for a unit price of $3.60 and a unit price of $3.65.
f(3.6) = 240(3.6) − 240 = 624
f(3.65) = −20(3.653) + 20(3.652) + 500(3.65) − 500 ≈ 619
In this case, with a maximum baking capacity of 240 cupcakes per day, Zach should set the price of a cupcake at $3.60.
You can use your
graphing calculator to
track the function
and/or calculate
f(3.65).

DRILL
CHAPTER 7 PRACTICE QUESTIONS
Click here to download a PDF of Chapter 7 Practice Questions.
Directions: Complete the following open-ended problems as specified by each question stem. For extra practice after answering each question, try using an alternative method to solve the problem or check your work.
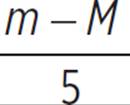
1. The formula below represents the distance modulus of a star, or the difference between the star’s apparent magnitude (how bright it appears from Earth), m, and its absolute magnitude (how bright it actually is), M, in terms of d, the distance of the star from Earth, in parsecs.
m − M = 5log10(d − 5)
Write a formula that gives d in terms of m and M. If one parsec is equal to about 3.26 light-years, then what equation produces distance D in light-years?
2. Since the year 2000, the number of regular subscribers to a certain magazine can best be described by the function s(x) = 1200 ⋅ 0.83x, where s(x) is the number of subscribers x years after the year 2000. Is this function always increasing or always decreasing? What is the y-intercept of this function’s graph, and what does it represent? If the number of magazine subscribers continues to follow this function, how many subscribers will there be in the year 2050?
3. Dianna has found that pants in the same labeled size made by different clothing brands have different sized waists, so she measures the waistband for each pair of pants she considers buying. Her ideal pants waistband measures 72 cm, but she still likes the fit of waistbands within 2.5 cm of this measure. Write an inequality that can be solved for w, the waistband measures Dianna prefers for her pants. If everyone preferred pants waistbands within 2.5 cm of their individual ideal waistband measure, m, then what inequality relates w and m?
4. Brian’s yard is a rectangle, 40 feet long and 20 feet wide. He plans to put a walkway of width w feet around the border, within his yard, based on the area, a, of the middle portion of the yard enclosed by this walkway. Write and graph a function for w, the width of the walkway, in feet, in terms of a, the area of the enclosed yard space, in square feet.
5. Shervin flew a helicopter in a flight that rose above and dipped below an altitude of 5000 feet according to the function h(t) = −t 4 + 10t3 − 29t 2 + 20t, where t represents time in minutes (since he first reached 5000 feet) and h(t) represents the distance in feet above an altitude of 5000 feet. At what time was Shervin’s helicopter exactly at an altitude of 5000 feet?
6. The AC power outlet at Zawadi’s home has a voltage v(t) that follows the sine curve v(t) = 120![]() ⋅ sin(120πt), shown below, where t represents time in seconds.
⋅ sin(120πt), shown below, where t represents time in seconds.
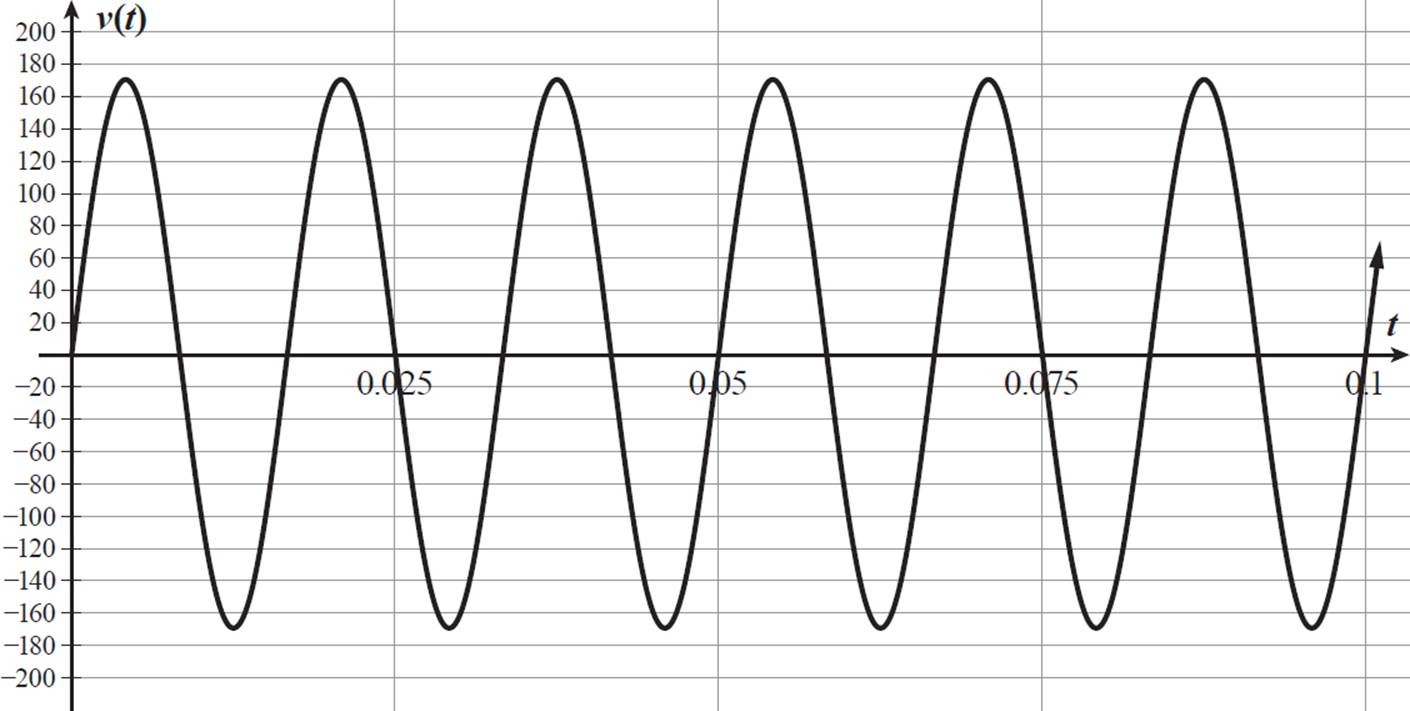
(a) The frequency of alternating current is defined in hertz, which are cycles per second. What is the hertz measurement for Zawadi’s power supply?
(b) The peak-to-peak value of an AC voltage is twice the amplitude of the voltage sine curve. What is the peak-to-peak voltage of Zawadi’s power supply, to the nearest tenth of a volt?
7. When the quarterback of the school football team caught the football, he saw a wide receiver 12 yards away from him. He watched the receiver run away from him for 1 second then threw the football at a speed 3.5 times the speed of the receiver, who continued to run at a steady rate. The receiver caught the ball 28 yards away from the quarterback, who had remained stationary. Write a function that relates t, the time in seconds since the quarterback caught the football, to r, the wide receiver’s speed, in yards per second, for both the receiver’s run and the ball’s path through the air. Graph both functions on the same coordinate grid. What do the r- and t-values of the point of intersection represent in this situation? At what speed did the football travel through the air?
SOLUTIONS TO CHAPTER 7 PRACTICE QUESTIONS
1. D = 3.26 ⋅ 10 + 16.3
To find an equation that shows the variable d equal to an expression in terms of m and M, you must solve the given formula for d. Use inverse operations to “undo” everything that has been done to d.
|
|
Divide both sides by 5. |
|
10 |
Use the definition of a logarithm to rewrite as an exponential equation. |
|
10 |
Add 5 to both sides. |
 = log10(d − 5)
The formula that gives distanced, in parsecs, in terms of m and M is d = 10 + 5.
+ 5.
If one parsec is equal to 3.26 light-years, then d parsecs are equal to 3.26d light-years. Distance, D, in light-years, is equal to 3.26d. Set D equal to 3.26 times the expression we found for d. The formula that gives distance D, in light-years, in terms of m and M isD = 3.26(10 + 5), or D = 3.26 ⋅ 10 + 16.3.
2. always decreasing, y-intercept represents 1200 subscribers in 2000, and there will be no subscribers in 2050.
This is an exponential function with a base that is less than 1 (0.83 < 1.00) and a positive coefficient, so it is always decreasing. For each increase of x by 1, the function value is multiplied by 0.83, which produces a smaller function value. The magazine has been losing subscribers since the year 2000.
The y-intercept (or s(x)-intercept) occurs when x = 0, so substitute 0 for x and solve for s(x).
s(0) = 1200 ⋅ 0.830 = 1200 ⋅ 1 = 1200
The y-intercept for this function is 1200. The variable x is years after 2000, and the function value, s(x), is the number of subscribers, so the y-intercept tells you that there were 1200 subscribers to this magazine in the year 2000.
The year 2050 is 50 years after 2000, so use x = 50. When x = 50, s(x) = 1200 ⋅ 0.8350 ≈ 0.1. The s(x)-value represents the number of subscribers, so we must round to the nearest whole number, which is 0. If the function pattern continues, the magazine will have no subscribers by 2050.
3. |w − m| ≤ 2.5
Dianna prefers pants waistbands that are within 2.5 cm of 72 cm, whether greater than or less than 72 cm. Use an absolute value to represent the difference between the actual waistband measure and 72 cm, as a positive value: |w − 72|. Set this positive difference less than or equal to 2.5, to represent Dianna’s preference that the difference be within 2.5 cm.
|w − 72| ≤ 2.5
To solve for w, we could graph f(w) = |w − 72| and find the w-values for f(w)-values less than or equal to 2.5. Or, we could solve algebraically for cases where (w − 72) is positive and negative.
|
If |
w − 72 ≥ 0: |
If |
w − 72 < 0: |
|
w − 72 ≤ 2.5 |
−(w − 72) ≤ 2.5 |
||
|
w ≤ 74.5 |
−w + 72 ≤ 2.5 |
||
|
−w ≤ −69.5 |
|||
|
w ≥ 69.5 |
Dianna’s preferred pants waistband measurements are given by 69.5 ≤ w ≤ 74.5.
If everyone preferred pants with waistbands within 2.5 cm of m, a personal ideal waistband measure, then the absolute difference between w and m must be less than or equal to 2.5 cm: |w − m| ≤ 2.5.
4. w = 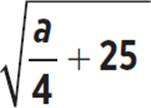 + 15; see graph on following page
To better visualize the problem, draw a sketch of the yard with walkway. Brian’s entire yard is 40 feet long and 20 feet wide. The walkway is within the yard, at its border, with a width everywhere (on every side) of w feet.
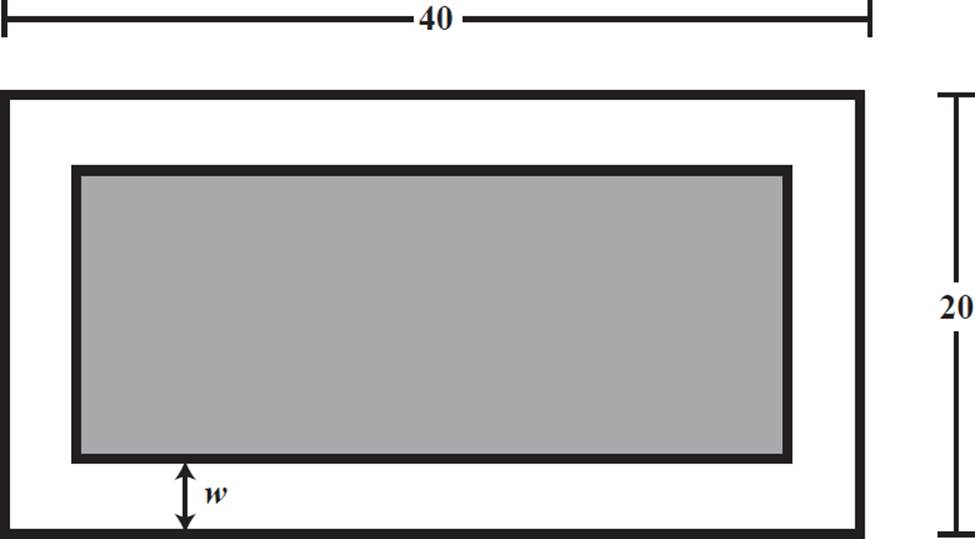
The area of the middle portion of the yard enclosed by the walkway (the shaded part in the sketch), in square feet, is defined as a. To calculate this area, you would multiply the length and width of this central rectangle. Use the dimensions given in the diagram to write expressions for the length and width. The length of this central rectangle is the full 40-foot length of the yard minus the walkway space on either side, or 40 − 2w. Similarly, the width of this enclosed portion of the yard is 20 − 2w. Write an equation using the fact that a rectangle’s area is equal to its width times its length.
|
a = (20 − 2w)(40 − 2w) |
|
|
a = 800 − 120w + 4w2 |
Expand using FOIL. |
We want an equation that gives w in terms of a, so solve this equation for w.
|
4w2 − 120w + 800 = a |
Rearrange terms. |
|
4(w2 − 30w + 200) = a |
Factor out 4 on the left side of the equation. |
|
w2 − 30w + 200 = a/4 |
Divide both sides by 4. |
To solve for w alone, we need to write a perfect square of a binomial containing w. To do that, we need to complete the square for w2 − 30w. Half of −30w is −15w, so we want to build (w − 15)2, or w2 − 30w + 225.
|
w2 − 30w = a/4 − 200 |
Subtract 200 from both sides. |
|
w2 − 30w + 225 = a/4 − 200 + 225 |
Add 225 to both sides, to complete the square on the left. |
|
(w − 15)2 = a/4 + 25 |
Rewrite the quadratic as the square of a binomial. |
|
w − 15 = ± |
Take the square root of both sides. |
|
w = ± |
Add 15 to both sides. |
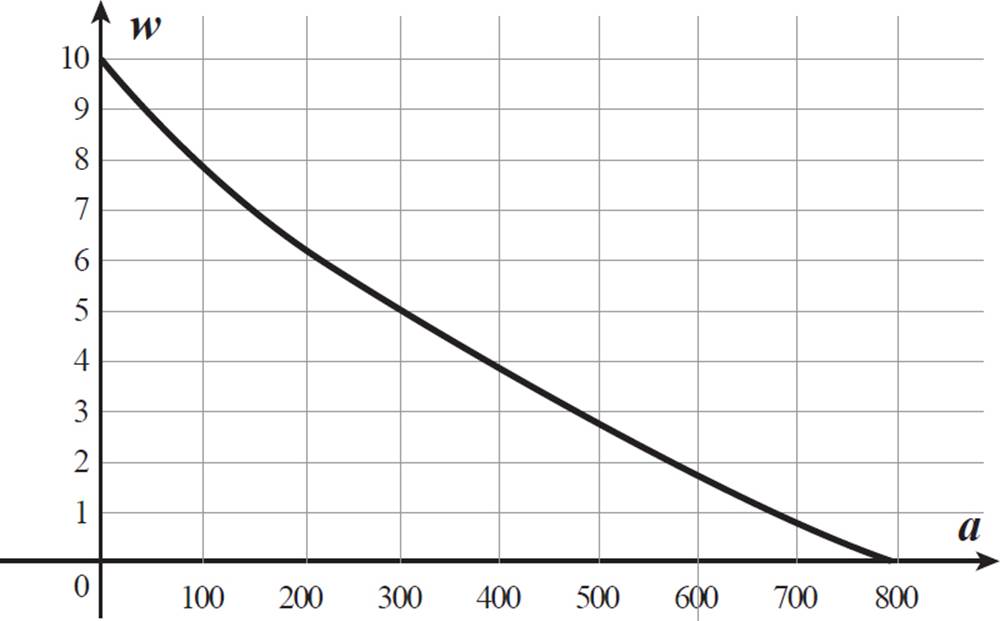
Although this is a relation, it is not a function, because of the ± symbol. The graph of this relation is a sideways parabola, but the situation describes a function relationship, so you must decide which portion of the parabola represents the situation. As the area of the enclosed portion in the middle of the yard increases, the width of the walkway decreases, so the function should be always decreasing. So, the lower half of the parabola, or w = − 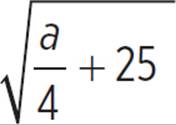 + 15 matches the situation.
However, you must also consider what domain is appropriate to the situation. The area of the central portion of the yard must be between 0 and the full area of the yard, 40 ⋅ 20 = 800 square feet, so 0 ≤ a ≤ 800. (Realistically, the domain might be further reduced, to provide at least some walkway or at least some central area within the walkway, but we do not have any further information to specifically define those domain restrictions.) The graph of w = − + 15 with domain 0 ≤ a ≤ 800 is shown below.
5. 0, 1, 4, and 5 minutes
In this situation, h(t) is the helicopter’s height above an altitude of 5000 feet, so negative values of h(t) represent locations of the helicopter below the 5000-foot level. The helicopter is at exactly 5000 feet in altitude whenever h(t) = 0. This function is a polynomial function, so when it is fully factored, it clearly indicates its zeros.
First, pull out the common factor of −t.
−t4 + 10t3 − 29t2 + 20t = −t(t3 − 10t2 + 29t − 20)
According to the Rational Root Theorem, zeros of the cubic t3 − 10t2 + 29t − 20 will be in the set ±{1, 2, 4, 5, 10, 20}. Because the variable t in this situation is always positive (time passed), the zeros must be positive. Let’s test t = 1 in the original function, using the Remainder Theorem.
h(1) = −14 + 10(13) − 29(12) + 20(1)
= −1 + 10 − 29 + 20
= 0
Because h(1) = 0, (t − 1) is a factor of h(t). Now we must factor (t − 1) out of (t3 − 10t2 + 29t − 20), using long division.
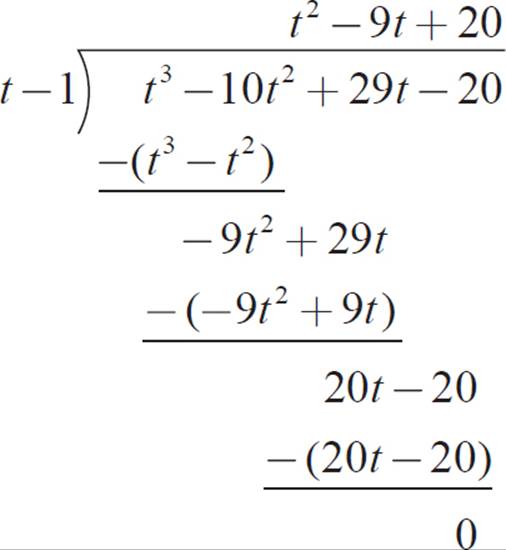
So, h(t) = −t(t − 1)(t2 − 9t + 20), which fully factors as h(t) = −t(t − 1)(t − 4)(t − 5). In this form, we can see that the zeros of the function h(t) are 0, 1, 4, and 5. The helicopter is at an altitude of 5000 feet 0, 1, 4, and 5 minutes after initially reaching that level.
6. 339.4 volts
In the sine graph shown, 6 full cycles are completed in 0.1 second. We can set up and solve a proportion to find the number of cycles completed in 1 second.
|
6/0.1 = x/1 |
Write the equivalent ratios of cycles to seconds. |
|
6 = 0.1x |
Cross-multiply. |
|
60 = x |
Multiply both sides by 10. |
There are 60 cycles per second, so Zawadi’s power supply has a frequency of 60 hertz.
The sine curve appears to reach a maximum of 170 and a minimum of −170, so the graph indicates an amplitude of about 170, or a peak-to-peak of 340 volts. However, we can find a more precise answer using the given equation. The amplitude of a sine function of the form y = a sin b(x − c) + d is |a|. In the function v(t) = 120![]() ⋅ sin(120πt), a = 120
⋅ sin(120πt), a = 120![]() , so |a| = 120
, so |a| = 120![]() . We must multiply this amplitude by 2 to get the peak-to-peak voltage: 240
. We must multiply this amplitude by 2 to get the peak-to-peak voltage: 240![]() . Use a calculator to find that 240
. Use a calculator to find that 240![]() = 339.4, to the nearest tenth. The peak-to-peak value of Zawadi’s power supply is 339.4 volts.
= 339.4, to the nearest tenth. The peak-to-peak value of Zawadi’s power supply is 339.4 volts.
7. see functions and graph below; football travels at 28 yards per second The problem concerns the relationship between distance, rate, and time, which is given by d = rt. In this case, you must write a function for time in terms of rate and distance, so rewrite this formula as t = d/r.
The wide receiver ran at a steady rate, from when the quarterback caught the football (t = 0, because t is defined as seconds since the quarterback caught the ball) until he caught the pass. His running speed, in yards per second, is defined as r. To find the distance he ran, we can subtract his original distance from the quarterback, 12 yards, from his final distance of 28 yards from the quarterback, when he caught the ball.
d = 28 − 12 = 16
So, the function t = 16/r describes the receiver’s run.
The football travels a total distance of 28 yards through the air, at a speed 3.5 times the speed of the wide receiver, or 3.5r. So, the time the football is in the air is equal to 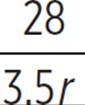 , which can be simplified as 8/r. However, t is the time since the quarterback caught the football, and he waited 1 second before throwing the ball. So, for the football, t = 1 + 8/r.
Both functions are graphed on the coordinate grid below.
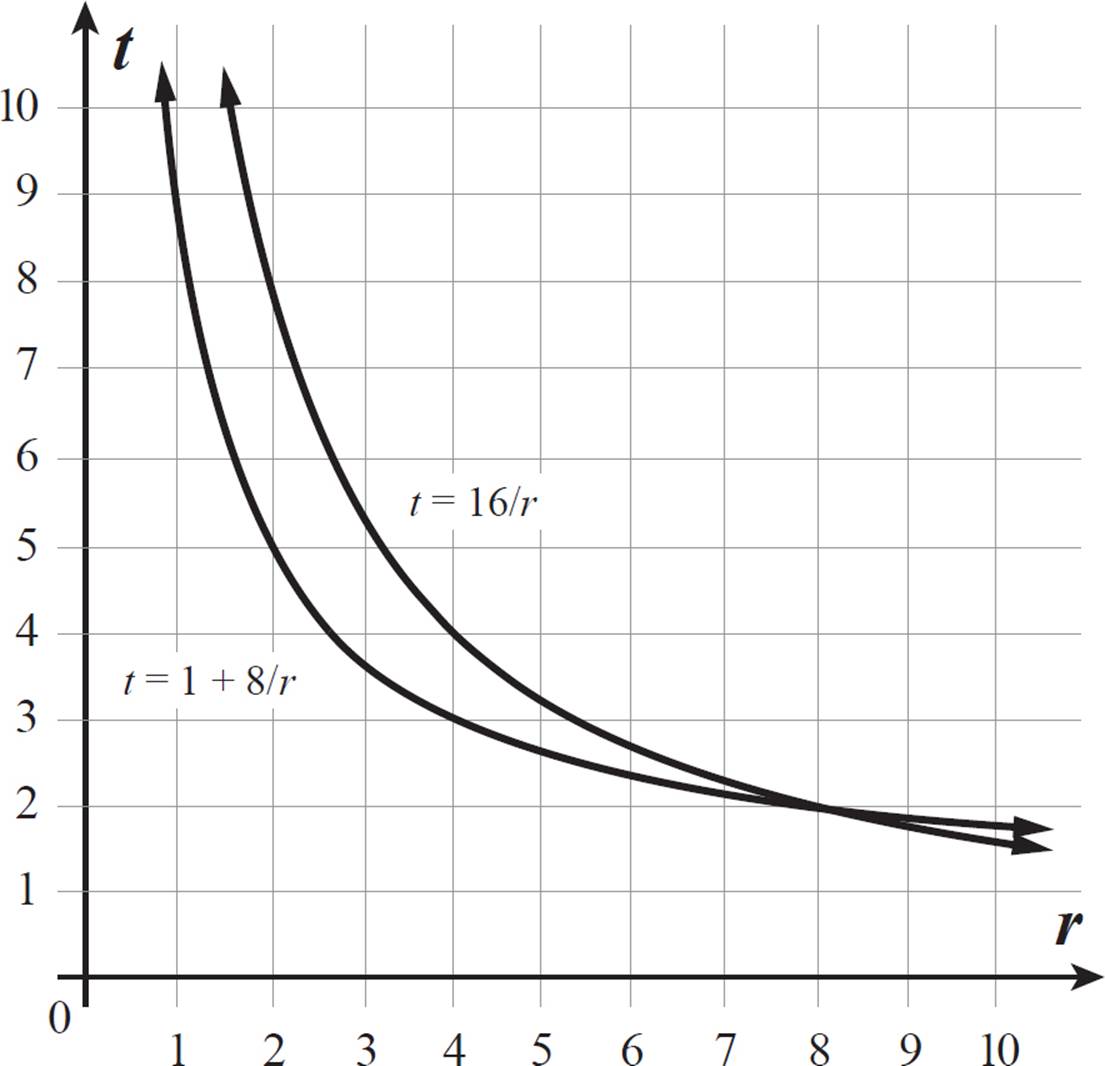
The graphs intersect at the point (8, 2), where r = 8 and t = 2. Both functions were written to express the situation where the ball and the wide receiver each traveled the necessary distance to end up at the same location, for a successful pass. But, in order for the pass to succeed, they must also arrive there at the same time. The r-value that produces the same t-value in both functions is 8. So, the wide receiver’s speed was 8 yards per second. The t-value of 2 means that the receiver caught the ball 2 seconds after the quarterback caught the ball.
The quarterback threw the ball with a speed of 3.5 times the running speed of the wide receiver, so the football traveled through the air at a speed of 3.5 ⋅ 8 = 28 yards per second.
REFLECT
Congratulations on completing Chapter 7!
Here’s what we just covered.
Rate your confidence in your ability to
•Manipulate given equations to solve for certain variables or to reveal properties of functions
1 2 3 4 5
•Determine key features of functions from equations, tables, and graphs, and interpret those features in the context of the situations described by the functions
1 2 3 4 5
•Model described situations with equations and inequalities, and use them to solve problems
1 2 3 4 5
•Model described situations with graphs, and use them to solve problems
1 2 3 4 5
If you rated any of these topics lower than you’d like, consider reviewing the corresponding lesson before moving on, especially if you found yourself unable to correctly answer one of the related end-of-chapter questions.
 Access your online student tools for a handy, printable list of Key Points for this chapter. These can be helpful for retaining what you’ve learned as you continue to explore these topics.