Master AP Calculus AB & BC
Part II. AP CALCULUS AB & BC REVIEW
CHAPTER 2. Calculus Prerequisites
POLAR EQUATIONS (BC TOPIC ONLY)
Polar equations are a very handy way to express complex graphs very simply. However, the polar system utilizes a completely different coordinate axis and graphing system. Once you warm up to polar coordinates, it’s not too hard to bear them.
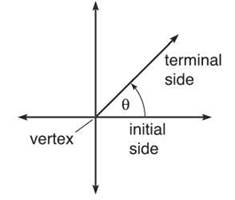
All polar points are given in the form (r,θ), where θ is an angle in standard position and r is a distance along the terminal ray of that angle. Therefore, in order to graph a polar coordinate, first draw the angle specified by 0, and then count r units along the terminal ray.
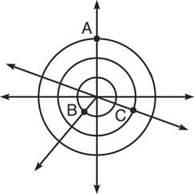
Example 17: Graph the polar coordinates ![]()
Solution:
NOTE. The origin is also referred to as the pole when graphing—hence the name of polar equations.
Point A is graphed on the terminal ray of π/2 (or 90°), the positive y-axis. Count 3 units along this ray from the origin to place A. B is one unit away from the origin at θ = —3π/4. C is just a little trickier. After drawing the angle θ = 5π/6, you count two units backward from the origin, as r is given as —2. Therefore, C ends up in the fourth quadrant rather than the second, as you might have hypothesized.
Graphing polar equations consists of nothing more than plotting a series of polar points (as you just did) and connecting the resulting dots. Just as was the case for parametric graphs, a table of values and the calculator are your main graphing tools.
Example 18: Graph r = 4sin 2θ without weeping.
TIP. Choose polar mode by pressing the “Mode” button on your calculator. The “Y=” screen now functions as as the “r=” screen, and pressing the x,t,θ button will display θ.
Solution: To solve this, we will allow 0 to take on values from 0 to 2π and find the corresponding r values. The table below gives the major angles of the first quadrant, and the result, r, when those angles, θ, are plugged into r = 4sin 2θ. If you continue this process for the other three quadrants, you will obtain a similar shape.
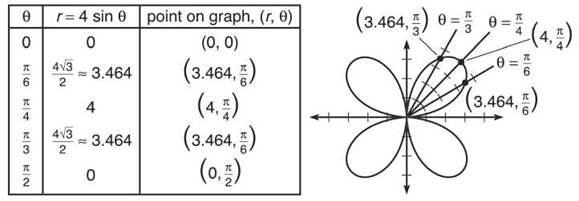
NOTE. The graph of r = 4sin 2θ is called a rose curve, since it sort of looks like a flower. More common polar graphs a re given in the exercises.
It is important that you know how polar graphs are created, but it is expected that you will typically graph them on your calculator. The AP test is more focused on applying different skills to polar and parametric equations, rather than focusing on simply graphing them. So, don’t spend too much time honing your skills and trying to graph these quickly—make use of your technology.
Although you practiced converting parametric equations to rectangular form, no such practice follows suit for polar equations. As you saw in Example 18, the graphs can be quite complicated, and the major strength of polar graphing is the ease with which such complicated graphs can be formed. There’s no need to strong-arm the equations into rectangular form. It is interesting, however, how simply polar coordinates can be converted into rectangular coordinates and vice versa. Well, at least it is interesting to me. A little.
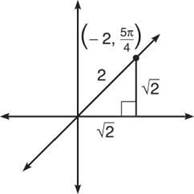
Example 19: Convert the polar coordinate (—2,5π/4) into a rectangular coordinate.
Solution: Any polar coordinate (r,θ) can be transformed into the corresponding rectangular coordinate (x,y) with the formulas x = rcosθ and y = rsinθ. Therefore, (—2, 5π/4) becomes the rectangular coordinate ![]() The diagram below gives a visual proof of this—the right triangle created by the polar coordinate and the axes is a 45-45-90 isosceles right triangle with hypotenuse 2. Basic geometry verifies that the legs have length √2.
The diagram below gives a visual proof of this—the right triangle created by the polar coordinate and the axes is a 45-45-90 isosceles right triangle with hypotenuse 2. Basic geometry verifies that the legs have length √2.
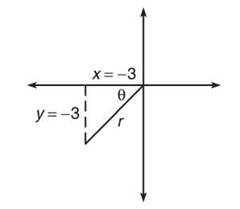
Example 20: What polar coordinate corresponds to the rectangular coordinate (-3,-3)?
Solution: Notice that ![]() Tangent has a value of 1 at θ = π/4 and 5π/4, but the correct answer is 5π/4 since you are working in the third quadrant. All that remains, then, is to find r, which is very easy to do thanks to good old Pythagoras. By the Pythagorean Theorem, (—3)2 + (—3)2 = r2, so r = √18 = 3√2. Thus, the correct polar coordinate is (3√2,5π/4).
Tangent has a value of 1 at θ = π/4 and 5π/4, but the correct answer is 5π/4 since you are working in the third quadrant. All that remains, then, is to find r, which is very easy to do thanks to good old Pythagoras. By the Pythagorean Theorem, (—3)2 + (—3)2 = r2, so r = √18 = 3√2. Thus, the correct polar coordinate is (3√2,5π/4).
EXERCISE 7
Directions: Solve each of the following problems. Decide which is the best of the choices given and indicate your responses in the book.
YOU MAY USE A GRAPHING CALCULATOR FOR PROBLEMS 4 AND 5.
1. Graph the following polar equations without a table of values:
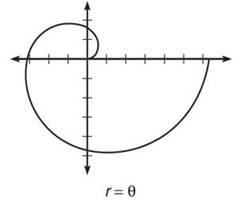
2. Predict the graph of r = θ, 0 ≤ θ ≤ 2π, and justify your prediction.
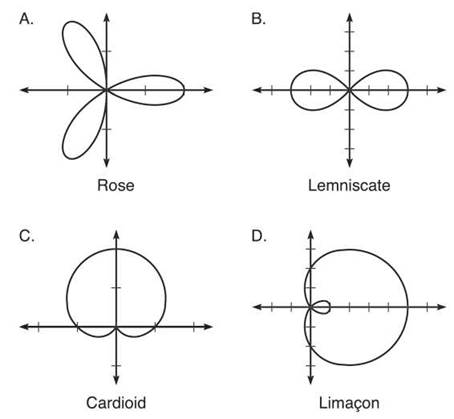
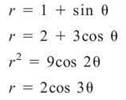
3. Below are examples of common polar curves. Match the graphs to the correct equations below.
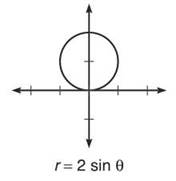
4. Graph r = 2sin θ.
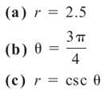
5. Convert:
(a) ![]() to rectangular coordinates
to rectangular coordinates
(b) ![]() to polar coordinates.
to polar coordinates.
ANSWERS AND EXPLANATIONS
1. (a)
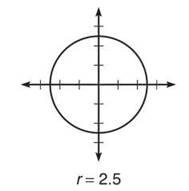
The graph will have a radius of 2.5, regardless of the angle θ. Does this sound familiar? Yep...it’s a circle with radius 2.5.
(b)
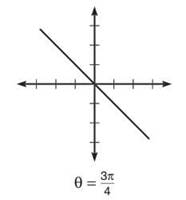
In this case, only the angle comes into play. Along that angle, any radius is fair game. The result is a line that corresponds to the angle indicated. Notice that the line stretches into the fourth quadrant (because the negative radii are possible).
(c)
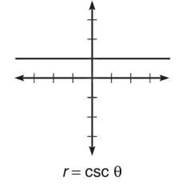
If you rewrite r = csc θ as 1/sin θ and cross-multiply, the result is rsin θ = 1. However, according to Example 19, we know that y = rsin θ. Therefore, rsin θ = 1 becomes the equation y = 1, a horizontal line.
2. Clearly, you begin the graph at the pole, as r = θ = 0. As 0 increases (moving counterclockwise), your radius (being equal) increases also. Therefore, the further you rotate, the longer the radius, forming a spiral.
3. These problems are simply a study in testing points. Once you choose a significant number of angles and plug them into each of the formulas, you can begin to see which graphs could represent those equations.
(A) r = 2cos 3θ: Arose curve has “petals,” but not necessarily only three petals, as in this particular graph.
(B) r2 = 9cos 2θ: A lem niscate is in the shape of a figure eight that you can skate.
(C) r = 1 + sin θ: A cardioid curve looks a little bit like a heart, hence the name. To me, it looks more like a tush print in a recliner.
(D) r = 2 + 3cos θ: A limacon may or may not have the puckered loop evident in this graph—without the loop, a limacon looks like a less rounded cardioid.
4. A calculator or a table of values results in the graph below. Make sure you can do these by either method.
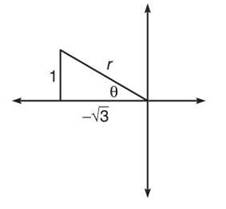
5. (a) Use the polar coordinate to create a right triangle, from which it is clear that x = —√3 and y = 1. You can also use the formulas from Example 19. For instance ![]() The y-coordinate will work just as easily.
The y-coordinate will work just as easily.
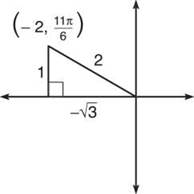
(b) Once again, a graph is very helpful; from the diagram below, tan θ = 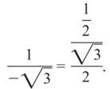 Therefore, θ = 5π/6. Use the Pythagorean Theorem to find r: 12 + (—√3)2 = r2, so r = √4. One appropriate polar coordinate is (2,5π/6).