5 Steps to a 5: AP Calculus AB 2017 (2016)
STEP 2
Determine Your Test Readiness
CHAPTER 3 Take a Diagnostic Exam
CHAPTER 3
Take a Diagnostic Exam
IN THIS CHAPTER
Summary: Get started in your review by working out the problems in the diagnostic exam. Use the answer sheet to record your answers. After you have finished working the problems, check your answers with the answer key. The problems in the diagnostic exam are presented in small groups matching the order of the review chapters. Your results should give you a good idea of how well you are prepared for the AP Calculus AB exam at this time. Note those chapters that you need to study the most, and spend more time on them. Good luck. You can do it.

Key Ideas
![]() Work out the problems in the diagnostic exam carefully.
Work out the problems in the diagnostic exam carefully.
![]() Check your work against the given answers.
Check your work against the given answers.
![]() Determine your areas of strength and weakness.
Determine your areas of strength and weakness.
![]() Identify and mark the pages that you must give special attention.
Identify and mark the pages that you must give special attention.
DIAGNOSTIC TEST ANSWER SHEET
3.1 Getting Started!
Taking the Diagnostic Test helps you assess your strengths and weaknesses as you begin preparing for the AP Calculus AB exam. The questions in the Diagnostic Test contain both multiple-choice and open-ended questions. They are arranged by topic and designed to review concepts tested on the AP Calculus AB exam. All questions in the Diagnostic Test should be done without the use of a graphing calculator, except in a few cases where you need to find the numerical value of a logarithmic or exponential function.
3.2 Diagnostic Test
Chapter 5
1 . Write an equation of a line passing through the origin and perpendicular to the line 5x – 2y = 10.
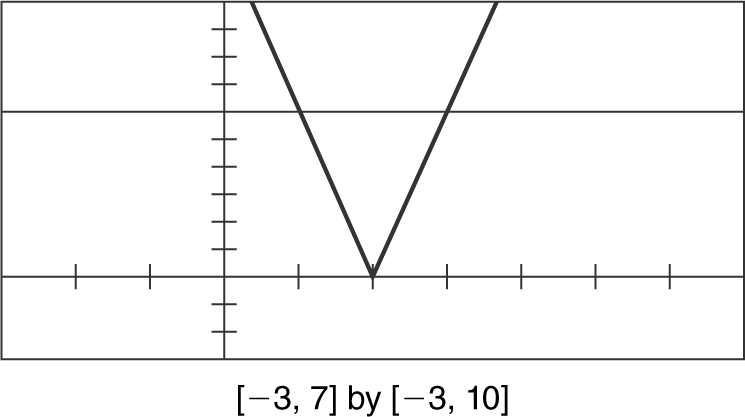
2 . Solve the inequality 3|2x – 4| > 6 graphically. Write the solution in interval notation.
3 . Given f (x ) = x 2 + 1, evaluate 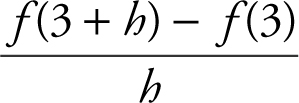 .
.
4 . Solve for x : 4 ln x – 2 = 6.
5 . Given f (x ) = x 3 – 8 and g (x ) = 2x – 2, find f (g (2)).
Chapter 6
6 . A function f is continuous on [–2, 0] and some of the values of f are shown below.
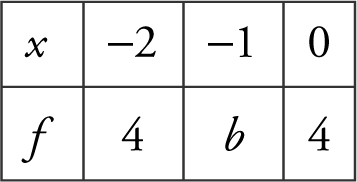
If f (x ) = 2 has no solution on [–2, 0], then b could be
(A) 3
(B) 2
(C) 0
(D) –2
7 . Evaluate 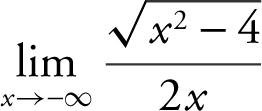 .
.
8 . If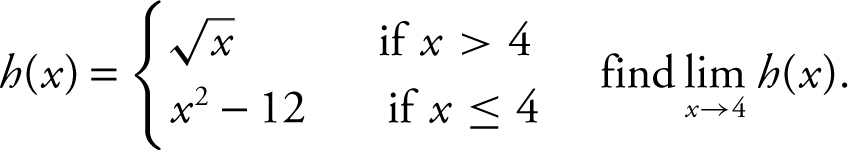
9 . If f (x ) = |2xe x |, what is the value of  ?
?
Chapter 7
10 . Evaluate 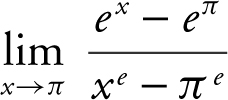 .
.
11 . Given the equation y = (x + 1)(x – 3)2 , what is the instantaneous rate of change of y at x = –1?
12 . What is 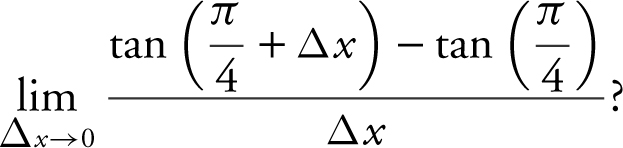
Chapter 8
13 . The graph of f is shown in the figure below. Draw a possible graph of f ′ on (a , b ).
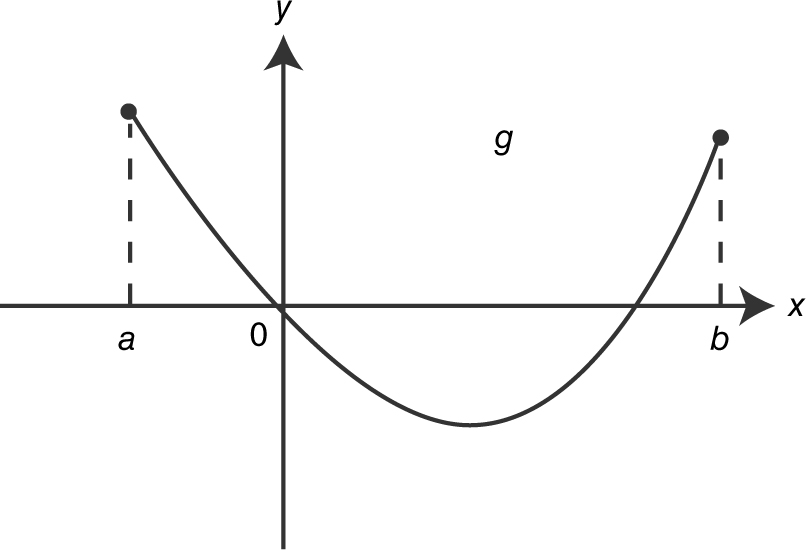
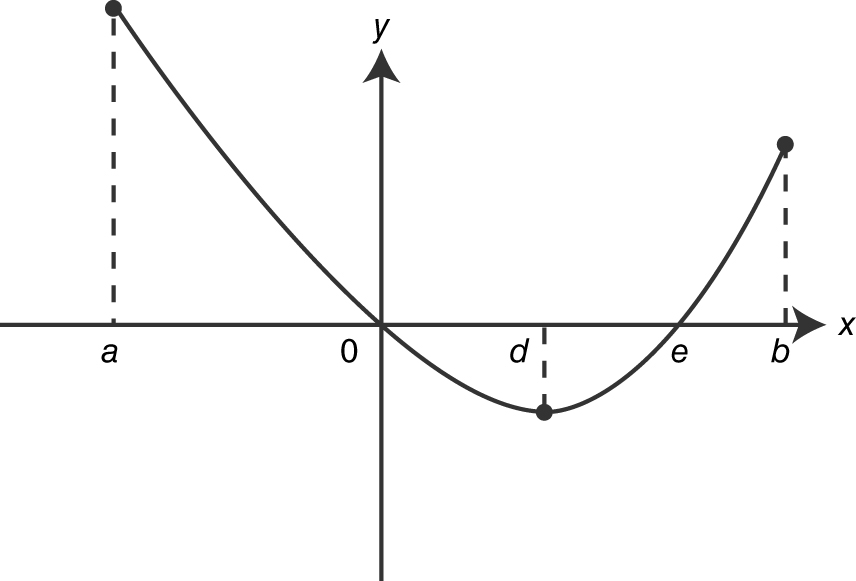
14 . The graph of the function g is shown in the figure below. Which of the following is true for g on (a , b )?
I. g is monotonic on (a , b ).
II. g ′ is continuous on (a , b ).
III. g ″ > 0 on (a , b ).
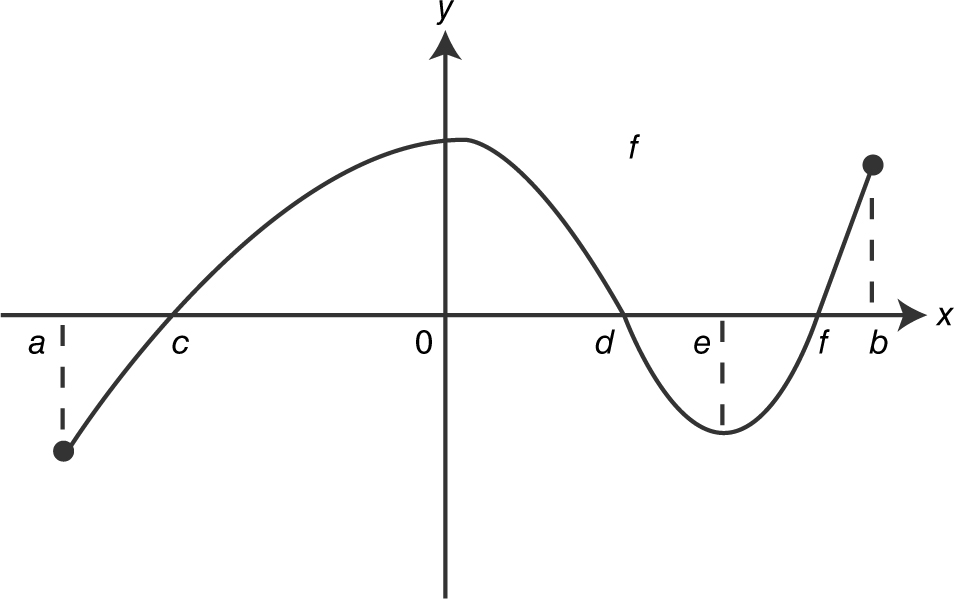
15 . The graph of f is shown in the figure below. If f is twice differentiable, which of the following statements is true?
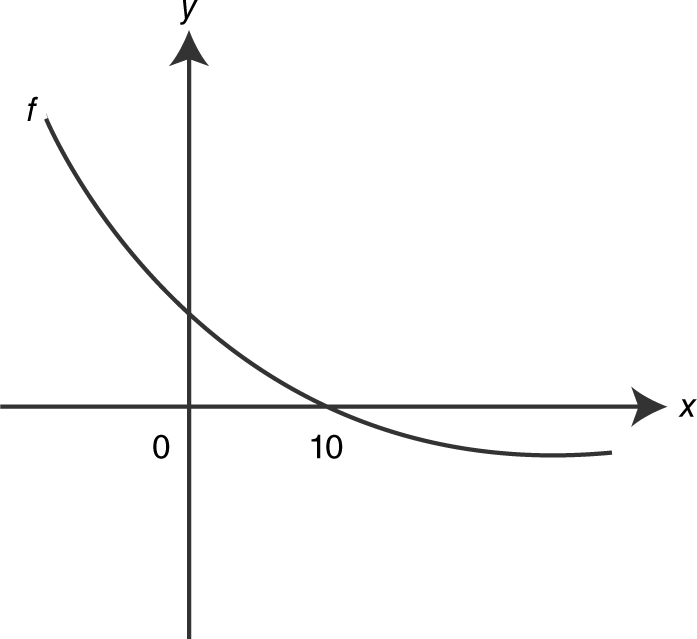
(A) f (10) < f ′(10) < f ″(10)
(B) f ″(10) < f ′(10) < f (10)
(C) f ′(10) < f (10) < f ″(10)
(D) f ′(10) < f ″(10) < f (10)
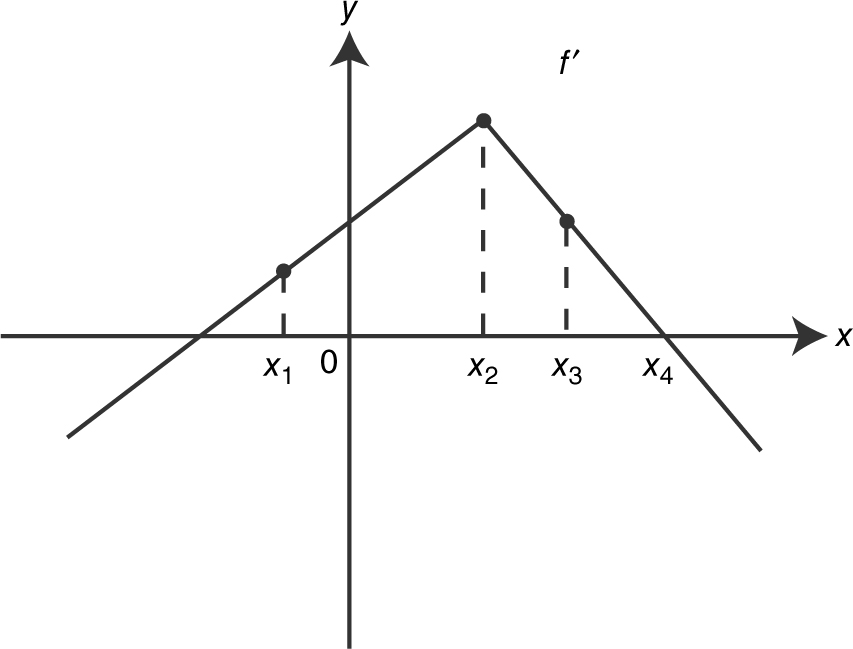
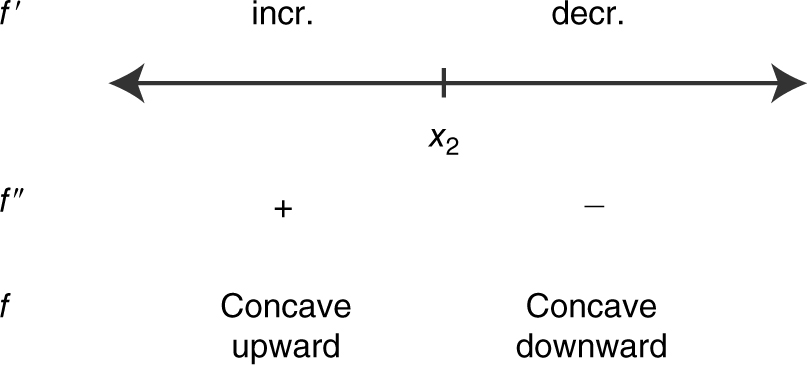
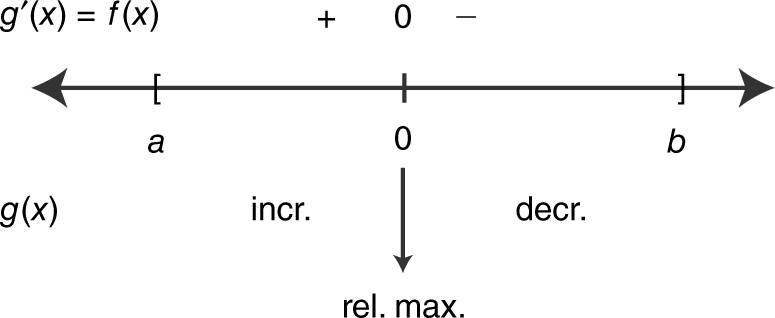
16 . The graph of f ′, the derivative of f , is shown in the following figure. At what value(s) of x is the graph of f concave up?
17 . How many points of inflection does the graph of y = sin(x 2 ) have on the interval [–π , π ]?
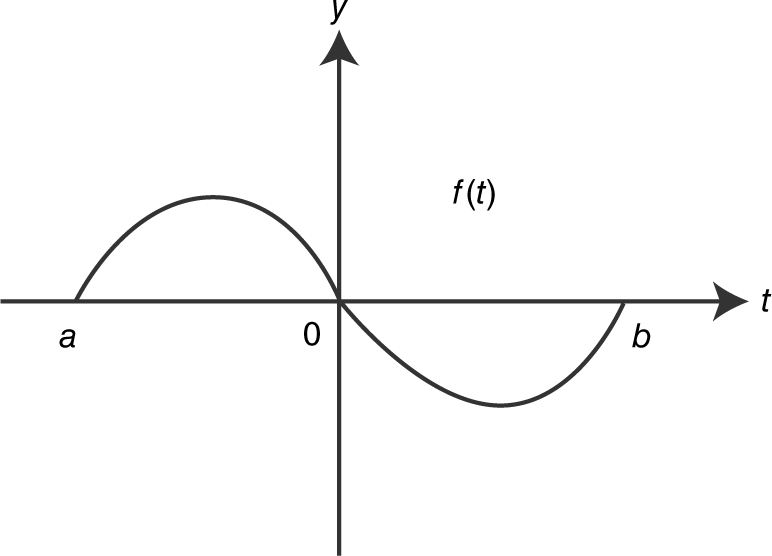
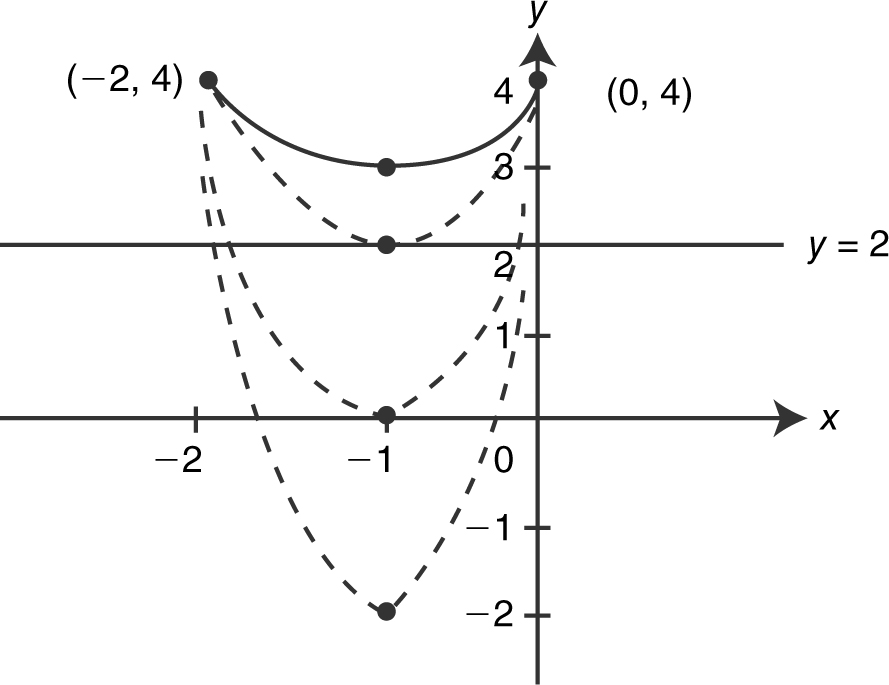
18 . If 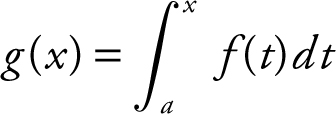 and the graph of f is shown above, which of the graphs below is a possible graph of g ?
(A) 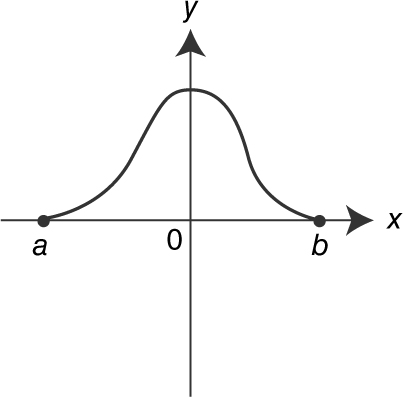
(B) 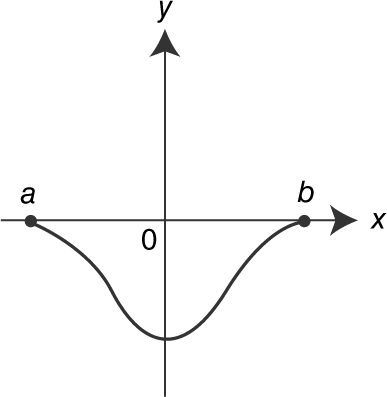
(C) 
(D) 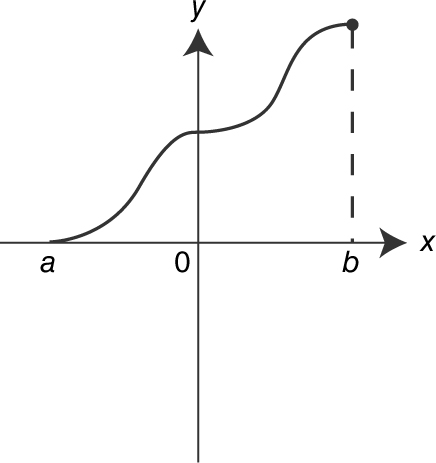
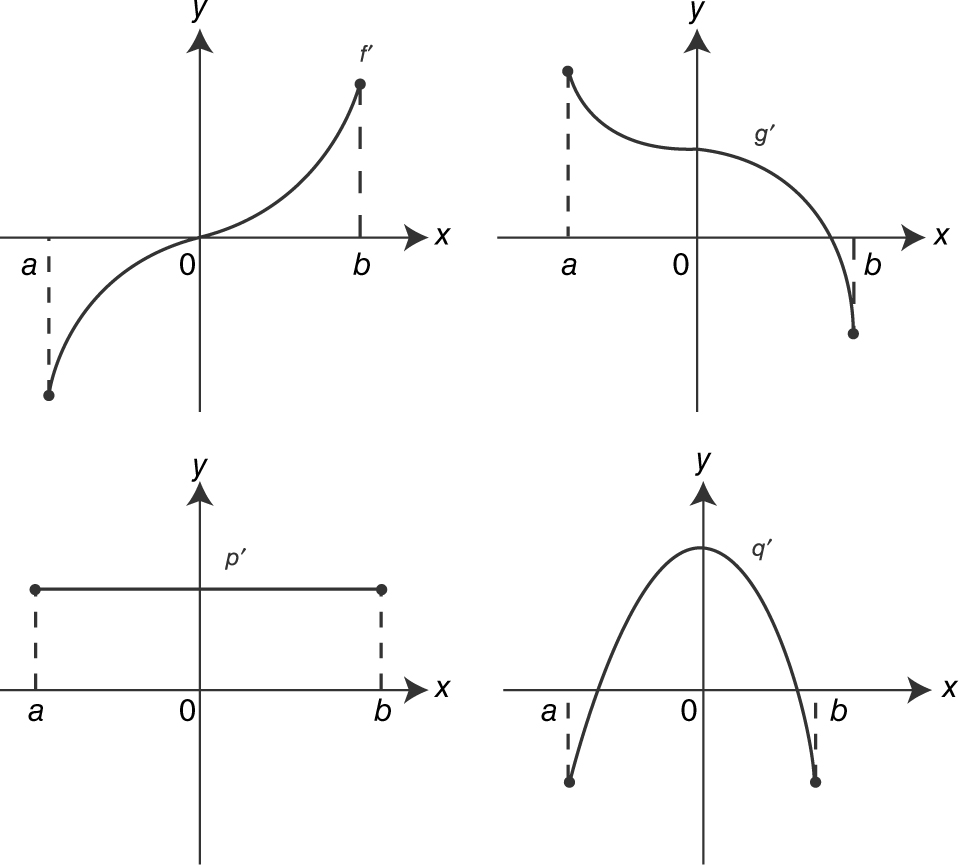
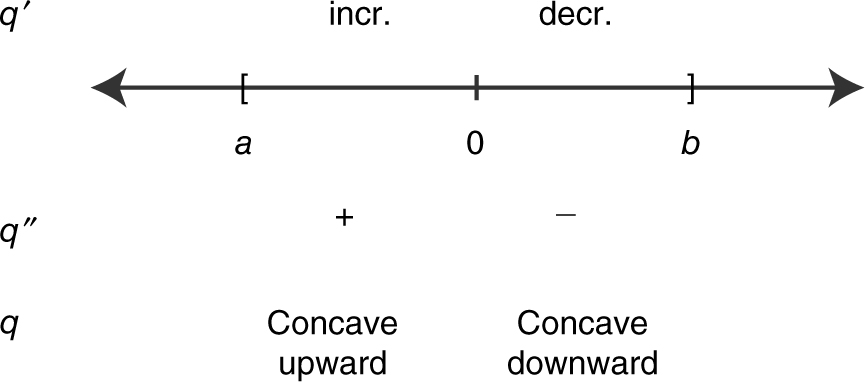
19 . The graphs of f ′, g ′, p ′, and q ′ are shown below. Which of the functions f, g, p , or q have a point of inflection on (a , b )?
Chapter 9
20 . When the area of a square is increasing four times as fast as the diagonals, what is the length of a side of the square?
21 . If g (x ) = |x 2 – 4x – 12|, which of the following statements about g is/are true?
I. g has a relative maximum at x = 2.
II. g is differentiable at x = 6.
III. g has a point of inflection at x = –2.
Chapter 10
22 . Given the equation 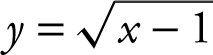 , what is an equation of the normal line to the graph at x = 5?
23 . What is the slope of the tangent to the curve y = cos(xy ) at x = 0?
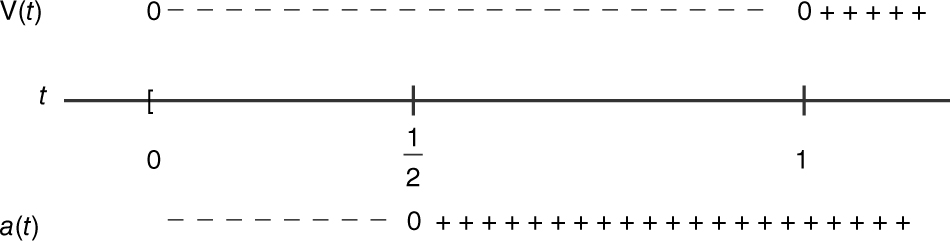
24 . The velocity function of a moving particle on the x -axis is given as v (t ) = t 2 – t . For what values of t is the particle’s speed decreasing?
25 . The velocity function of a moving particle is 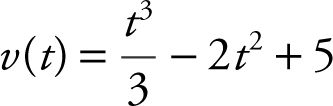 for 0 ≤ t ≤ 6. What is the maximum acceleration of the particle on the interval 0 ≤ t ≤ 6?
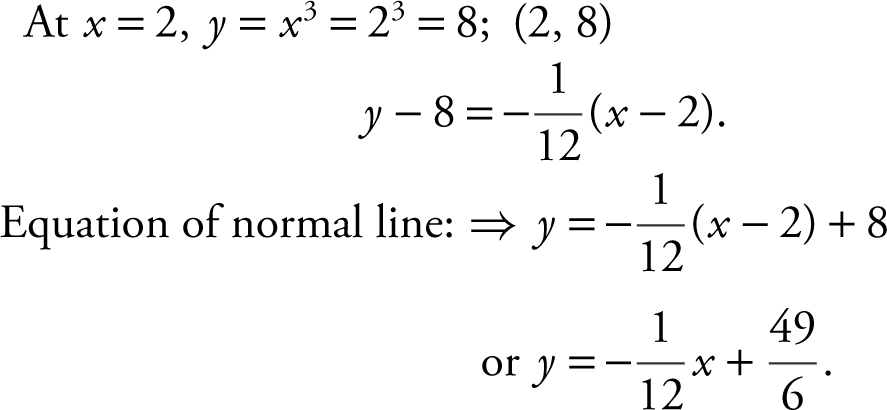
26 . Write an equation of the normal line to the graph of f (x ) = x 3 for x ≥ 0 at the point where f ′(x ) = 12.
27 . At what value(s) of x do the graphs of 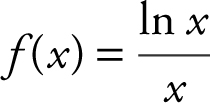 and y = –x 2 have perpendicular tangent lines?
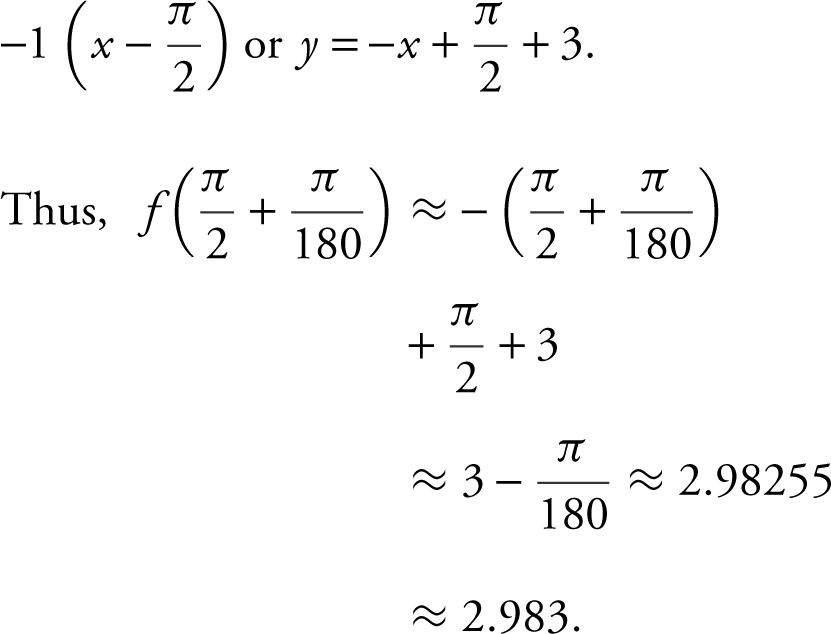
28 . Given a differentiable function f with  and
and  . Using a tangent line to the graph at
  , find an approximate value of
  .
.
Chapter 11
29 . Evaluate  .
.
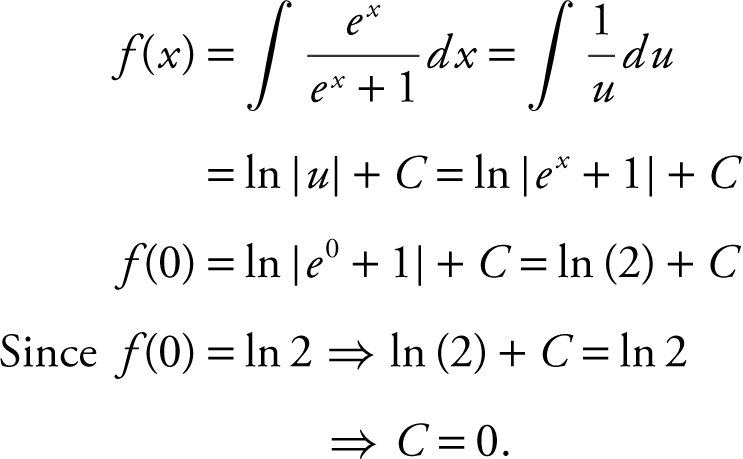
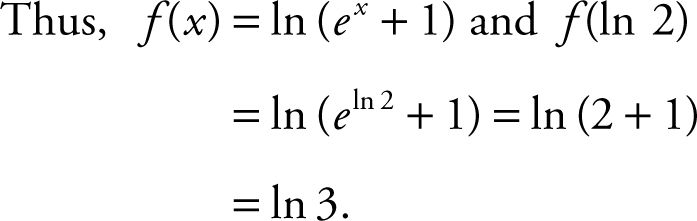
30 . If f (x ) is an antiderivative of  and f (0) = ln (2), find f (ln 2).
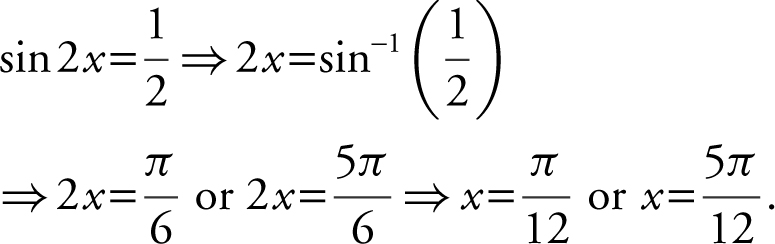
31 . Find the volume of the solid generated by revolving about the x -axis on the region bounded by the graph of y = sin 2x for 0 ≤ x ≤ π and the line  .
.
Chapter 12
32 . Evaluate 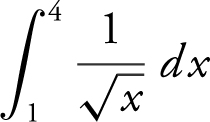 .
.
33 . If 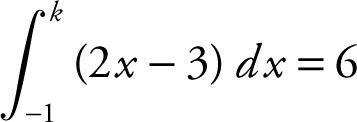 , find k .
34 . If 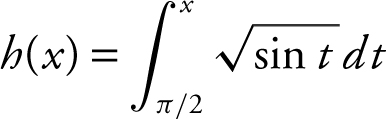 , find h ′(π ).
35 . If f ′(x ) = g (x ) and g is a continuous function for all real values of x , then 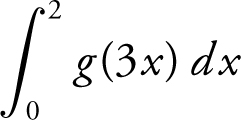 is
is
(A) 
(B) f (2) – f (0).
(C) f (6) – f (0).
(D) 
36 . Evaluate 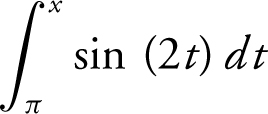 .
.
37 . If a function f is continuous for all values of x , which of the following statements is/are always true?
I. 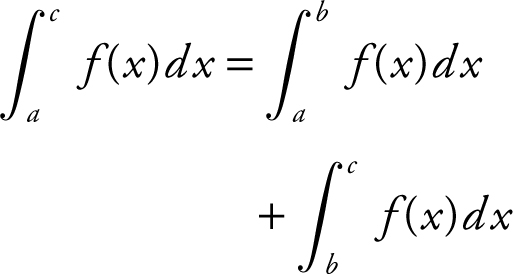
II. 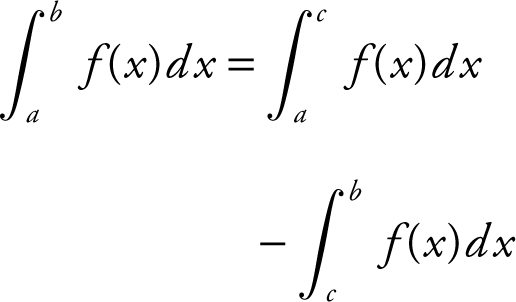
III. 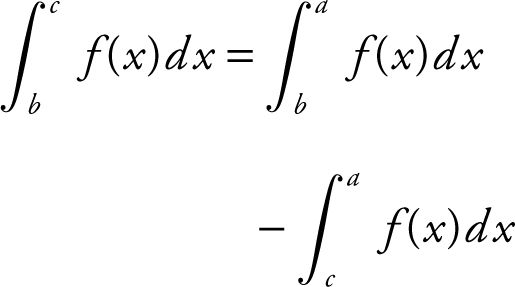
38 . If 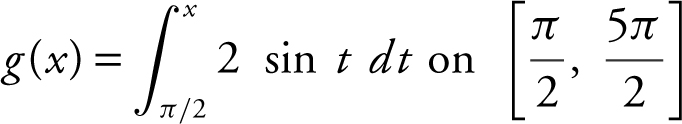 , find the value(s) of x where g has a local minimum.
Chapter 13
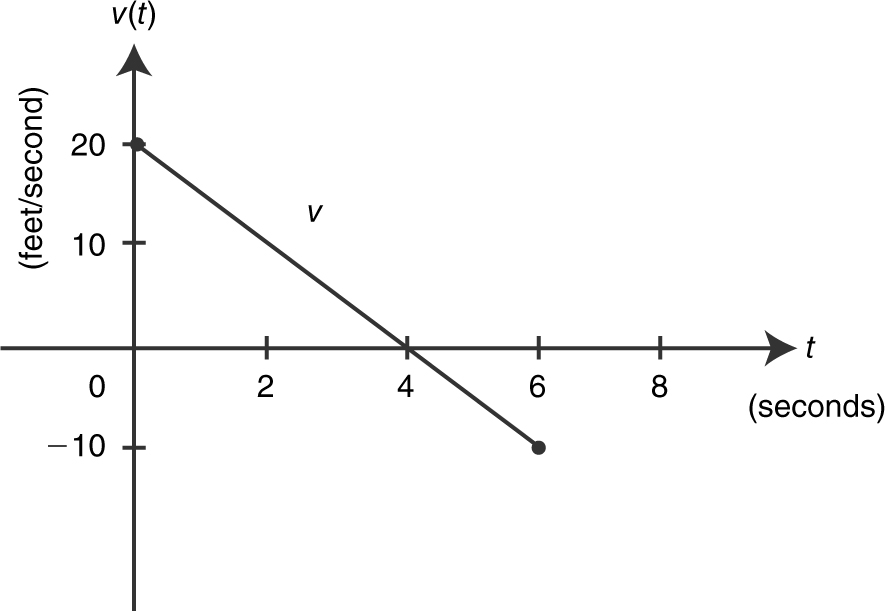
39 . The graph of the velocity function of a moving particle is shown in the following figure. What is the total distance traveled by the particle during 0 ≤ t ≤ 6?
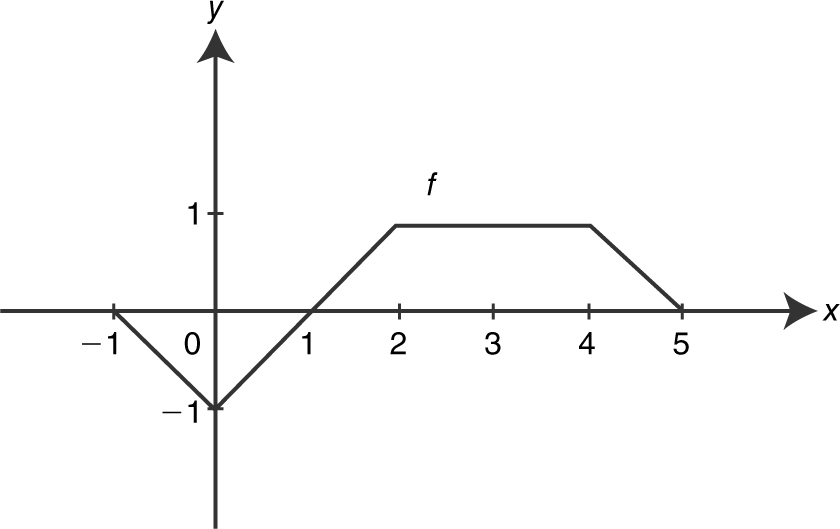
40 . The graph of f consists of four line segments, for –1 ≤ x ≤ 5 as shown in the figure below. What is the value of 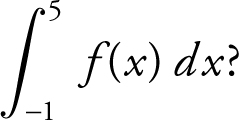
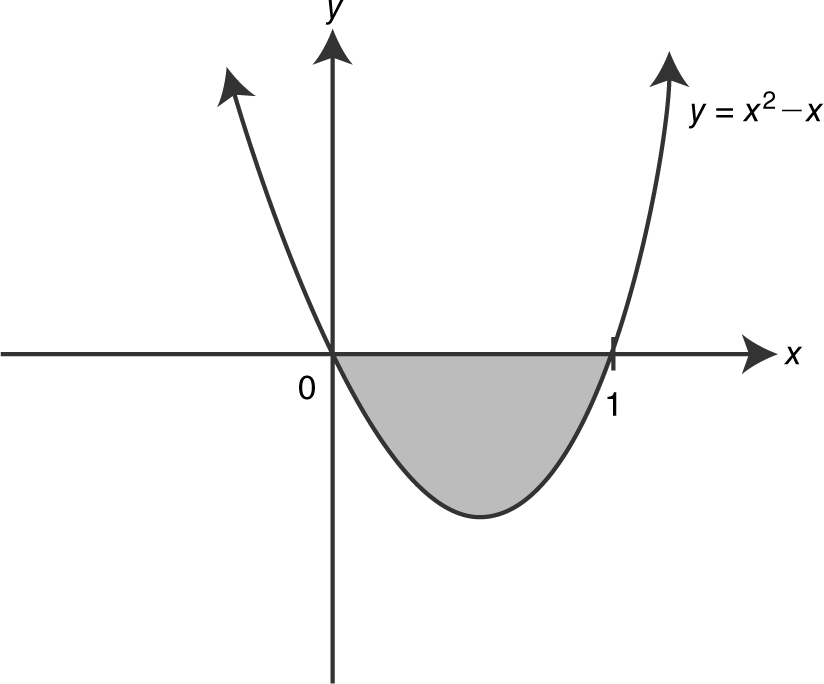
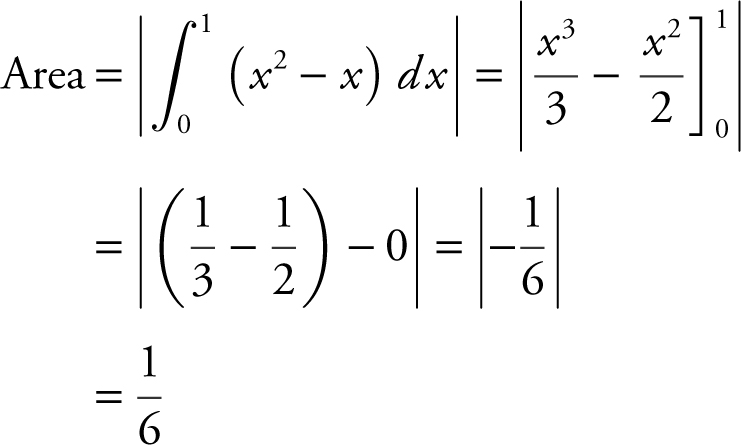
41 . Find the area of the region enclosed by the graph of y = x 2 – x and the x -axis.
42 . If 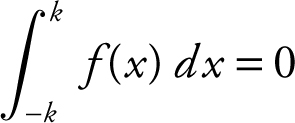 for all real values of k , then which of the graphs shown on the next page could be the graph of f ?
43 . The area under the curve  from x = 1 to x = k is 8. Find the value of k .
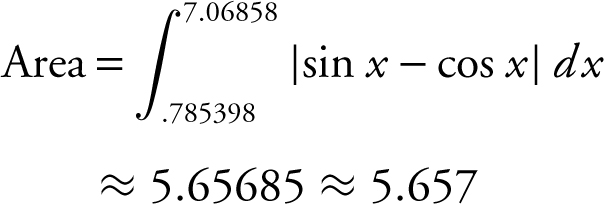
44 . For 0 ≤ x ≤ 3π , find the area of the region bounded by the graphs of y = sin x and y = cos x .
45 . Let f be a continuous function on [0, 6] that has selected values as shown below:
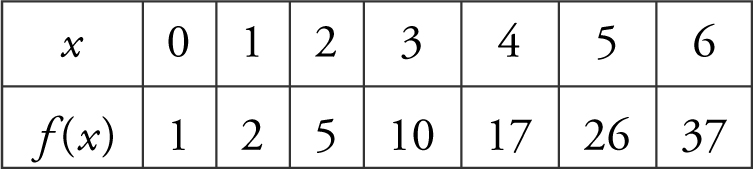
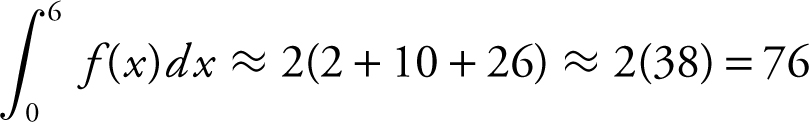
Using three midpoint rectangles of equal widths, find an approximate value of 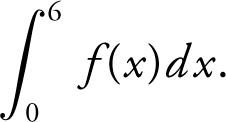
(A) 
(B) 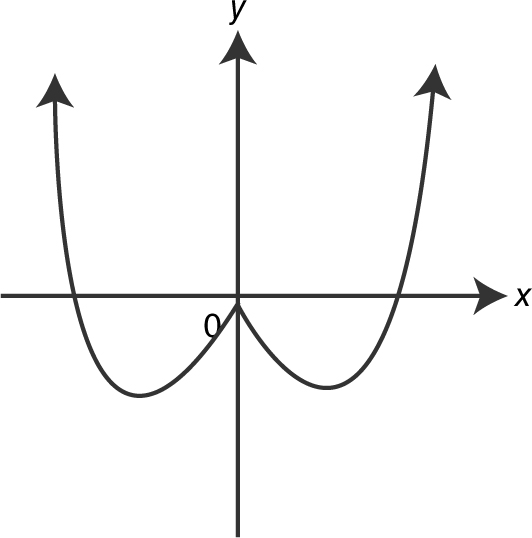
(C) 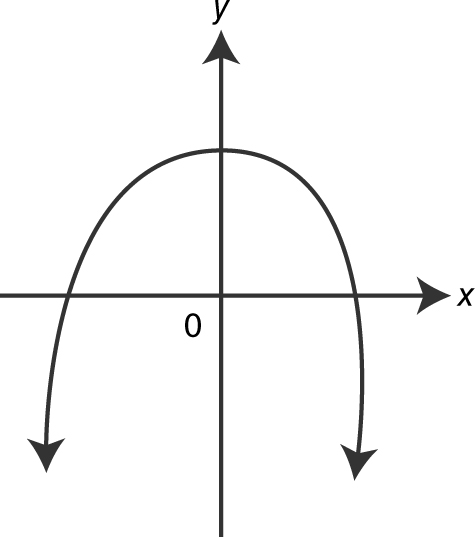
(D) 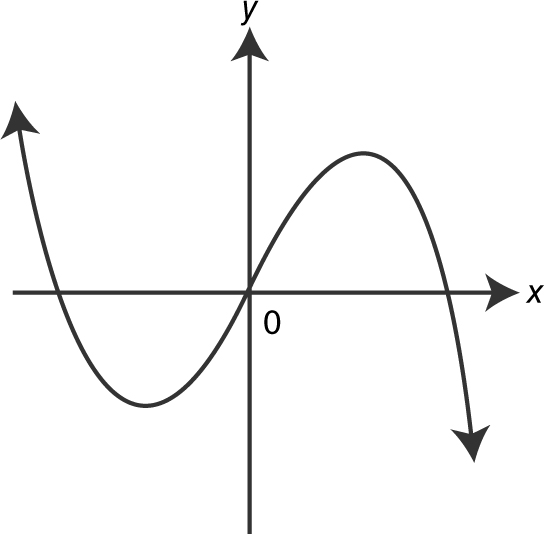
Chapter 14
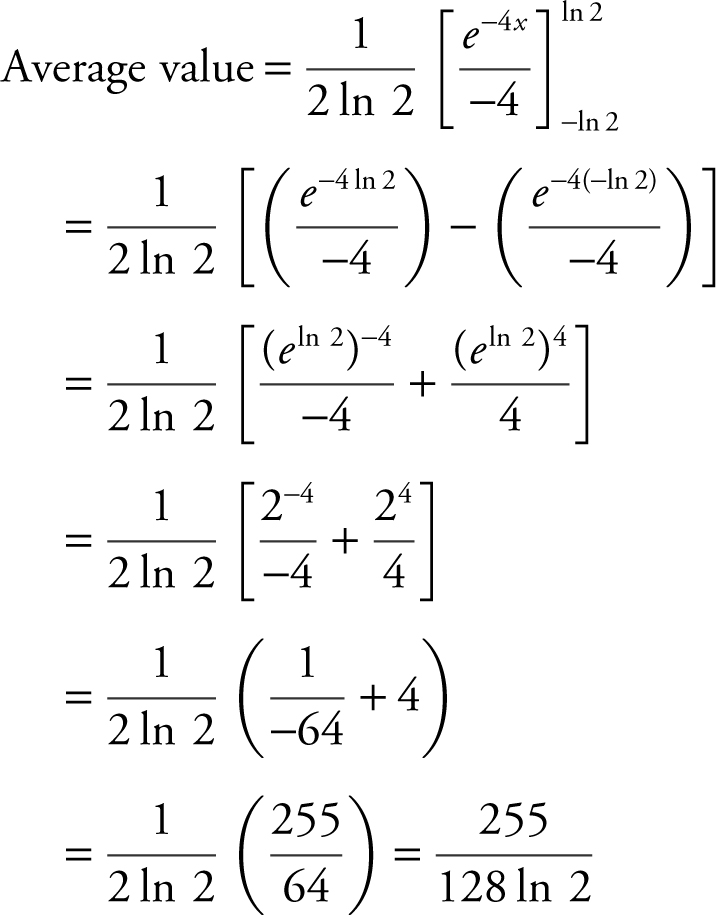
46 . What is the average value of the function y = e -4x on [–ln 2, ln 2]?
47 . If 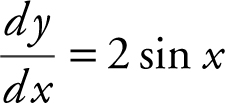 and at x = π , y = 2, find a solution to the differential equation.
48 . Water is leaking from a tank at the rate of f (t )=10 ln(t +1) gallons per hour for 0 ≤ t ≤ 10, where t is measured in hours. How many gallons of water have leaked from the tank after 5 hours?
49 . Carbon-14 has a half-life of 5730 years. If y is the amount of Carbon-14 present and y decays according to the equation  , where k is a constant and t is measured in years, find the value of k .
50 . What is the volume of the solid whose base is the region enclosed by the graphs of y = x 2 and y = x + 2 and whose cross sections perpendicular to the x -axis are squares?
3.3 Answers to Diagnostic Test
1 . 
2 . (– ∞, 1) ∪ (3, ∞)
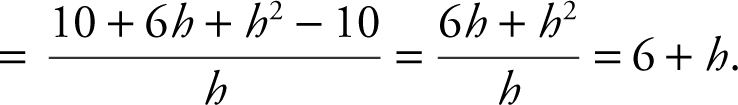
3 . 6 + h
4 . x = e 2
5 . 0
6 . A
7 . –1/2
8 . Does not exist.
9 . 2
10 . 
11 . 16
12 . 2
13 . See the graph in Question 15 in the Solutions to Diagnostic Test.
14 . II & III
15 . C
16 . x < x 2
17 . 8
18 . A
19 . q
20 . ![]()
21 . I
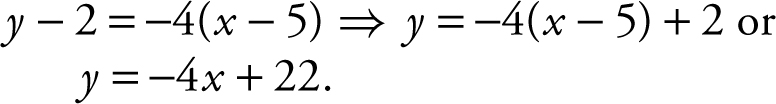
22 . y = –4x + 22
23 . 0
24 . 
25 . 12
26 . 
27 . 1.370
28 . 2.983
29 . 
30 . ln 3
31 . 1.503
32 . 2
33 . {–2, 5}
34 . 0
35 . A
36 . 
37 . I & III
38 . 2π
39 . 50 feet
40 . 2
41 . ![]()
42 . D
43 . 132/3
44 . 5.657
45 . 76
46 . 
47 . y = –2 cos x
48 . 57.506
49 . 
50 . ![]()
3.4 Solutions to Diagnostic Test
Chapter 5
1 . Write 5x – 2y = 10 in slope-intercept form y = mx + b and obtain  . The slope of the line is
 ![]() . Therefore the slope of the line perpendicular to is –
. Therefore the slope of the line perpendicular to is –![]() . Since the line perpendicular to also passes through the origin, its y -intercept is 0 and its equation is
. Since the line perpendicular to also passes through the origin, its y -intercept is 0 and its equation is  .
.
2 . Using your calculator, set y 1 = 3|2x – 4| and y 2 = 6. Examine the figure below and note that 3|2x – 4| > 6 when x < 1 or x > 3.
Thus the solution in interval notation is (– ∞,1) ∪ (3, ∞).
3 . Since f (x ) = x 2 + 1, f (3) = 10 and f (3 + h ) = (3 + h )2 + 1 = 9 + 6h + h 2 + 1 = 10 + 6h + h 2 .
The quotient 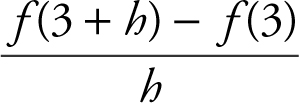
4 . Simplify the equation 4ln x – 2 = 6 and obtain ln x = 2. (Note that e x and ln x are inverse functions.) Thus, e ln x = e 2 or x = e 2 .
5 . Since g (x ) = 2x – 2, g (2) = 2(2) – 2 = 2.
Therefore f (g (2)) = f (2). Also f (x ) = x 3 – 8.
Thus f (2) = 23 – 8 = 0.
Chapter 6
6 . See the figure below.
If b = 2, then x = –1 would be a solution for f (x ) = 2.
If b = 1, 0, or – 2, f (x ) = 2 would have two solutions.
Thus, b = 3, choice (A).
7 . 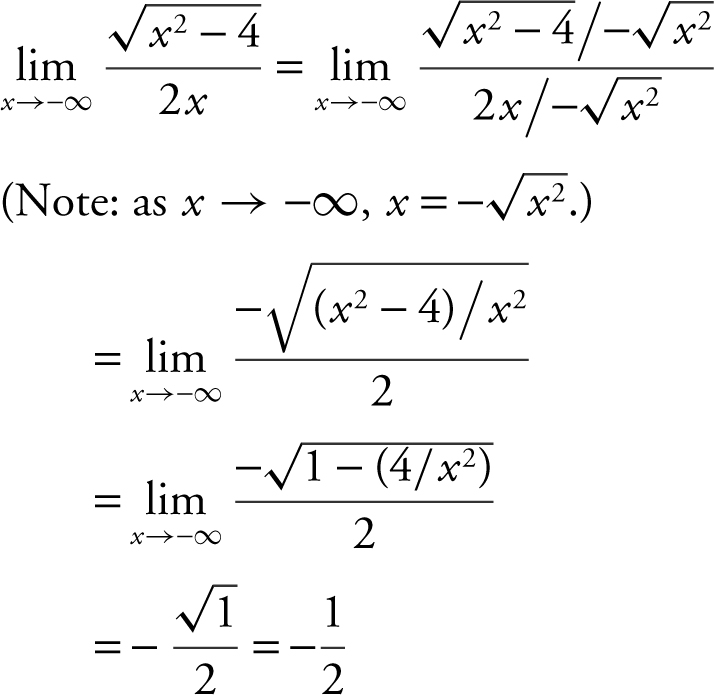
8 . 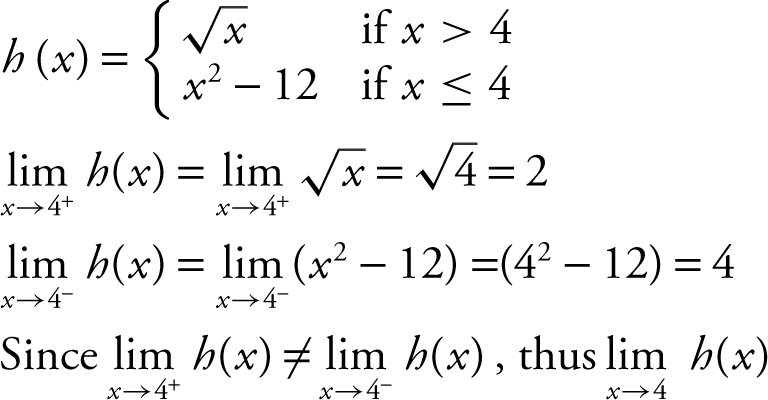 does not exist.
9 . 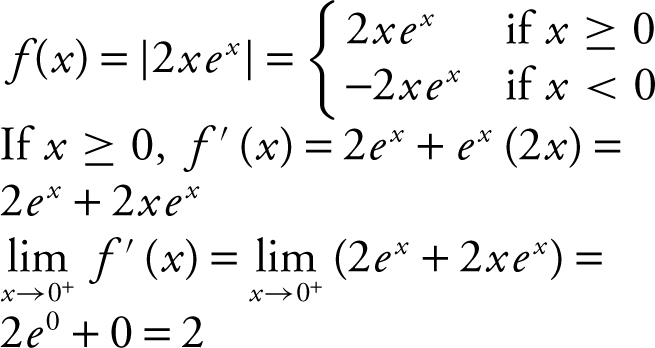
Chapter 7
10 . By L’Hôpital’s Rule, 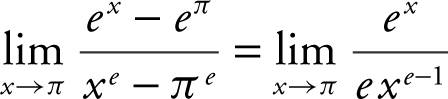
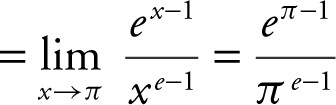 .
.
11 . 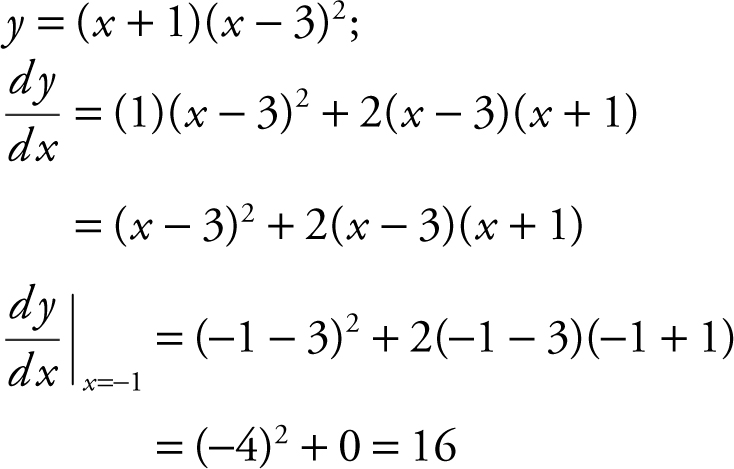
12 . 
Chapter 8
13 . See the graph shown in Question 15.
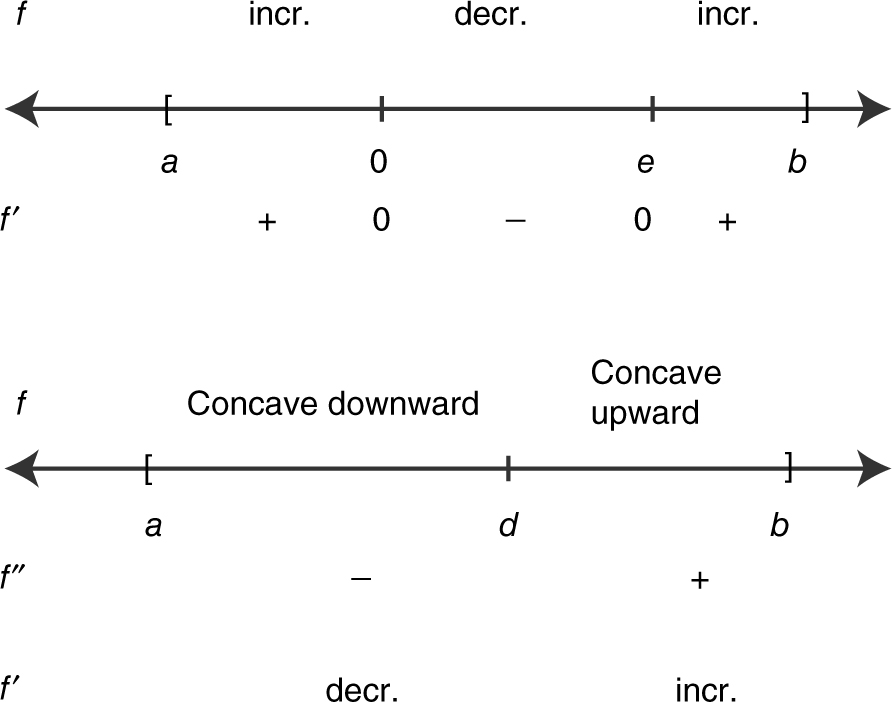
14 . I. Since the graph of g is decreasing and then increasing, it is not monotonic.
II. Since the graph of g is
a smooth curve, g ′ is continuous.
III. Since the graph of g is
concave upward, g ″ > 0.
Thus, only statements II and III are true.
15 . The graph indicates that (1) f (10) = 0, (2) f ′(10) < 0, since f is decreasing; and (3) f ″(10) > 0, since f is concave upward.
Thus, f ′(10) < f (10) < f ″(10), choice (C).
Based on the graph of f :
A possible graph of f ′
16 . See the figure below.
The graph of f is concave upward for x < x 2 .
17 . See the figure below.
Enter y 1 = sin(x 2 ). Using the [Inflection ] function of your calculator, you obtain four points of inflection on [0, π ]. The points of inflection occur at x = 0.81, 1.81, 2.52, and 3.07. Since y 1 = sin (x 2 ) is an even function, there is a total of eight points of inflection on [–π , π ]. An alternate solution is to enter 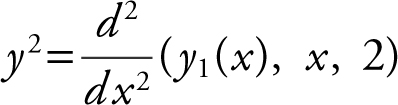 . The graph of y 2 crosses the x -axis eight times, thus eight zeros on [–π , π ].
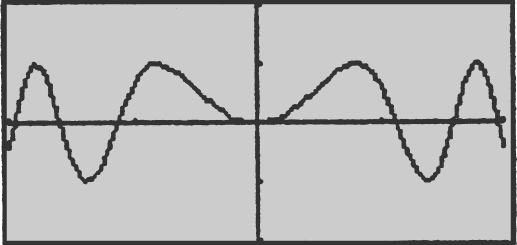
18 . Since 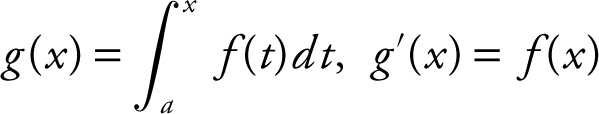 .
.
See the figure below.
The only graph that satisfies the behavior of g is choice (A).
19 . See the figure below.
A change of concavity occurs at x = 0 for q .
Thus, q has a point of inflection at x = 0.
None of the other functions has a point of inflection.
Chapter 9
20 . Let z be the diagonal of a square. Area of a square 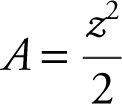
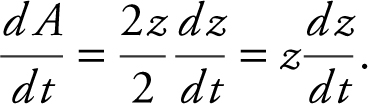
Since 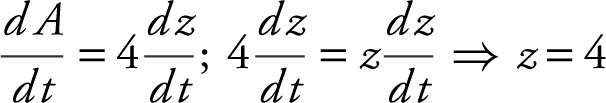 .
.
Let s be a side of the square. Since the diagonal z = 4, s 2 + s 2 = z 2 or 2s 2 = 16. Thus, s 2 = 8 or ![]() .
.
21 . See the figure below.
The graph of g indicates that a relative maximum occurs at x = 2; g is not differentiable at x = 6, since there is a cusp at x = 6, and g does not have a point of inflection at x = –2, since there is no tangent line at x = –2. Thus, only statement I is true.
Chapter 10
22 . 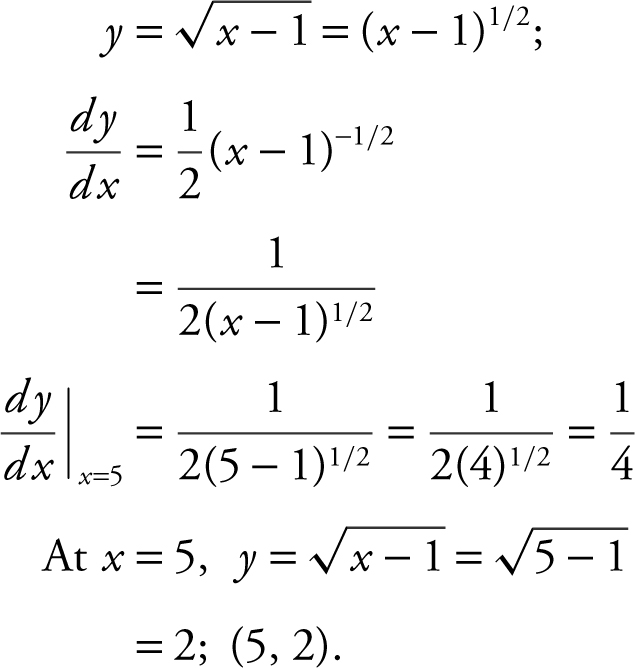
Slope of normal line = negative reciprocal of 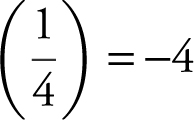 .
.
Equation of normal line:
23 . 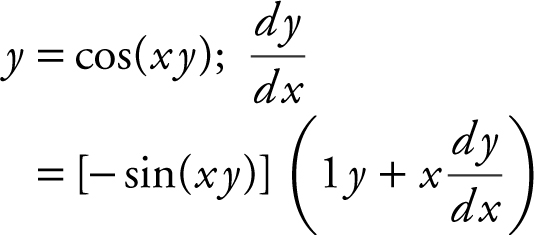
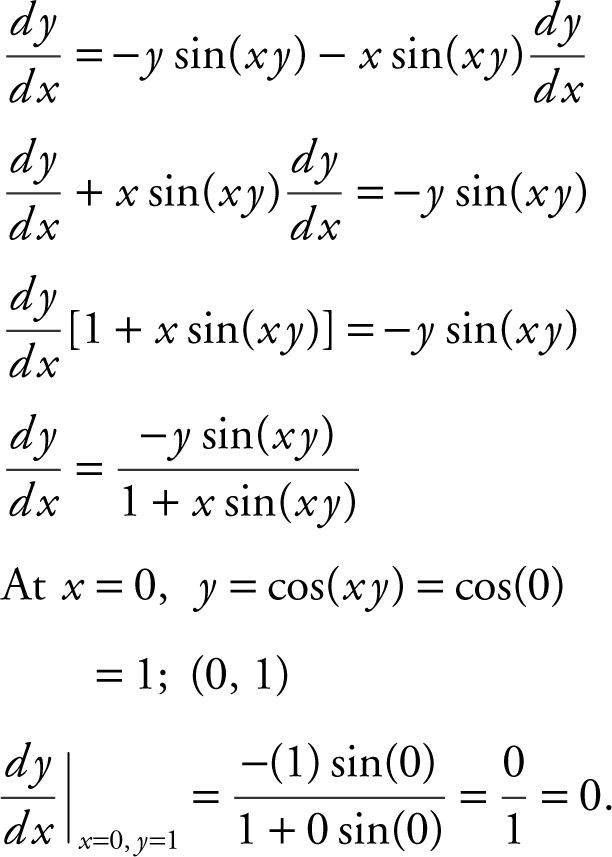
Thus, the slope of the tangent at x = 0 is 0.
24 . See the figure below.
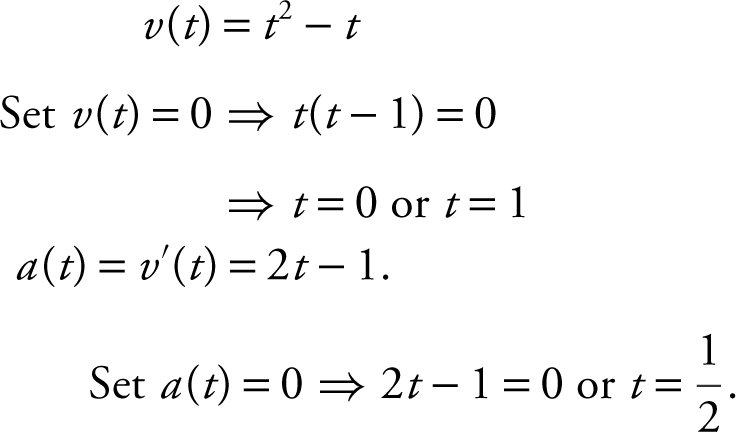
Since v (t ) < 0 and a (t ) > 0 on  , the speed of the particle is decreasing on .
25 . 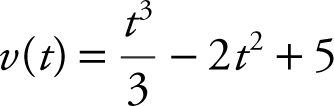
a (t ) = v ′(t ) = t 2 – 4t
See the figure below.
The graph indicates that the maximum acceleration occurs at the endpoint t = 6. a (t ) = t 2 – 4t and a (6) = 62 – 4(6) = 12.
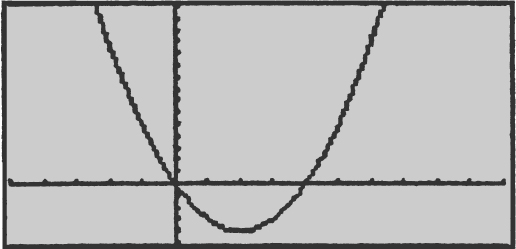
26 . 
Slope of normal = negative reciprocal of slope of tangent = – ![]() .
.
27 . 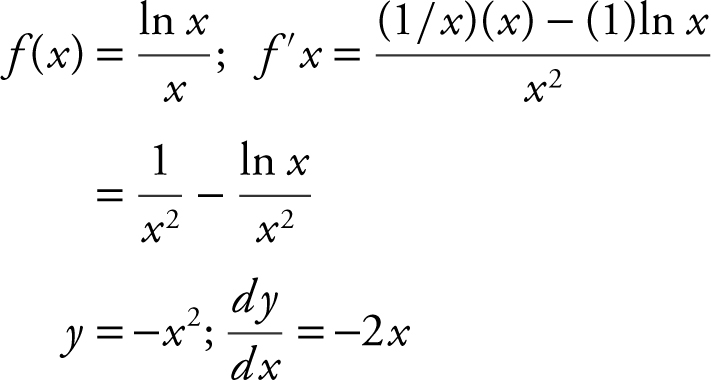
Perpendicular tangents
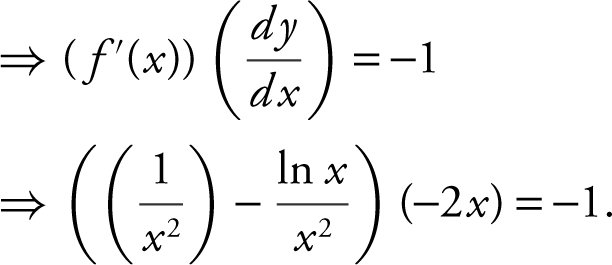
Using the [Solve ] function on your calculator, you obtain x ≈ 1.37015 ≈ 1.370.
28 . 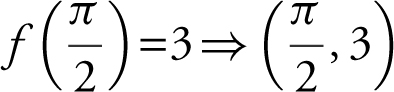 is on the graph.
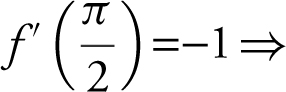 slope of the tangent at
  is –1.
Equation of tangent line: y – 3 =
Chapter 11
29 . 
You can check the answer by differentiating your result.
30 . Let u = ex + 1; du = ex dx .
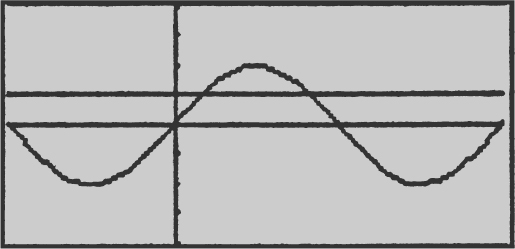
31 . See the figure below.
To find the points of intersection, set
Volume of solid
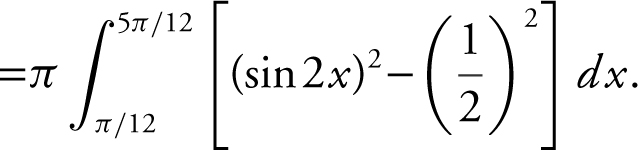
Using your calculator, you obtain: Volume of solid ≈ (0.478306)π ≈ 1.50264 ≈ 1.503.
Chapter 12
32 . 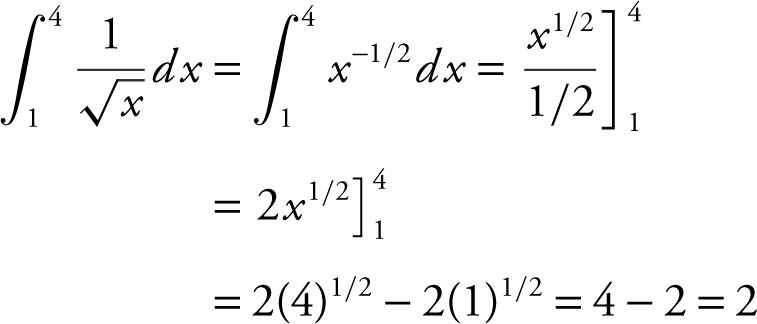
33 . 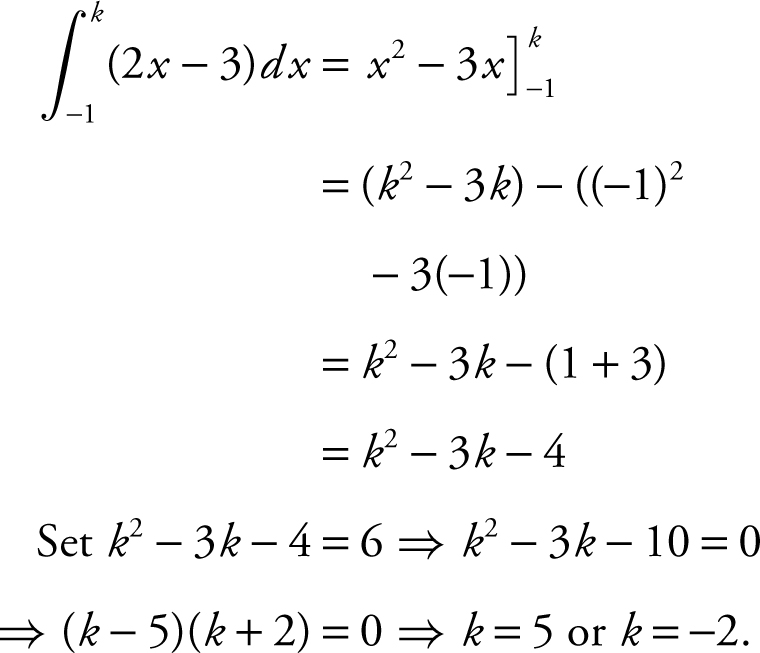
You can check your answer by evaluating 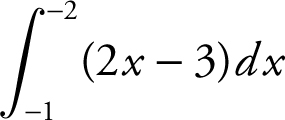 and
and 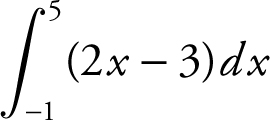 .
.
34 . 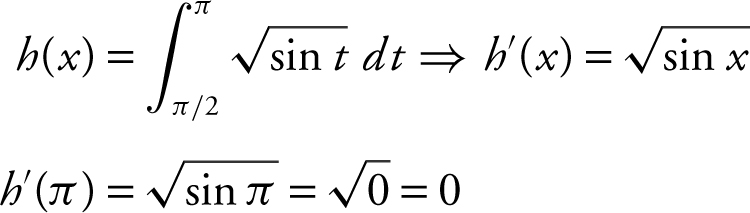
35 . Let u = 3x ; du = 3dx or  .
.
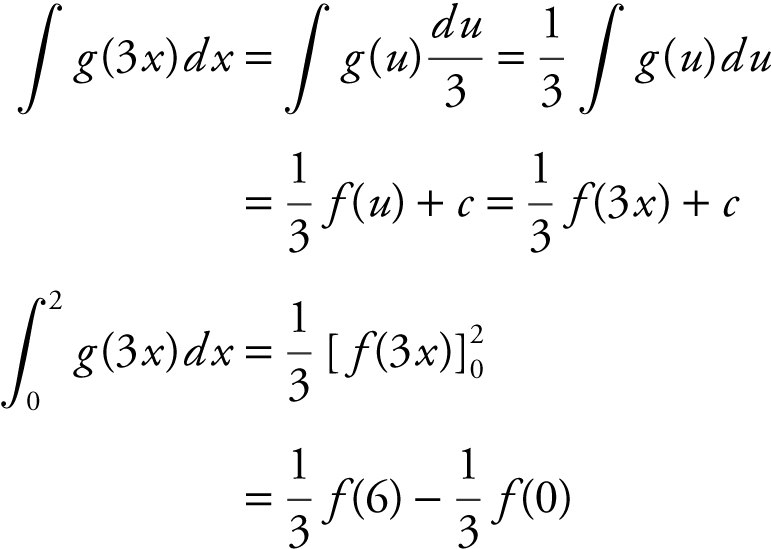
Thus, the correct choice is (A).
36 . 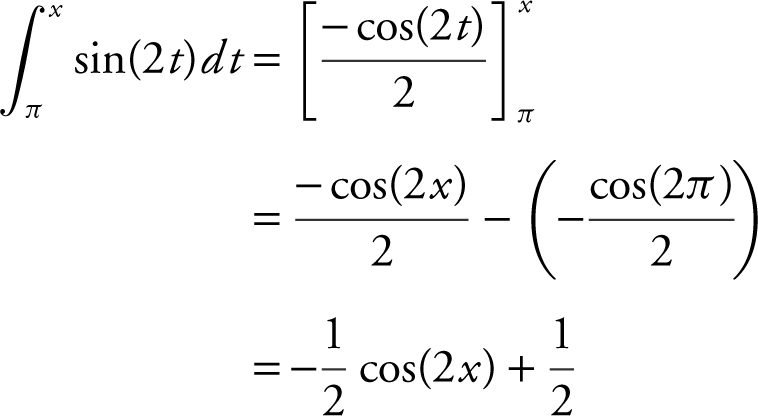
37 . I. 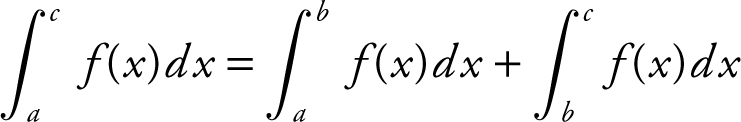
The statement is true, since the upper and lower limits of the integrals are in sequence, i.e., a → c = a → b → c .
II. 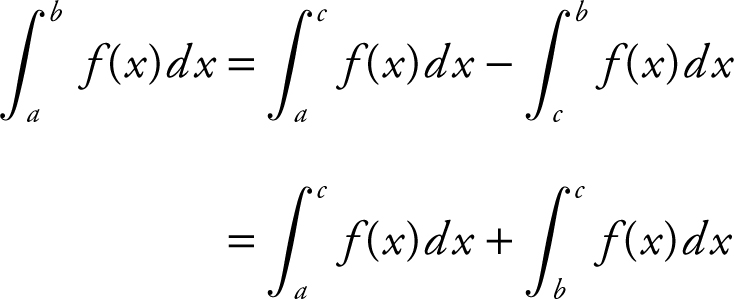
The statement is not always true.
III. 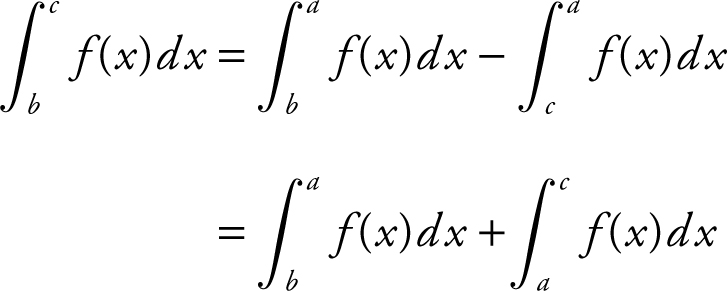
The statement is true.
Thus, only statements I and III are true.
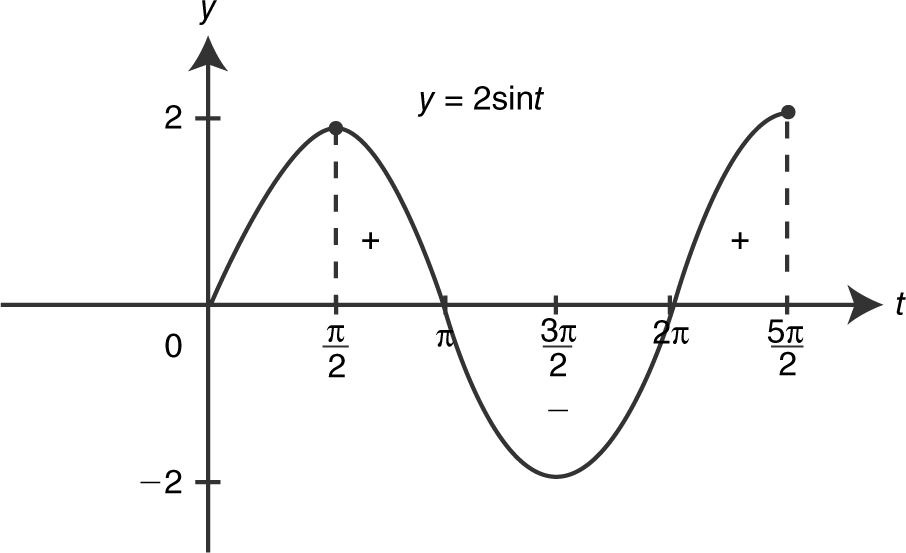
38 . Since  sin t dt , then g ′(x ) = 2 sin x .
Set g ′(x ) = 0 ⇒ 2 sin x = 0 ⇒ x = π or 2π g″ (x ) = 2 cos x and g″ (π ) = 2 cos π = –2 and g″ (2π ) = 1.
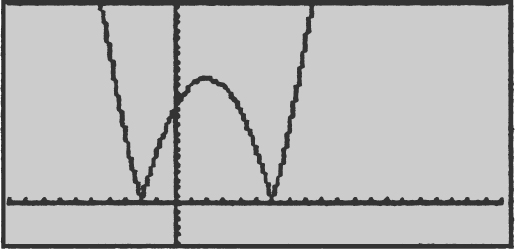
Thus g has a local minimum at x = 2π . You can also approach the problem geometrically by looking at the area under the curve. See the figure below.
Chapter 13
39 . 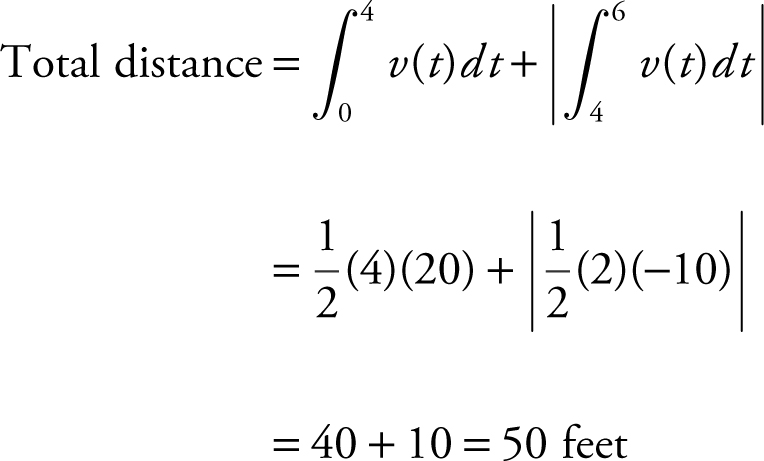
40 . 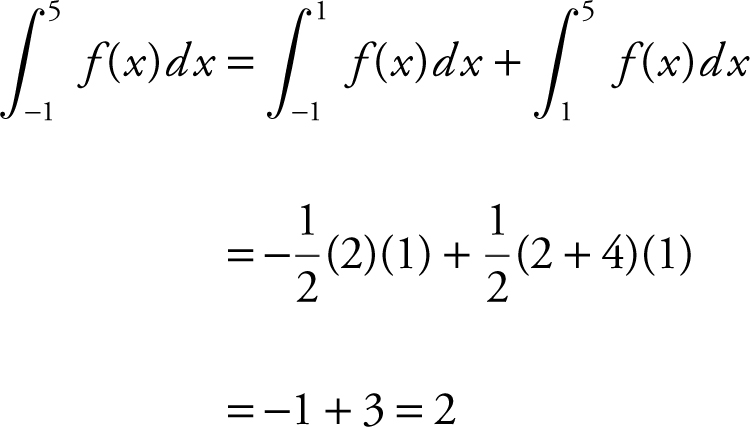
41 . To find points of intersection, set y = x 2 – x = 0
⇒ x (x – 1) = 0 ⇒ x = 0 or x = 1.
See the figure below.
42 . 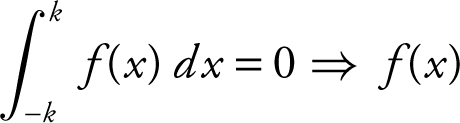 is an odd function, i.e., f (x ) = –f (–x ). Thus the graph in choice (D) is the only odd function.
43 . 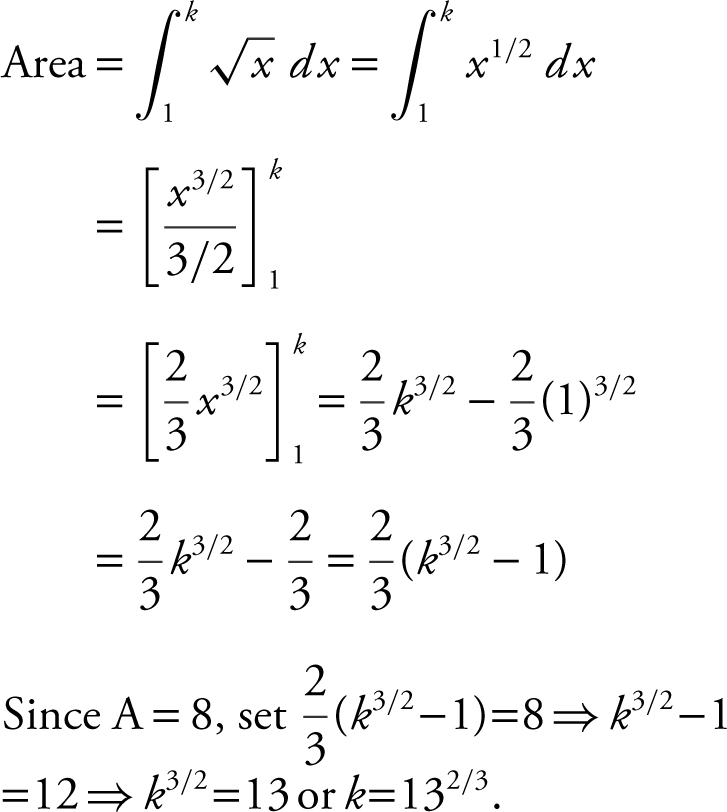
44 . See the figure below.
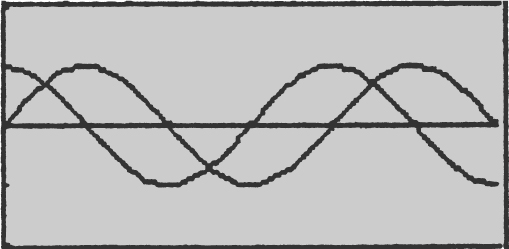
Using the [Intersection ] function of the calculator, you obtain the intersection points at x = 0.785398, 3.92699, and 7.06858.
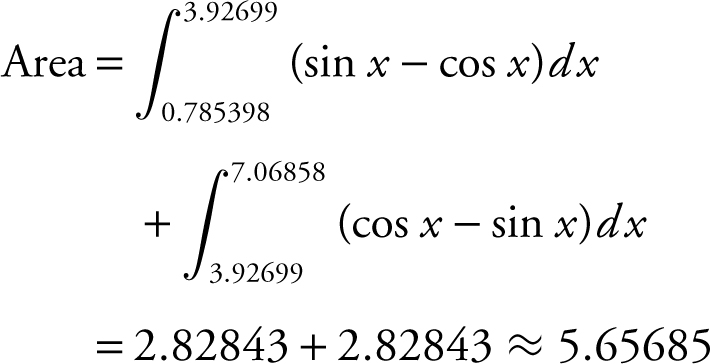
You can also find the area by:
45 . Width of a rectangle = 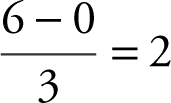 .
.
Midpoints are x = 1, 3, and 5 and f (1) = 2, f (3) = 10, and f (5) = 26.
Chapter 14
46 . 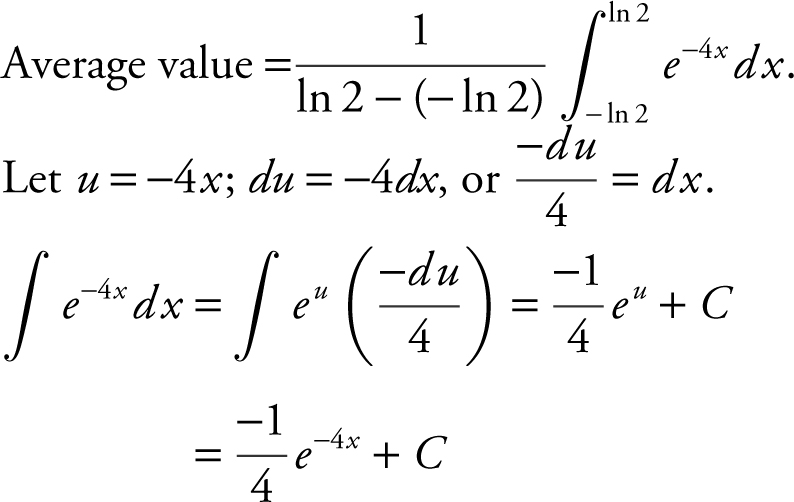
47 . 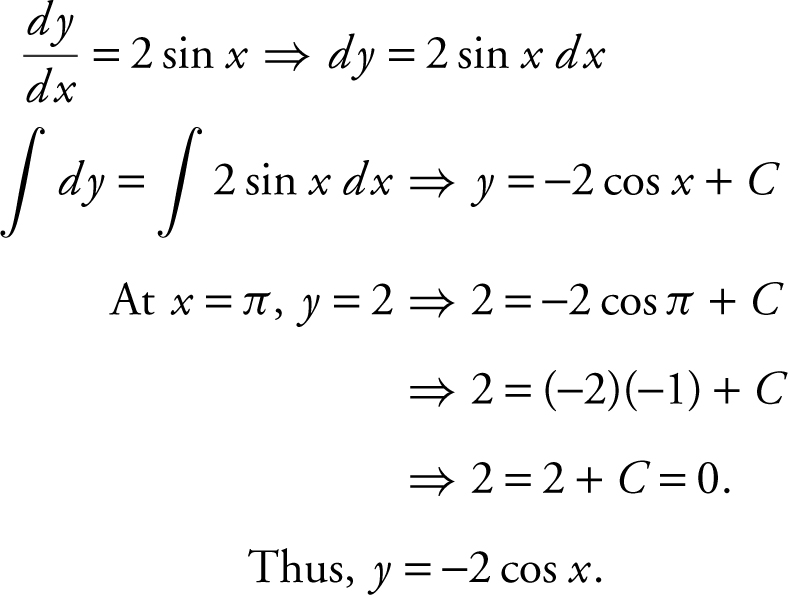
48 . Amount of water leaked
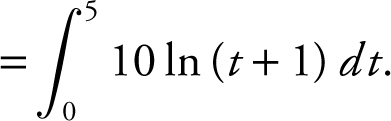
Using your calculator, you obtain 10(6 ln 6–5) which is approximately 57.506 gallons.
49 . 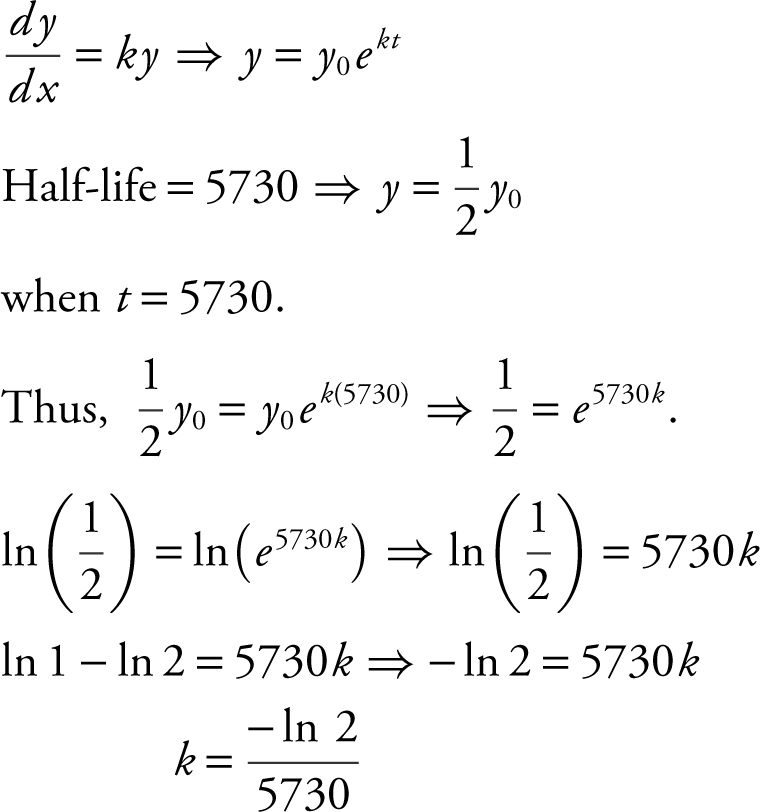
50 . See the figure below.
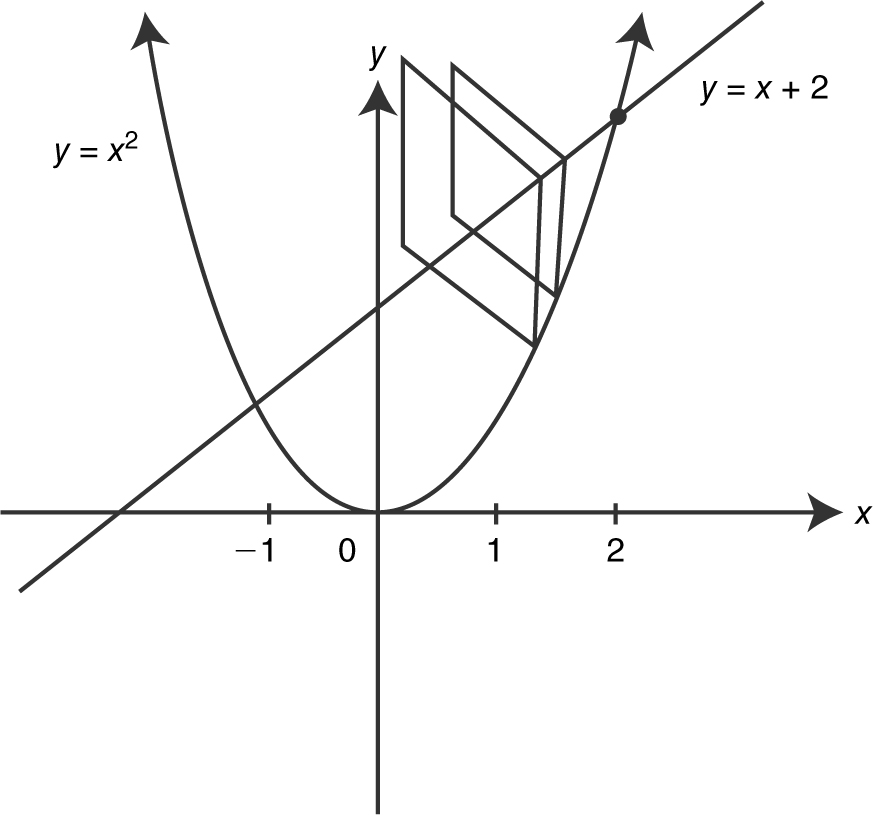
To find points of intersection, set x 2 = x + 2 ⇒ x 2 – x – 2 = 0 ⇒ x = 2 or x =–1.
Area of cross section = ((x + 2) – x 2 )2 .
Volume of solid, 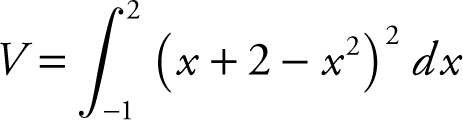 .
.
Using your calculator, you obtain: 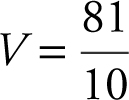 .
.
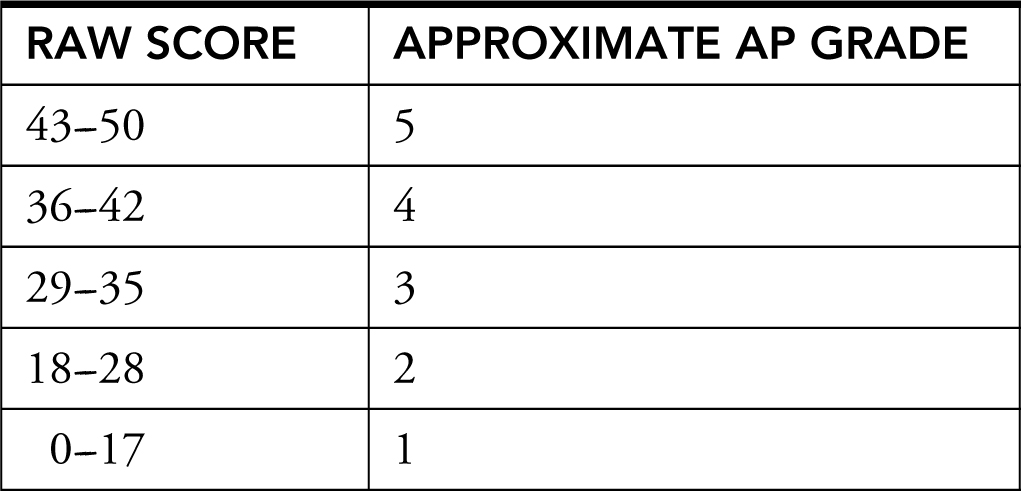
3.5 Calculate Your Score
Short-Answer Questions
Questions 1–50 for AP Calculus AB

AP Calculus AB Diagnostic Test