Calculus AB and Calculus BC
DIAGNOSTIC TESTS
![]()
All directions on the Diagnostic Tests reflect those seen on the actual exams. Please record all answers separately.
*Answer Sheets Are For Reference Only.
Diagnostic Test Calculus AB
![]()
All questions are linked to their individual answers. Simply click on the question numbers to move back and forth.
SECTION I
Part A TIME: 55 MINUTES
The use of calculators is not permitted for this part of the examination. There are 28 questions in Part A, for which 55 minutes are allowed. Because there is no deduction for wrong answers, you should answer every question, even if you need to guess.
Directions: Choose the best answer for each question.
1. ![]()
(A) 3
(B) 1
(C) −3
(D) ∞
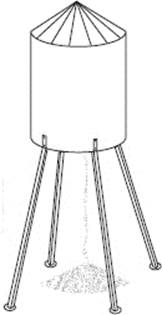
(E) 0
2. 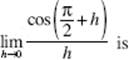
(A) 1
(B) nonexistent
(C) 0
(D) −1
(E) none of these
3. If, for all x, f ′(x) = (x − 2)4 (x − 1)3, it follows that the function f has
(A) a relative minimum at x = 1
(B) a relative maximum at x = 1
(C) both a relative minimum at x = 1 and a relative maximum at x = 2
(D) neither a relative maximum nor a relative minimum
(E) relative minima at x = 1 and at x = 2
4. Let ![]() Which of the following statements is (are) true?
Which of the following statements is (are) true?
I. F ′(0) = 5
II. F(2) < F(6)
III. F is concave upward.
(A) I only
(B) II only
(C) III only
(D) I and II only
(E) I and III only
5. If f (x) = 10x and 101.04 ![]() 10.96, which is closest to f ′(1)?
10.96, which is closest to f ′(1)?
(A) 0.24
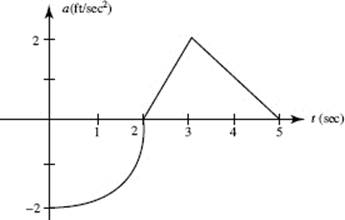
(B) 0.92
(C) 0.96
(D) 10.5
(E) 24
6. If f is differentiable, we can use the line tangent to f at x = a to approximate values of f near x = a. Suppose this method always underestimates the correct values. If so, then at x = a, the graph of f must be
(A) positive
(B) increasing
(C) decreasing
(D) concave upward
(E) concave downward
7. If f (x) = cos x sin 3x, then ![]() is equal to
is equal to
(A) ![]()
(B) ![]()
(C) 0
(D) 1
(E) ![]()
8. ![]() is equal to
is equal to
(A) ![]()
(B) ln ![]()
(C) ![]() (ln 2 − 1)
(ln 2 − 1)
(D) ![]()
(E) ln 2
9. The graph of f ″ is shown below. If f ′(1) = 0, then f ′(x) = 0 at x =
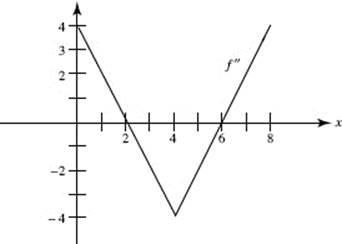
(A) 0
(B) 2
(C) 3
(D) 4
(E) 7
Questions 10 and 11. Use the following table, which shows the values of differentiable functions f and g.
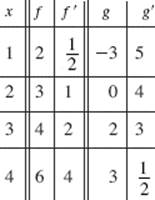
10. If P(x) = g2 (x), then P ′(3) equals
(A) 4
(B) 6
(C) 9
(D) 12
(E) 18
11. If H(x) = f −1(x), then H ′(3) equals
(A) ![]()
(B) ![]()
(C) ![]()
(D) ![]()
(E) 1
12. The total area of the region bounded by the graph of ![]() and the x-axis is
and the x-axis is
(A) ![]()
(B) ![]()
(C) ![]()
(D) ![]()
(E) 1
13. The graph of ![]() is concave upward when
is concave upward when
(A) x > 3
(B) 1 < x < 3
(C) x > 1
(D) x < 1
(E) x < 3
14. As an ice block melts, the rate at which its mass, M, decreases is directly proportional to the square root of the mass. Which equation describes this relationship?
(A) ![]()
(B) ![]()
(C) ![]()
(D) ![]()
(E) ![]()
15. The average (mean) value of tan x on the interval from x = 0 to ![]() is
is
(A) ln ![]()
(B) ![]() ln 2
ln 2
(C) ln 2
(D) ![]()
(E) ![]()
16. ![]()
(A) −cos (x2) + C
(B) cos (x2) + C
(C) ![]()
(D) 2x cos x2 + C
(E) none of these
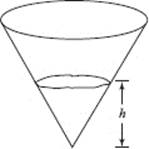
17. Water is poured at a constant rate into the conical reservoir shown in the figure. If the depth of the water, h, is graphed as a function of time, the graph is
(A) decreasing
(B) constant
(C) linear
(D) concave upward
(E) concave downward
18. If 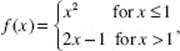 then
then
(A) f (x) is not continuous at x = 1
(B) f (x) is continuous at x = 1 but f ′(1) does not exist
(C) f ′(1) exists and equals 1
(D) f ′(1) = 2
(E) ![]() does not exist
does not exist
19. ![]()
(A) −∞
(B) −1
(C) 1
(D) ∞
(E) nonexistent
Questions 20 and 21. The graph below consists of a quarter-circle and two line segments, and represents the velocity of an object during a 6-second interval.
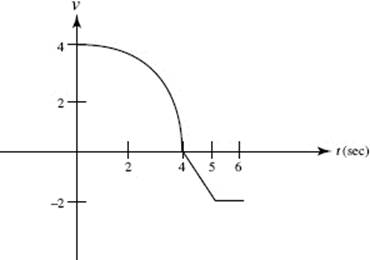
20. The object’s average speed (in units/sec) during the 6-second interval is
(A) ![]()
(B) ![]()
(C) −1
(D) ![]()
(E) 1
21. The object’s acceleration (in units/sec2) at t = 4.5 is
(A) 0
(B) −1
(C) −2
(D) ![]()
(E) ![]()
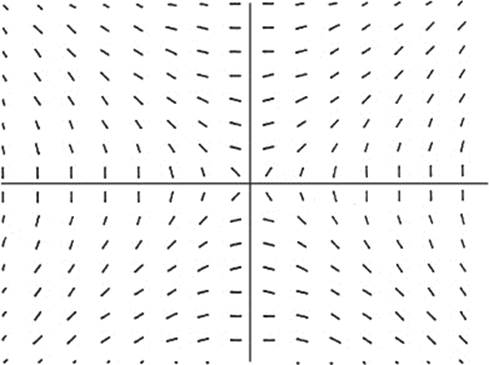
22. Which of the following equations can be a solution of the differential equation whose slope field is shown above?
(A) 2xy = 1
(B) 2x + y = 1
(C) 2x2 + y2 = 1
(D) 2x2 − y2 = 1
(E) y = 2x2 + 1
23. If y is a differentiable function of x, then the slope of the curve of xy2 − 2y + 4y3 = 6 at the point where y = 1 is
(A) ![]()
(B) ![]()
(C) ![]()
(D) ![]()
(E) 2
24. In the following, L(n), R(n), M(n), and T(n) denote, respectively, left, right, midpoint, and trapezoidal sums with n subdivisions. Which of the following is not equal exactly to ![]()
(A) L(2)
(B) M(2)
(C) T(3)
(D) M(4)
(E) R(6)
25. The table shows some values of a differentiable function f and its derivative f ′:
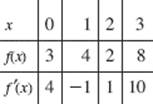
Find ![]()
(A) 5
(B) 6
(C) 11.5
(D) 14
(E) 17
26. The solution of the differential equation ![]() for which y = −1 when x = 1 is
for which y = −1 when x = 1 is
(A) ![]() for x ≠ 0
for x ≠ 0
(B) ![]() for x > 0
for x > 0
(C) ln y2 = x2 − 1 for all x
(D) ![]() for x ≠ 0
for x ≠ 0
(E) ![]() for x > 0
for x > 0
27. The base of a solid is the region bounded by the parabola y2 = 4x and the line x = 2. Each plane section perpendicular to the x-axis is a square. The volume of the solid is
(A) 6
(B) 8
(C) 10
(D) 16
(E) 32
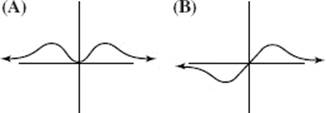
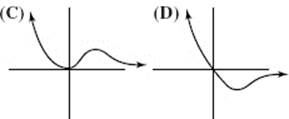
28. Which of the following could be the graph of ![]()
Part B TIME: 50 MINUTES
Some questions in this part of the examination require the use of a graphing calculator. There are 17 questions in Part B, for which 50 minutes are allowed. Because there is no deduction for wrong answers, you should answer every question, even if you need to guess.
Directions: Choose the best answer for each question. If the exact numerical value of the correct answer is not listed as a choice, select the choice that is closest to the exact numerical answer.
29. If F(3) = 8 and F ′(3) = −4 then F(3.02) is approximately
(A) −8.08
(B) 7.92
(C) 7.98
(D) 8.02
(E) 8.08
30. An object moving along a line has velocity v(t) = t cos t − ln (t + 2), where 0 ≤ t ≤ 10. How many times does the object reverse direction?
(A) none
(B) one
(C) two
(D) three
(E) four
Questions 31 and 32. Refer to the graph of f ′ below.
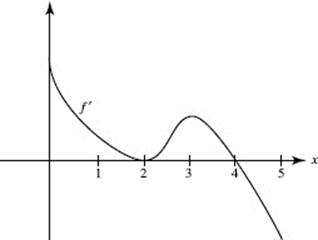
31. f has a local minimum at x =
(A) 0 only
(B) 4 only
(C) 0 and 4
(D) 0 and 5
(E) 0, 4, and 5
32. The graph of f has a point of inflection at x =
(A) 2 only
(B) 3 only
(C) 4 only
(D) 2 and 3 only
(E) 2, 3, and 4
33. For what value of c on 0 < x < 1 is the tangent to the graph of f (x) = ex − x2 parallel to the secant line on the interval [0,1]?
(A) −0.248
(B) 0.351
(C) 0.500
(D) 0.693
(E) 0.718
34. Find the volume of the solid generated when the region bounded by the y-axis, y = ex, and y = 2 is rotated around the y-axis.
(A) 0.296
(B) 0.592
(C) 2.427
(D) 3.998
(E) 27.577
35. The table below shows the “hit rate” for an Internet site, measured at various intervals during a day. Use a trapezoid approximation to estimate the total number of people who visited that site.
|
Time |
Midnight |
6 A.M. |
8 A.M. |
Noon |
5 P.M. |
8 P.M. |
Midnight |
|
People per |
5 |
2 |
3 |
8 |
10 |
16 |
5 |
(A) 5280
(B) 10,080
(C) 10,440
(D) 10,560
(E) 15,840
36. The acceleration of a particle moving along a straight line is given by a = 6t. If, when t = 0, its velocity, v, is 1 and its position, s, is 3, then at any time t
(A) s = t3 + 3
(B) s = t3 + 3t + 1
(C) s = t3 + t + 3
(D) ![]()
(E) ![]()
37. If y = f (x2) and ![]() is equal to
is equal to
(A) ![]()
(B) ![]()
(C) ![]()
(D) ![]()
(E) none of these
38. Find the area of the first quadrant region bounded by y = x2, y = cos (x), and the y-axis.
(A) 0.292
(B) 0.508
(C) 0.547
(D) 0.667
(E) 0.921
39. If the substitution x = 2t + 1 is used, which of the following is equivalent to ![]()
(A) ![]()
(B) ![]()
(C) ![]()
(D) ![]()
(E) ![]()
40. At noon, an experimenter has 50 grams of a radioactive isotope. At noon 9 days later only 45 grams remain. To the nearest day, how many days after the experiment started will there be only 20 grams?
(A) 54
(B) 59
(C) 60
(D) 75
(E) 78
41. A 26-foot ladder leans against a building so that its foot moves away from the building at the rate of 3 feet per second. When the foot of the ladder is 10 feet from the building, the top is moving down at the rate of r feet per second, where r is
(A) ![]()
(B) ![]()
(C) ![]()
(D) ![]()
(E) ![]()
42. If ![]() then F ′(x) =
then F ′(x) =
(A) ![]()
(B) ![]()
(C) ![]()
(D) ![]()
(E) ![]()
43. The graph above shows an object’s acceleration (in ft/sec2). It consists of a quarter-circle and two line segments. If the object was at rest at t = 5 seconds, what was its initial velocity?
(A) −2 ft/sec
(B) 3 − π ft/sec
(C) 0 ft/sec
(D) π − 3 ft/sec
(E) π + 3 ft/sec
44. Water is leaking from a tank at the rate of R(t) = 5 arc ![]() gallons per hour, where t is the number of hours since the leak began. How many gallons will leak out during the first day?
gallons per hour, where t is the number of hours since the leak began. How many gallons will leak out during the first day?
(A) 7
(B) 82
(C) 124
(D) 141
(E) 164
45. Find the y-intercept of the line tangent to y = (x3 − 4x2 + 8)ecos x2 at x = 2.
(A) −21.032
(B) −2.081
(C) 0
(D) 4.161
(E) 21.746
SECTION II
Part A TIME: 30 MINUTES
2 PROBLEMS
A graphing calculator is required for some of these problems.
See instructions.
1. When a faulty seam opened at the bottom of an elevated hopper, grain began leaking out onto the ground. After a while, a worker spotted the growing pile below and began making repairs. The following table shows how fast the grain was leaking (in cubic feet per minute) at various times during the 20 minutes it took to repair the hopper.
|
t (min) |
0 |
4 |
5 |
7 |
10 |
12 |
18 |
20 |
|
L(t) (ft3 /min) |
4 |
7 |
9 |
8 |
6 |
5 |
2 |
0 |
(a) Estimate L ′(15).
(b) Explain in this context what your answer to part a means.
(c) The falling grain forms a conical pile that the worker estimates to be 5 times as far across as it is deep. The pile was 3 feet deep when the repairs had been half completed. How fast was the depth increasing then?
(d) Estimate the total amount of grain that leaked out while the repairs were underway.
2. An object in motion along the x-axis has velocity v(t) = (t + et )sin t2 for 1 ≤ t ≤ 3.
(a) Sketch the graph of velocity as a function of time in the window [1,3] × [−15,20].
(b) When is the object moving to the left?
(c) Give one value of t from the interval in part (b) at which the speed of the object is increasing. Justify your answer.
(d) At t = 1 this object’s position was x = 10. Where is the object when t = 3?
Part B TIME: 60 MINUTES
4 PROBLEMS
No calculator is allowed for any of these problems.
If you finish Part B before time has expired, you may return to work on Part A, but you may not use a calculator.
3. Let h be a function that is even and continuous on the closed interval [−4,4]. The function h and its derivatives have the properties indicated in the table below. Use this information to sketch a possible graph of h on [−4,4].
|
x |
h(x) |
h ′(x) |
h ″(x) |
|
0 |
− |
0 |
+ |
|
0 < x < 1 |
− |
+ |
+ |
|
1 |
0 |
+ |
0 |
|
1 < x < 2 |
+ |
+ |
− |
|
2 |
+ |
0 |
0 |
|
2 < x < 3 |
+ |
+ |
+ |
|
3 |
+ |
undefined |
undefined |
|
3 < x < 4 |
+ |
− |
− |
4. Let C represent the curve determined by ![]() for −2 ≤ x ≤ 11.
for −2 ≤ x ≤ 11.
(a) Let R represent the region between C and the x-axis. Find the area of R.
(b) Set up, but do not solve, an equation to find the value of k such that the line x = k divides R into two regions of equal area.
(c) Set up an integral for the volume of the solid generated when R is rotated around the x-axis.
5. Let y = f (x) be the function that has an x-intercept at (2,0) and satisfies the differential equation ![]()
(a) Solve the differential equation, expressing y as a function of x and specifying the domain of the function.
(b) Find the equation of each horizontal asymptote to the graph of y = f (x).
6. The graph of function f consists of the semicircle and line segment shown in the figure. Define the area function ![]()
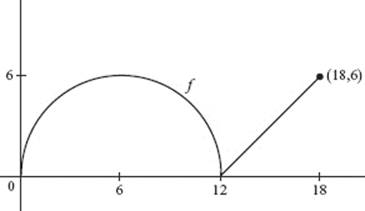
(a) Find A(6) and A(18).
(b) What is the average value of f on the interval 0 ≤ x ≤ 18?
(c) Write the equation of the line tangent to the graph of A at x = 6.
(d) Use this line to estimate the area between f and the x-axis on [0,7].
(e) Give the coordinates of any points of inflection on the graph of A. Justify your answer.
*Answer Sheets Are For Reference Only.