Calculus AB and Calculus BC
CHAPTER 4 Applications of Differential Calculus
Practice Exercises
Part A. Directions: Answer these questions without using your calculator.
1. The slope of the curve y3 − xy2 = 4 at the point where y = 2 is
(A) −2
(B) ![]()
(C) ![]()
(D) ![]()
(E) 2
2. The slope of the curve y2 − xy − 3x = 1 at the point (0, −1) is
(A) −1
(B) −2
(C) +1
(D) 2
(E) −3
3. The equation of the tangent to the curve y = x sin x at the point ![]() is
is
(A) y = x − π
(B) ![]()
(C) y = π − x
(D) ![]()
(E) y = x
4. The tangent to the curve of y = xe−x is horizontal when x is equal to
(A) 0
(B) 1
(C) −1
(D) ![]()
(E) none of these
5. The minimum value of the slope of the curve y = x5 + x3 − 2x is
(A) 0
(B) 2
(C) 6
(D) −2
(E) none of these
6. The equation of the tangent to the hyperbola x2 − y2 = 12 at the point (4, 2) on the curve is
(A) x − 2y + 6 = 0
(B) y = 2x
(C) y = 2x − 6
(D) ![]()
(E) x + 2y = 6
7. The tangent to the curve y2 − xy + 9 = 0 is vertical when
(A) y = 0
(B) y = ± ![]()
(C) ![]()
(D) y = ±3
(E) none of these
8. The best approximation, in cubic inches, to the increase in volume of a sphere when the radius is increased from 3 to 3.1 in. is
(A) ![]()
(B) 0.04π
(C) 1.2π
(D) 3.6π
(E) 36π
9. When x = 3, the equation 2x2 − y3 = 10 has the solution y = 2. When x = 3.04, y ![]()
(A) 1.6
(B) 1.96
(C) 2.04
(D) 2.14
(E) 2.4
10. If the side e of a square is increased by 1%, then the area is increased approximately
(A) 0.02e
(B) 0.02e2
(C) 0.01e2
(D) 1%
(E) 0.01e
11. The edge of a cube has length 10 in., with a possible error of 1%. The possible error, in cubic inches, in the volume of the cube is
(A) 3
(B) 1
(C) 10
(D) 30
(E) none of these
12. The function f (x) = x4 − 4x2 has
(A) one relative minimum and two relative maxima
(B) one relative minimum and one relative maximum
(C) two relative maxima and no relative minimum
(D) two relative minima and no relative maximum
(E) two relative minima and one relative maximum
13. The number of inflection points of the curve in Question 12 is
(A) 0
(B) 1
(C) 2
(D) 3
(E) 4
14. The maximum value of the function ![]() is
is
(A) 0
(B) −4
(C) 2
(D) −2
(E) none of these
15. The total number of local maximum and minimum points of the function whose derivative, for all x, is given by f ′(x) = x(x − 3)2 (x + 1)4 is
(A) 0
(B) 1
(C) 2
(D) 3
(E) none of these
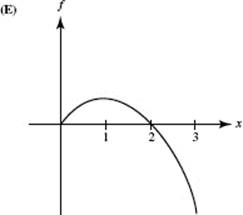
16. For which curve shown below are both f ′ and f ″ negative?
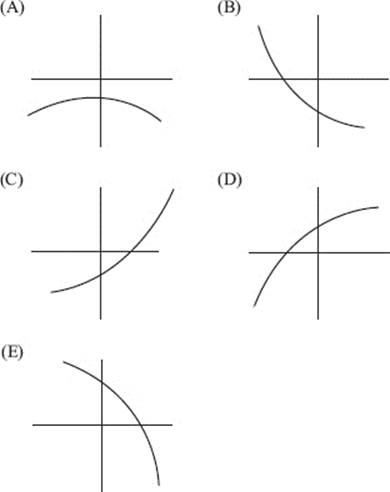
17. For which curve shown in question 16 is f ″ positive but f ′ negative?
In Questions 18–21, the position of a particle moving along a straight line is given by s = t3 − 6t2 + 12t − 8.
18. The distance s is increasing for
(A) t < 2
(B) all t except t = 2
(C) 1 < t < 3
(D) t < 1 or t > 3
(E) t > 2
19. The minimum value of the speed is
(A) 1
(B) 2
(C) 3
(D) 0
(E) none of these
20. The acceleration is positive
(A) when t > 2
(B) for all t, t ≠ 2
(C) when t < 2
(D) for 1 < t < 3
(E) for 1 < t < 2
21. The speed of the particle is decreasing for
(A) t > 2
(B) t < 3
(C) all t
(D) t < 1 or t > 2
(E) none of these
In Questions 22–24, a particle moves along a horizontal line and its position at time t is s = t4 − 6t3 + 12t2 + 3.
22. The particle is at rest when t is equal to
(A) 1 or 2
(B) 0
(C) ![]()
(D) 0, 2, or 3
(E) none of these
23. The velocity, v, is increasing when
(A) t > 1
(B) 1 < t < 2
(C) t < 2
(D) t < 1 or t > 2
(E) t > 0
24. The speed of the particle is increasing for
(A) 0 < t < 1 or t > 2
(B) 1 < t < 2
(C) t < 2
(D) t < 0 or t > 2
(E) t < 0
25. The displacement from the origin of a particle moving on a line is given by s = t4 − 4t3. The maximum displacement during the time interval −2 ![]() t
t ![]() 4 is
4 is
(A) 27
(B) 3
(C) 12 ![]() + 3
+ 3
(D) 48
(E) none of these
26. If a particle moves along a line according to the law s = t5 + 5t4, then the number of times it reverses direction is
(A) 0
(B) 1
(C) 2
(D) 3
(E) 4
BC ONLY
In Questions 27–30, ![]() is the (position) vector
is the (position) vector ![]() from the origin to a moving point P(x, y) at time t.
from the origin to a moving point P(x, y) at time t.
27. A single equation in x and y for the path of the point is
(A) x2 + y2 = 13
(B) 9x2 + 4y2 = 36
(C) 2x2 + 3y2 = 13
(D) 4x2 + 9y2 = 1
(E) 4x2 + 9y2 = 36
28. When t = 3, the speed of the particle is
(A) ![]()
(B) 2
(C) 3
(D) π
(E) ![]()
29. The magnitude of the acceleration when t = 3 is
(A) 2
(B) ![]()
(C) 3
(D) ![]()
(E) π
30. At the point where ![]() the slope of the curve along which the particle moves is
the slope of the curve along which the particle moves is
(A) ![]()
(B) ![]()
(C) ![]()
(D) ![]()
(E) none of these
31. A balloon is being filled with helium at the rate of 4 ft3 /min. The rate, in square feet per minute, at which the surface area is increasing when the volume is ![]() ft3 is
ft3 is
(A) 4π
(B) 2
(C) 4
(D) 1
(E) 2π
32. A circular conical reservoir, vertex down, has depth 20 ft and radius of the top 10 ft. Water is leaking out so that the surface is falling at the rate of ![]() ft/hr. The rate, in cubic feet per hour, at which the water is leaving the reservoir when the water is 8 ft deep is
ft/hr. The rate, in cubic feet per hour, at which the water is leaving the reservoir when the water is 8 ft deep is
(A) 4π
(B) 8π
(C) 16π
(D) ![]()
(E) ![]()
33. A local minimum value of the function ![]() is
is
(A) ![]()
(B) 1
(C) −1
(D) e
(E) 0
34. The area of the largest rectangle that can be drawn with one side along the x-axis and two vertices on the curve of y = e−x2 is
(A) ![]()
(B) ![]()
(C) ![]()
(D) ![]()
(E) ![]()
CHALLENGE
35. A line is drawn through the point (1, 2) forming a right triangle with the positive x- and y-axes. The slope of the line forming the triangle of least area is
(A) −1
(B) −2
(C) −4
(D) ![]()
(E) −3
CHALLENGE
36. The point(s) on the curve x2 − y2 = 4 closest to the point (6, 0) is (are)
(A) (2,0)
(B) ![]()
(C) ![]()
(D) ![]()
(E) none of these
37. The sum of the squares of two positive numbers is 200; their minimum product is
(A) 100
(B) ![]()
(C) 28
(D) ![]()
(E) none of these
38. The first-quadrant point on the curve y2 x = 18 that is closest to the point (2, 0) is
(A) (2,3)
(B) ![]()
(C) ![]()
(D) ![]()
(E) none of these
39. If h is a small negative number, then the local linear approximation for ![]() is
is
(A) ![]()
(B) ![]()
(C) ![]()
(D) ![]()
(E) ![]()
40. If f (x) = xe−x, then at x = 0
(A) f is increasing
(B) f is decreasing
(C) f has a relative maximum
(D) f has a relative minimum
(E) f ′ does not exist
41. A function f has a derivative for each x such that |x| < 2 and has a local minimum at (2, −5). Which statement below must be true?
(A) f ′(2) = 0.
(B) f ′ exists at x = 2.
(C) The graph is concave up at x = 2.
(D) f ′(x) < 0 if x < 2, f ′(x) > 0 if x > 2.
(E) None of the preceding is necessarily true.
42. The height of a rectangular box is 10 in. Its length increases at the rate of 2 in./sec; its width decreases at the rate of 4 in./sec. When the length is 8 in. and the width is 6 in., the rate, in cubic inches per second, at which the volume of the box is changing is
(A) 200
(B) 80
(C) −80
(D) −200
(E) −20
43. The tangent to the curve x3 + x2 y + 4y = 1 at the point (3, −2) has slope
(A) −3
(B) ![]()
(C) ![]()
(D) ![]()
(E) ![]()
44. If f (x) = ax4 + bx2 and ab > 0, then
(A) the curve has no horizontal tangents
(B) the curve is concave up for all x
(C) the curve is concave down for all x
(D) the curve has no inflection point
(E) none of the preceding is necessarily true
45. A function f is continuous and differentiable on the interval [0,4], where f ′ is positive but f ″ is negative. Which table could represent points on f ?
(A) ![]()
(B) ![]()
(C) ![]()
(D) ![]()
(E) ![]()
46. The equation of the tangent to the curve with parametric equations x = 2t + 1, y = 3 − t3 at the point where t = 1 is
(A) 2x + 3y = 12
(B) 3x + 2y = 13
(C) 6x + y = 20
(D) 3x − 2y = 5
(E) none of these
BC ONLY
47. Approximately how much less than 4 is ![]()
(A) ![]()
(B) ![]()
(C) ![]()
(D) ![]()
(E) 1
48. The best linear approximation for f (x) = tan x near ![]() is
is
(A) ![]()
(B) ![]()
(C) ![]()
(D) ![]()
(E) ![]()
49. When h is near zero, ekh, using the tangent-line approximation, is approximately
(A) k
(B) kh
(C) 1
(D) 1 + k
(E) 1 + kh
50. If f (x) = cx2 + dx + e for the function shown in the graph, then
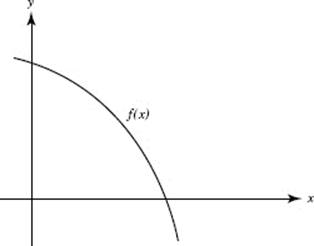
(A) c, d, and e are all positive
(B) c > 0, d < 0, e < 0
(C) c > 0, d < 0, e > 0
(D) c < 0, d > 0, e > 0
(E) c < 0, d < 0, e > 0
Part B. Directions: Some of the following questions require the use of a graphing calculator.
51. The point on the curve ![]() at which the normal is parallel to the line y = −3x + 6 is
at which the normal is parallel to the line y = −3x + 6 is
(A) (4,3)
(B) (0,1)
(C) ![]()
(D) (4, −3)
(E) ![]()
52. The equation of the tangent to the curve x2 = 4y at the point on the curve where x = −2 is
(A) x + y − 3 = 0
(B) y − 1 = 2x(x + 2)
(C) x − y + 3 = 0
(D) x + y − 1 = 0
(E) x + y + 1 = 0
53. The table shows the velocity at time t of an object moving along a line. Estimate the acceleration (in ft/sec2) at t = 6 sec.
![]()
(A) −6
(B) −1.8
(C) −1.5
(D) 1.5
(E) 6
Use the graph shown, sketched on [0, 7], for Questions 54–56.
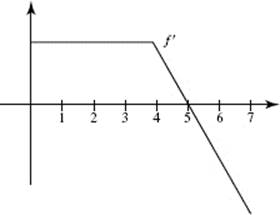
54. From the graph it follows that
(A) f is discontinuous at x = 4
(B) f is decreasing for 4 < x < 7
(C) f is constant for 0 < x < 4
(D) f has a local maximum at x = 0
(E) f has a local minimum at x = 7
55. Which statement best describes f at x = 5?
(A) f has a root.
(B) f has a maximum.
(C) f has a minimum.
(D) The graph of f has a point of inflection.
(E) none of these
56. For which interval is the graph of f concave downward?
(A) (0,4)
(B) (4,5)
(C) (5,7)
(D) (4,7)
(E) none of these
Use the graph shown for Questions 57–63. It shows the velocity of an object moving along a straight line during the time interval 0 ≤ t ≤ 5.
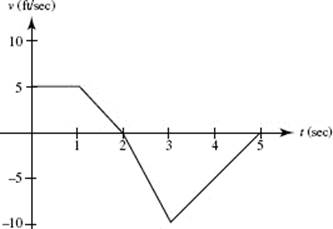
57. The object attains its maximum speed when t =
(A) 0
(B) 1
(C) 2
(D) 3
(E) 5
58. The speed of the object is increasing during the time interval
(A) (0,1)
(B) (1,2)
(C) (0,2)
(D) (2,3)
(E) (3,5)
59. The acceleration of the object is positive during the time interval
(A) (0,1)
(B) (1,2)
(C) (0,2)
(D) (2,3)
(E) (3,5)
60. How many times on 0 < t < 5 is the object’s acceleration undefined?
(A) none
(B) 1
(C) 2
(D) 3
(E) more than 3
61. During 2 < t < 3 the object’s acceleration (in ft/sec2) is
(A) −10
(B) −5
(C) 0
(D) 5
(E) 10
62. The object is furthest to the right when t =
(A) 0
(B) 1
(C) 2
(D) 3
(E) 5
63. The object’s average acceleration (in ft/sec2) for the interval 0 ≤ t ≤ 3 is
(A) −15
(B) −5
(C) −3
(D) −1
(E) none of these
64. The line y = 3x + k is tangent to the curve y = x3 when k is equal to
(A) 1 or −1
(B) 0
(C) 3 or −3
(D) 4 or −4
(E) 2 or −2
65. The two tangents that can be drawn from the point (3,5) to the parabola y = x2 have slopes
(A) 1 and 5
(B) 0 and 4
(C) 2 and 10
(D) 2 and ![]()
(E) 2 and 4
66. The table shows the velocity at various times of an object moving along a line. An estimate of its acceleration (in ft/sec2) at t = 1 is
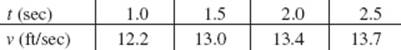
(A) 0.8
(B) 1.0
(C) 1.2
(D) 1.4
(E) 1.6
For Questions 67 and 68, f ′(x) = x sin x − cos x for 0 < x < 4.
67. f has a local maximum when x is approximately
(A) 0.9
(B) 1.2
(C) 2.3
(D) 3.4
(E) 3.7
68. The graph of f has a point of inflection when x is approximately
(A) 0.9
(B) 1.2
(C) 2.3
(D) 3.4
(E) 3.7
BC ONLY
In Questions 69–72, the motion of a particle in a plane is given by the pair of equations x = 2t and y = 4t − t2.
69. The particle moves along
(A) an ellipse
(B) a circle
(C) a hyperbola
(D) a line
(E) a parabola
70. The speed of the particle at any time t is
(A) ![]()
(B) ![]()
(C) ![]()
(D) ![]()
(E) ![]()
71. The minimum speed of the particle is
(A) 2
(B) ![]()
(C) 0
(D) 1
(E) 4
72. The acceleration of the particle
(A) depends on t
(B) is always directed upward
(C) is constant both in magnitude and in direction
(D) never exceeds 1 in magnitude
(E) is none of these
73. If a particle moves along a curve with constant speed, then
(A) the magnitude of its acceleration must equal zero
(B) the direction of acceleration must be constant
(C) the curve along which the particle moves must be a straight line
(D) its velocity and acceleration vectors must be perpendicular
(E) the curve along which the particle moves must be a circle
74. A particle is moving on the curve of y = 2x − ln x so that ![]() at all times t. At the point (1,2),
at all times t. At the point (1,2), ![]() is
is
(A) 4
(B) 2
(C) −4
(D) 1
(E) −2
In Questions 75–76, a particle is in motion along the polar curve r = 6 cos 2θ such that ![]() radian/sec when
radian/sec when ![]()
75. At that point, find the rate of change (in units per second) of the particle’s distance from the origin.
(A) ![]()
(B) ![]()
(C) ![]()
(D) ![]()
(E) ![]()
76. At that point, what is the horizontal component of the particle’s velocity?
(A) ![]()
(B) ![]()
(C) −2
(D) ![]()
(E) ![]()
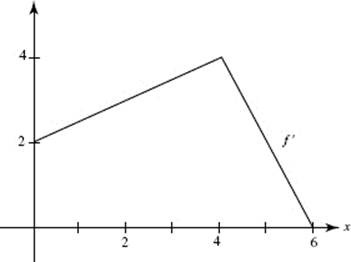
Use the graph of f ′ on [0,5], shown below, for Questions 77 and 78.
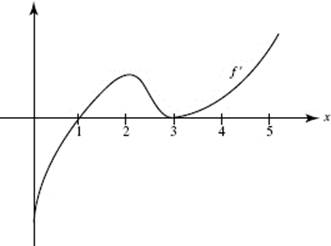
77. f has a local minimum at x =
(A) 0
(B) 1
(C) 2
(D) 3
(E) 5
78. The graph of f has a point of inflection at x =
(A) 1 only
(B) 2 only
(C) 3 only
(D) 2 and 3 only
(E) none of these
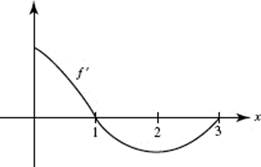
79. It follows from the graph of f ′, shown below, that
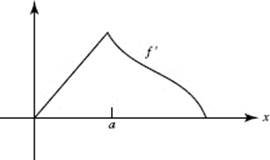
(A) f is not continuous at x = a
(B) f is continuous but not differentiable at x = a
(C) f has a relative maximum at x = a
(D) The graph of f has a point of inflection at x = a
(E) none of these
80. A vertical circular cylinder has radius r ft and height h ft. If the height and radius both increase at the constant rate of 2 ft/sec, then the rate, in square feet per second, at which the lateral surface area increases is
(A) 4πr
(B) 2π(r + h)
(C) 4π(r + h)
(D) 4πrh
(E) 4πh
81. A tangent drawn to the parabola y = 4 − x2 at the point (1, 3) forms a right triangle with the coordinate axes. The area of the triangle is
(A) ![]()
(B) ![]()
(C) ![]()
(D) 1
(E) ![]()
82. Two cars are traveling along perpendicular roads, car A at 40 mph, car B at 60 mph. At noon, when car A reaches the intersection, car B is 90 mi away, and moving toward it. At 1 P.M. the rate, in miles per hour, at which the distance between the cars is changing is
(A) −40
(B) 68
(C) 4
(D) −4
(E) 40
83. For Question 82, if t is the number of hours of travel after noon, then the cars are closest together when t is
(A) 0
(B) ![]()
(C) ![]()
(D) ![]()
(E) ![]()
The graph for Questions 84 and 85 shows the velocity of an object moving along a straight line during the time interval 0 ≤ t ≤ 12.
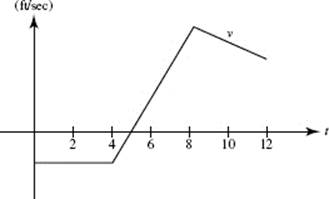
84. For what t does this object attain its maximum acceleration?
(A) 0 < t < 4
(B) 4 < t < 8
(C) t = 5
(D) t = 8
(E) t = 12
85. The object reverses direction at t =
(A) 4 only
(B) 5 only
(C) 8 only
(D) 5 and 8
(E) none of these
86. The graph of f ′ is shown below. If we know that f (2) = 10, then the local linearization of f at x = 2 is f (x) ![]()
(A) ![]()
(B) ![]()
(C) 3x − 3
(D) 3x + 4
(E) 10x − 17
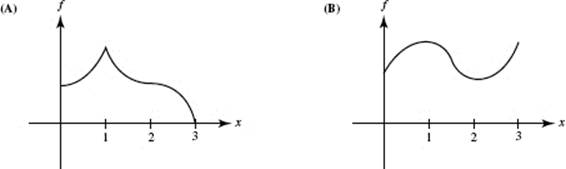
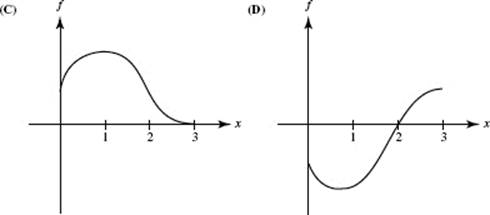
87. Given f ′ as graphed, which could be the graph of f ?
Use the following graph for Questions 88–90.
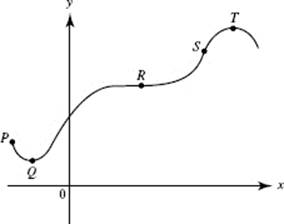
88. At which labeled point do both ![]() equal zero?
equal zero?
(A) P
(B) Q
(C) R
(D) S
(E) T
89. At which labeled point is ![]() positive and
positive and ![]() equal to zero?
equal to zero?
(A) P
(B) Q
(C) R
(D) S
(E) T
90. At which labeled point is ![]() equal to zero and
equal to zero and ![]() negative?
negative?
(A) P
(B) Q
(C) R
(D) S
(E) T
91. If f (6) = 30 and ![]() estimate f (6.02) using the line tangent to f at x = 6.
estimate f (6.02) using the line tangent to f at x = 6.
(A) 29.92
(B) 30.02
(C) 30.08
(D) 34.00
(E) none of these
92. The local linear approximation for ![]() near x = −3 is
near x = −3 is
(A) ![]()
(B) ![]()
(C) ![]()
(D) ![]()
(E) ![]()