Calculus AB and Calculus BC
CHAPTER 1 Functions
B. SPECIAL FUNCTIONS
The absolute-value function f (x) = |x| and the greatest-integer function g(x) = [x] are sketched in Figure N1–3.
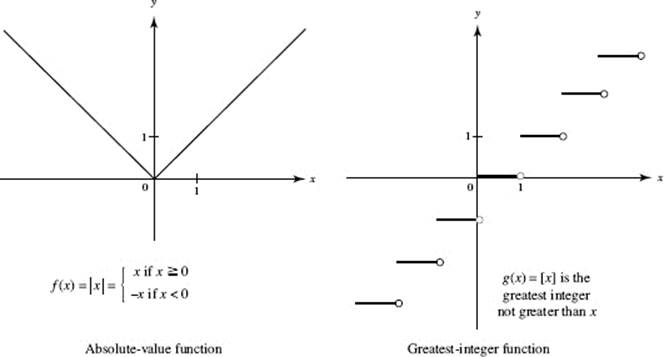
FIGURE N1–3
EXAMPLE 8
A function f is defined on the interval [−2, 2] and has the graph shown in Figure N1–4.
(a) Sketch the graph of y = |f (x)|.
(b) Sketch the graph of y = f (|x|).
(c) Sketch the graph of y = − f (x).
(d) Sketch the graph of y = f (−x).
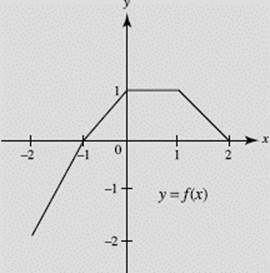
FIGURE N1–4
SOLUTIONS: The graphs are shown in Figures N1–4a through N1–4d.
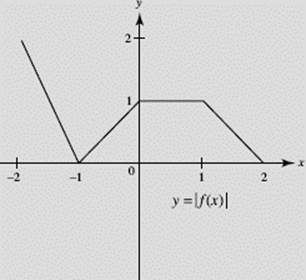
FIGURE N1–4a
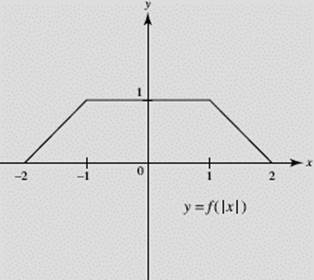
FIGURE N1–4b
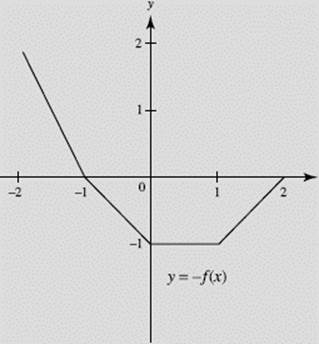
FIGURE N1–4c
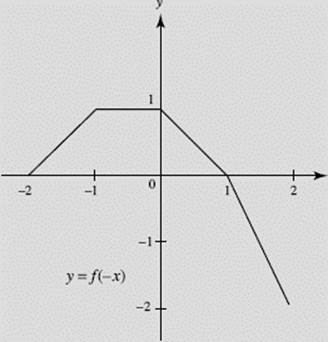
FIGURE N1–4d
Note that graph (c) of y = − f (x) is the reflection of y = f (x) in the x-axis, whereas graph (d) of y = f (−x) is the reflection of y = f (x) in the y-axis. How do the graphs of |f (x)| and f (|x|) compare with the graph of f (x)?
EXAMPLE 9
Let f (x) = x3 − 3 x2 + 2. Graph the following functions on your calculator in the window [−3,3] × [−3,3]: (a) y = f (x); (b) y = |f (x)|; (c) y = f (|x|).
SOLUTIONS:
(a) y = f (x)
See Figure N1–5a.
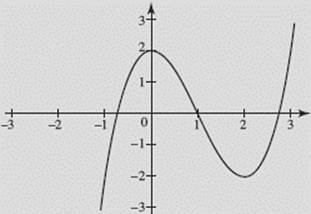
FIGURE N1–5a
(b) y = |f (x)|
See Figure N1–5b.
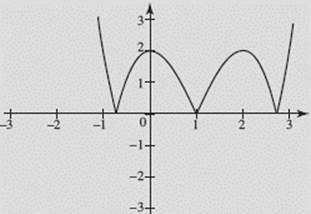
FIGURE N1–5b
(c) y = f (|x|)
See Figure N1–5c.
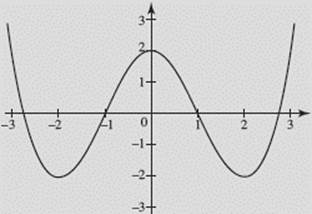
FIGURE N1–5c
Note how the graphs for (b) and (c) compare with the graph for (a).