Calculus AB and Calculus BC
CHAPTER 9 Differential Equations
C. EULER’S METHOD
BC ONLY
In §B we found solution curves to first-order differential equations graphically, using slope fields. Here we will find solutions numerically, using Euler’s method to find points on solution curves.
When we use a slope field we start at an initial point, then move step by step so the slope segments are always tangent to the solution curve. With Euler’s method we again select a starting point; but now we calculate the slope at that point (from the given d.e.), use the initial point and that slope to locate a new point, use the new point and calculate the slope at it (again from the d.e.) to locate still another point, and so on. The method is illustrated in Example 6.
BC ONLY
EXAMPLE 6
Let ![]() Use Euler’s method to approximate the y-values with four steps, starting at point P0 (1, 0) and letting Δx = 0.5.
Use Euler’s method to approximate the y-values with four steps, starting at point P0 (1, 0) and letting Δx = 0.5.
SOLUTION: The slope at P0 = (x0, y0) = (1,0) is ![]() To find the y-coordinate
To find the y-coordinate
of P1 (x1, y1), we add Δy to y0. Since ![]() ≈
≈ ![]() we estimate
we estimate ![]()
Δy = (slope at P0) · Δx = 3 · (0.5) = 1.5.
Then
y1 = y0 + Δy = 0 + 1.5 = 1.5
and
P1 = (1.5,1.5).
To find the y-coordinate of P2 (x2, y2) we add Δy to y1, where
Δy = (slope at P1) · ![]()
Then
y2 = y1 + Δy = 1.5 + 1.0 = 2.5
and
P2 = (2.0,2.5).
To find the y-coordinate of P3 (x3, y3) we add Δy to y2, where
Δy = (slope at P2) · ![]()
Then
y3 = y2 + Δy = 2.5 + 0.75 = 3.25,
P3 = (2.5, 3.25),
and so on.
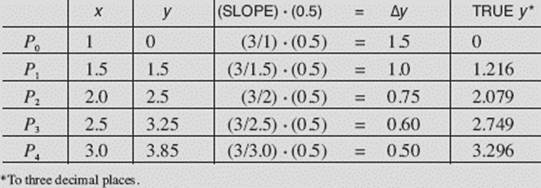
The table summarizes all the data, for the four steps specified, from x = 1 to x = 3:
TABLE FOR ![]()

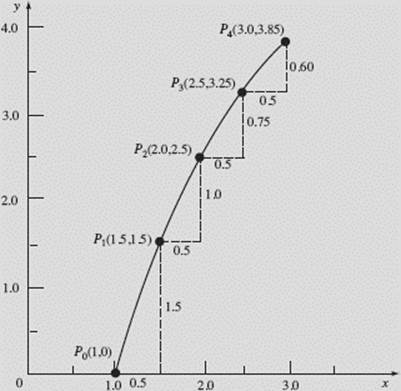
The table gives us the numerical solution of ![]() using Euler’s method. Figure N9–6a shows the graphical solution, which agrees with the data from the table, for x increasing from 1 to 3 by four steps with Δx equal to 0.5. Figure N9–6b shows this Euler graph and the particular solution of
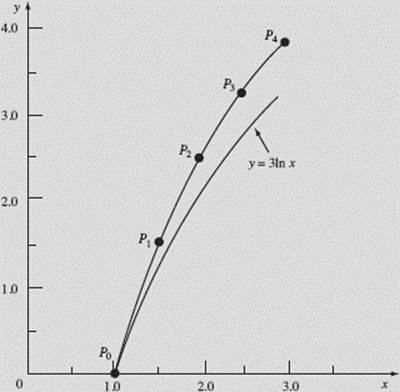
using Euler’s method. Figure N9–6a shows the graphical solution, which agrees with the data from the table, for x increasing from 1 to 3 by four steps with Δx equal to 0.5. Figure N9–6b shows this Euler graph and the particular solution of ![]() passing through the point (1,0), which is y = 3 ln x.
passing through the point (1,0), which is y = 3 ln x.

FIGURE N9–6a

FIGURE N9–6b
We observe that, since y ″ for 3 ln x equals ![]() the true curve is concave down and below the Euler graph.
the true curve is concave down and below the Euler graph.
The last column in the table shows the true values (to three decimal places) of y. The Euler approximation for 3 ln 3 is 3.85; the true value is 3.296. The Euler approximation with four steps is not very good! However, see what happens as we increase the number n of steps:
|
n |
EULER APPROXIMATION |
ERROR |
|
4 |
3.85 |
0.554 |
|
10 |
3.505 |
0.209 |
|
20 |
3.398 |
0.102 |
|
40 |
3.346 |
0.050 |
|
80 |
3.321 |
0.025 |
Doubling the number of steps cuts the error approximately in half.
EXAMPLE 7
Given the d.e. ![]() = x + y with initial condition y(0) = 0, use Euler’s method with Δx = 0.1 to estimate y when x = 0.5.
= x + y with initial condition y(0) = 0, use Euler’s method with Δx = 0.1 to estimate y when x = 0.5.
SOLUTION: Here are the relevant computations:
|
x |
y |
(SLOPE) · Δx = (x + y) · (0.1) = Δ y |
|
|
P0 |
0 |
0 |
0(0.1) = 0 |
|
P1 |
0.1 |
0 |
(0.1)(0.1) = 0.01 |
|
P2 |
0.2 |
0.01 |
(0.21)(0.1) = 0.021 |
|
P3 |
0.3 |
0.031 |
(0.331)(0.1) = 0.033 |
|
P4 |
0.4 |
0.064 |
(0.464)(0.1) = 0.046 |
|
P5 |
0.5 |
0.110 |
A Caution: Euler’s method approximates the solution by substituting short line segments in place of the actual curve. It can be quite accurate when the step sizes are small, but only if the curve does not have discontinuities, cusps, or asymptotes.
For example, the reader may verify that the curve ![]() for the domain
for the domain ![]() solves the differential equation
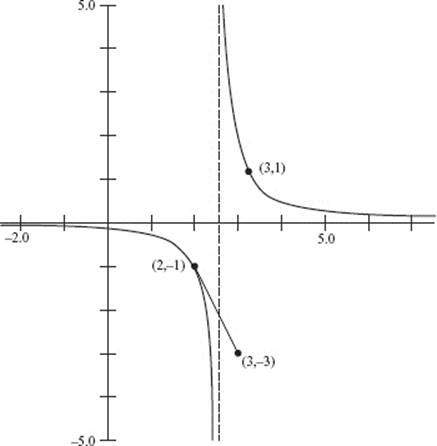
solves the differential equation ![]() with initial condition y = −1 when x = 2. The domain restriction is important. Recall that a particular solution must be differentiable on an interval containing the initial point. If we attempt to approximate this solution using Euler’s method with step size Δx = 1, the first step carries us to point (3, −3), beyond the discontinuity at
with initial condition y = −1 when x = 2. The domain restriction is important. Recall that a particular solution must be differentiable on an interval containing the initial point. If we attempt to approximate this solution using Euler’s method with step size Δx = 1, the first step carries us to point (3, −3), beyond the discontinuity at ![]() and thus outside the domain of the solution. The accompanying graph (Figure N9–7) shows that this is nowhere near the solution curve with initial point y = 1 when x = 3 (and whose domain is
and thus outside the domain of the solution. The accompanying graph (Figure N9–7) shows that this is nowhere near the solution curve with initial point y = 1 when x = 3 (and whose domain is ![]() ). Here, Euler’s method fails because it leaps blindly across the vertical asymptote at
). Here, Euler’s method fails because it leaps blindly across the vertical asymptote at ![]()
Always pay attention to the domain of any particular solution.
BC ONLY

FIGURE N9–7