High School Geometry Unlocked (2016)
Chapter 1. Translation, Reflection, Rotation
Lesson 1.2. Translation
Translation refers to moving a figure to a new location. In other words, it’s shifting the figure up, down, left, right, or diagonally.
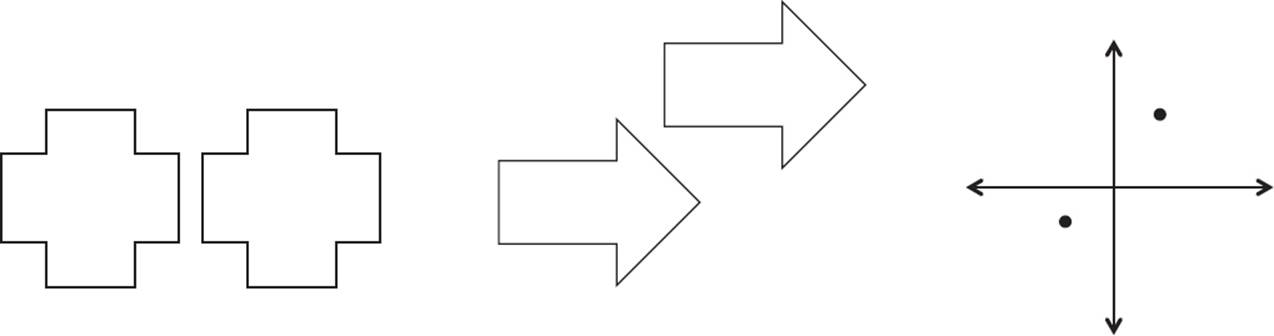
Examples of Translations
The most common way of dealing with translations is in the coordinate plane. You may need to move a figure in a plane, identify how a figure was moved, or write an algebraic expression for a translation.
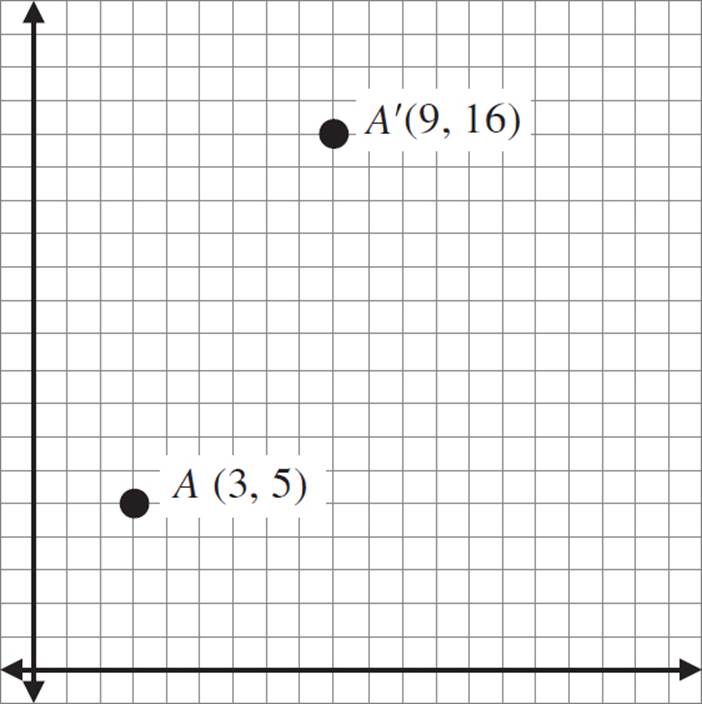
When labeling points, it’s customary to use the same letter for the image and pre-image, and usually to use capital letters. You should also add a prime mark to the label for the image, to distinguish it from the pre-image. A prime mark is almost like an apostrophe, but straighter, and it’s used almost exclusively for mathematics. In the figure above, A is the pre-image and A′ is the image.
Use a prime mark to distinguish images from pre-images. Example: Pre-image A and image A′
Take a look at the graph again.
The prime mark is also
used to label feet and
inches. A single prime
mark is used for feet,
and a double prime
mark for inches. For
example, 5′7″ means
5 feet and 7 inches.
A′ is the result of moving A upward and to the right. To find out how much it moved, find the difference between the two coordinates. When looking at the x-coordinates, we see that it moved from 3 to 9. The difference between these coordinates is 6 (9 − 3 = 6); so, this translation moved the point to the right by 6 coordinates. Now do the same for the y-coordinates. The difference between the y-coordinates is 11 (16 − 5 = 11); so, this translation moved the point upward by 11 coordinates.
To describe this translation, you can say that the point has been moved horizontally 6 units, and vertically 11 units. (It makes more sense to describe the x first, since x comes first in x, y coordinate pairs.)
You can also describe the translation in algebraic terms. That is, if the pre-image is (x, y), then the image is (x + 6, y + 11).
Notating Translations
(x + a) moves a point a units in the positive x direction (right).
(x − a) moves a point a units in the negative x direction (left).
(y + a) moves a point a units in the positive y direction (up).
(y − a) moves a point a units in the negative y direction (down).
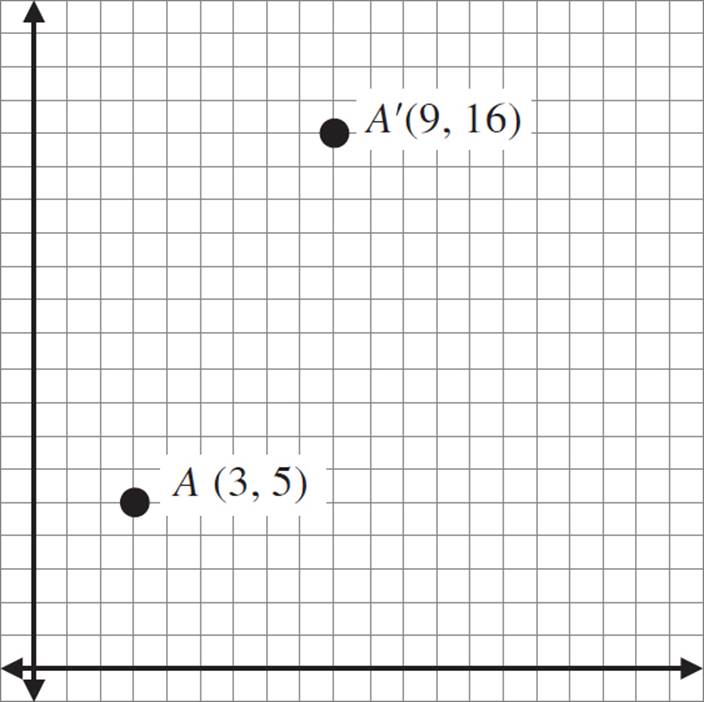
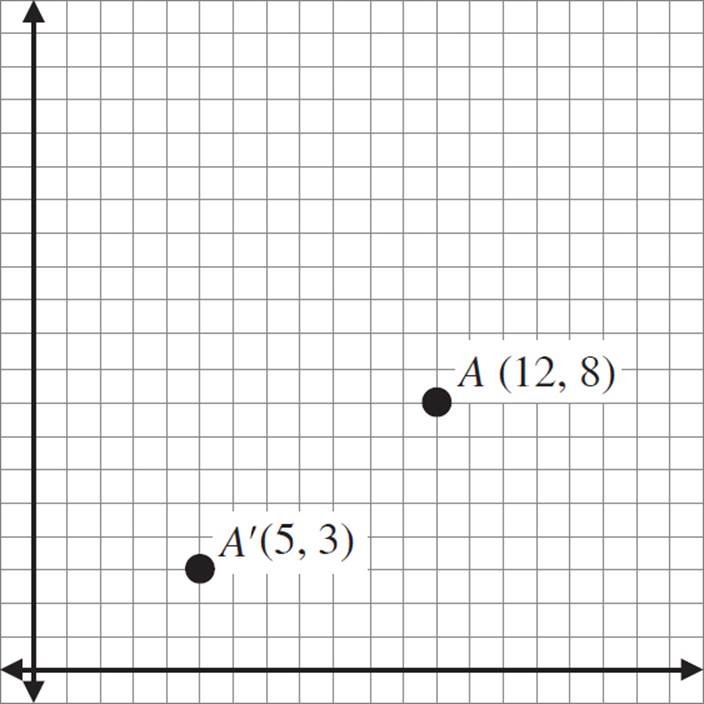
Now take a look at this graph.
If you’re not sure about
signs in the coordinate
plane, remember this:
down is negative, and up
is positive; left is negative,
and right is positive.
In this example, the point has moved down and to the left. The translation is negative in both directions. We can find the difference between the coordinates, just as we did in the previous example. The difference between the x-coordinates is (5 − 12), or −7. The difference between the y-coordinates is (3 − 8), or −5.
Therefore, this translation is horizontally −7, vertically −5.
We can also express this translation algebraically: (x − 7, y − 5)

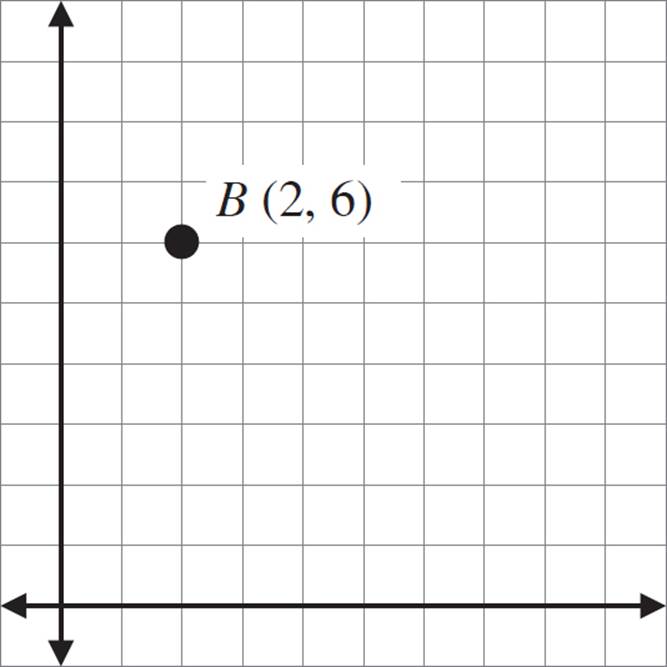
Draw the translated image of B, in which the image is moved 4 units in the positive x direction and 5 points in the negative y direction.
Supplies
You may want to use graph
paper for the Example
questions in this chapter.
Or, download a larger
version of each image from
your online student tools.
To perform this translation, you’re going to move the point right by 4 units, and down by 5 units.
Add 4 to the x-coordinate; so, the x-coordinate is (2 + 4), or 6.
Subtract 5 from the y-coordinate; so, the y-coordinate is (6 − 5), or 1.
The coordinate for the image of B is (6, 1).
If you prefer, you can count out on the grid to find the point.
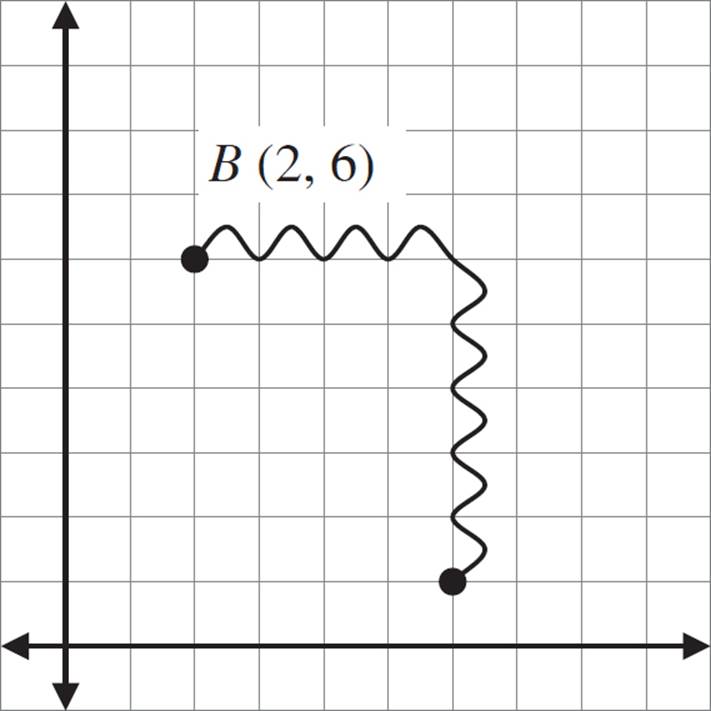
Start at (2, 6). If you count right 4 coordinates, you end up at x = 6. Then count down 5, and you’re at y = 1.
The coordinate for the image of B is (6, 1).
Using both methods together is a great way to avoid mistakes!


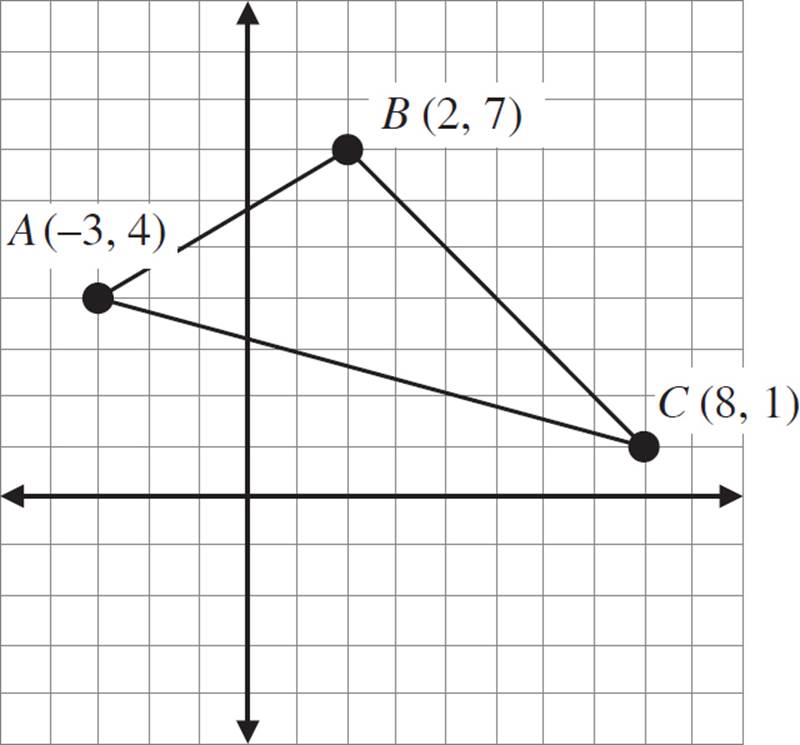
Graph and label the image of triangle ABC under the translation (x − 2, y − 4).
To perform this translation, focus on just the three vertices. Translate those three points, and then use the points to draw the image of the triangle. Move each point left 2, and down 4.
Try it yourself; then read on for the solution.
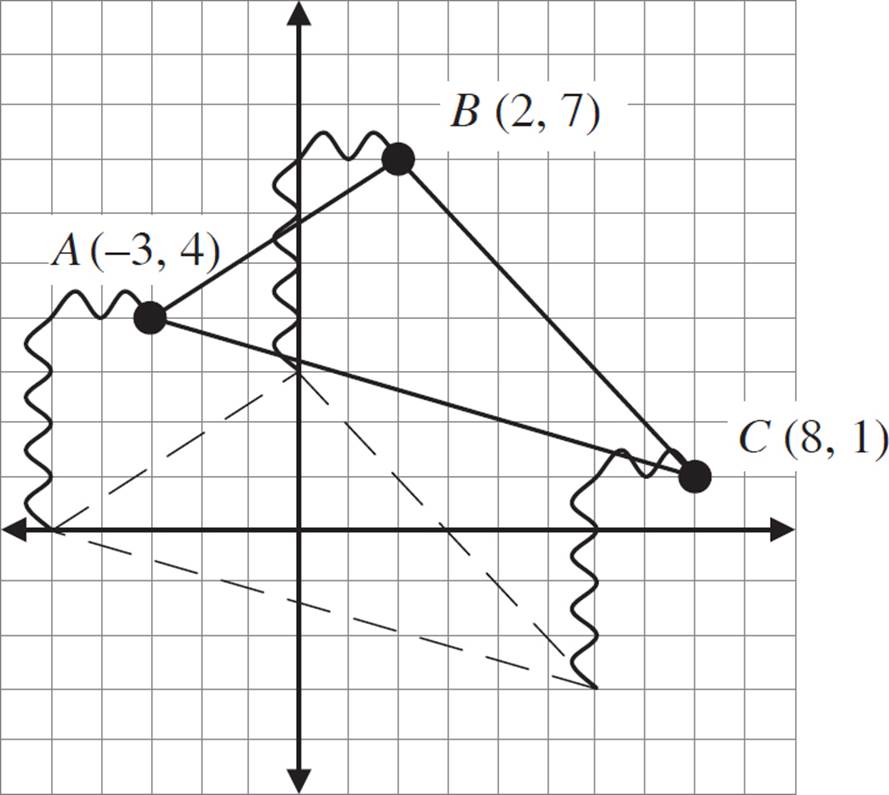
Coordinate A is (−3, 4), so the coordinates of A′ are x = (−3 − 2) = −5, and y = (4 − 4) = 0. Point A′ is at (−5, 0).
Coordinate B is (2, 7), so the coordinates of B′ are x = (2 − 2) = 0, and y = (7 − 4) = 3. Point B′ is at (0, 3).
Coordinate C is (8, 1), so the coordinates of C′ are x = (8 − 2) = 6, and y = (1 − 4) = −3. Point C′ is at (6, −3).
Your image should have vertices at the following coordinates: A′ (−5, 0), B′ (0, 3), and C′ (6, −3).
Don’t forget to draw the triangle!
You can also count out on the grid to find the translated vertices.


|
Pre-Image |
Image |
|
A (0, 0) |
A′ (−3, 2) |
|
B (5, 0) |
B′ |
|
C (0, 6) |
C′ |
|
D (5, 6) |
D′ |
A quadrilateral has the coordinates shown in the table above. If the image has A′ at point (−3, 2), what are the coordinates of B′, C′, and D′?
To find the coordinates for these points, first identify the translation that moves point A to A′. The x-coordinate moves from 0 to −3, so the horizontal move is x − 3. The y-coordinate moves from 0 to 2, so the vertical move is y + 2. Therefore, we want to translate each coordinate as (x − 3, y + 2). Try it; then check your work below.
The coordinates of B′ are x = (5 − 3) = 2, and y = (0 + 2) = 2. Point B′ is at (2, 2).
The coordinates of C′ are x = (0 − 3) = −3, and y = (6 + 2) = 8. Point C′ is at (−3, 8).
The coordinates of D′ are x = (5 − 3) = 2, and y = (6 + 2) = 8. Point D′ is at (2, 8).


Here is how you may see translations on the ACT.
Rectangle ABCD lies in the standard (x, y) coordinate plane with corners at A (4, 2), B (6, −1), C (1, −4), and D (−1, −1), and is represented by the 2 × 4 matrix 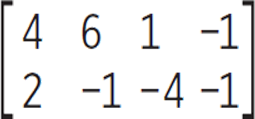 . ABCD is then translated, with the corners of the translated rectangle represented by the matrix
 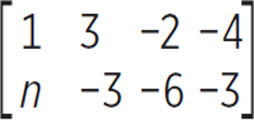 . What is the value of n ?
A. 0
B.−1
C.−2
D.−3
E.−4
TRANSLATING FUNCTIONS
If you took Algebra I, you most likely learned a little bit about graphing functions. We’ll use basic examples in this section, so for now, don’t worry about remembering everything you learned in class. However, you should know that a function takes an input and produces an output. For example, in the function f(x) = x + 5, x is the input, and x + 5 is the output. So, if x = 1, the output is 6 (= 1 + 5), and if x = 3, the output is 8 (= 3 + 5).
When working with
graphs of functions,
remember that input
values are graphed
on the x-axis, and
output values are
graphed on the y-axis.
In the examples that follow, you’ll see that by changing a function, you can observe fairly predictable changes in the graph of that function.
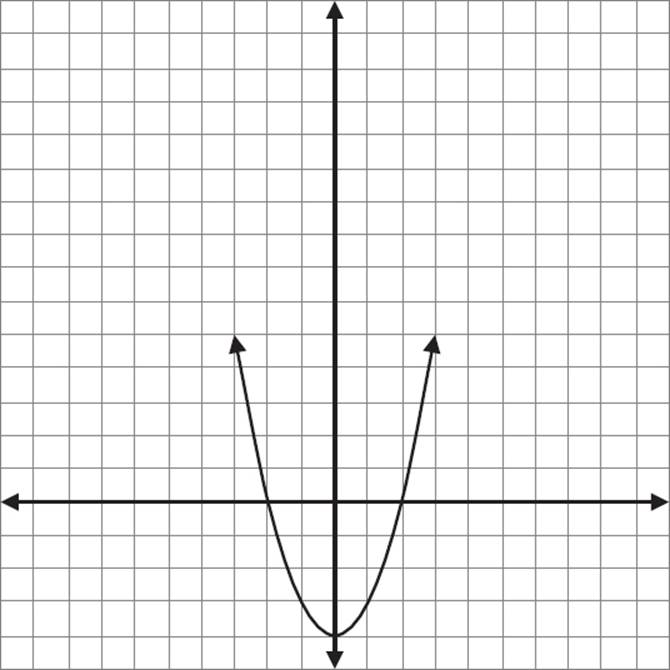
Consider the function f(x) = x2. In this function, we input a value x and get a value of x2 as the output. Some examples of points for this function would be f(2) = 4, f(3) = 9, and so on.
If we graph this function, the graph forms a curve. For every point on this curve, the value of the y-coordinate is the square of the value of the x-coordinate.
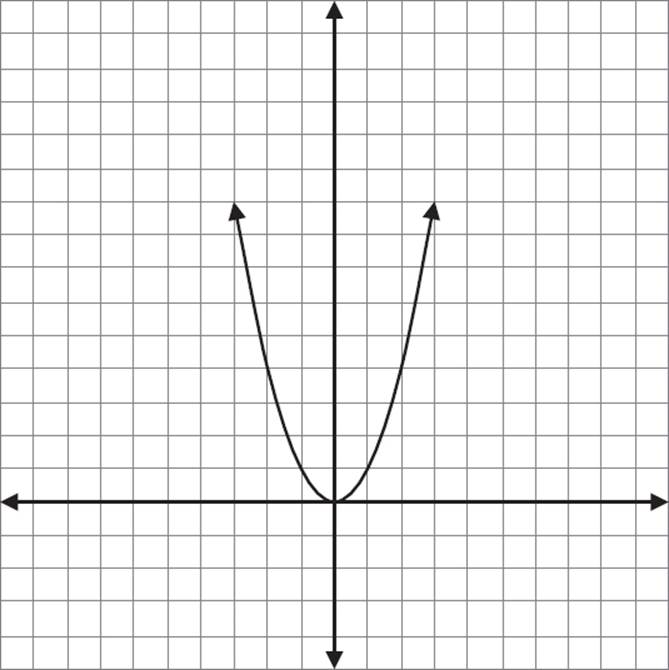
Graph of f(x) = x2
If we change the function slightly, we’ll change the appearance of the graph. Let’s make a new function to relate to f(x), which we previously defined as f(x) = x2. We’ll call the new function g(x), and define it as g(x) = f(x) + 4.
What that means is that for every input x, we find the value of f(x) and add 4 to it.
Let’s plug in x = 0.
f(0) = 0
g(0) = f(0) + 4
g(0) = 0 + 4
g(0) = 4
This creates the point (0, 4). Some other examples of points in this function are (1, 5), (2, 8), and (−1, 5).
The effect on the graph is that it looks the same as f(x), only it’s 4 units higher. It’s been translated upward.
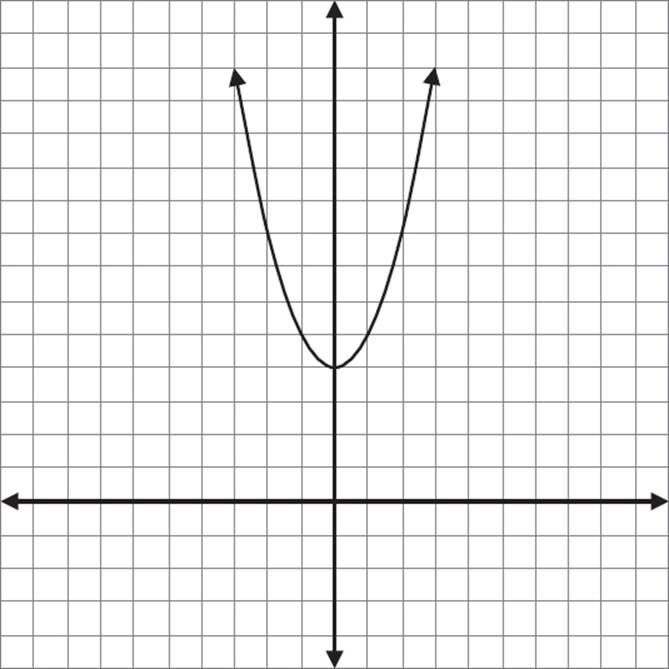
Graph of g(x) = f(x) + 4

Compare the points of the original rectangle with the first matrix to see that the x-values of A, B, C, and D run along the top row and their y-values run along the bottom row. For the translated rectangle ABCD, plot the points you know: B (3, −3), C (−2, −6), and D (−4, −3). When you’ve determined those points, note the relationship between them. In your figure, it should be clear that the distance from point C to point D will be the same as the distance from point B to point A. From C to D, the point shifts to the left 2 and up 3. Now do the same thing to point B to get A (1, 0) and n = 0, (A). Choices (B), (C), (D), and (E) are in the range of numbers of the problem, but do not translate properly. The correct answer is (A).
Similarly, if we graph a function that equals f(x) − 4, we take the graph of f(x) = x and shift it 4 units downward.
Graph of g(x) = f(x) − 4
If you change the expression used for the input, the graph will move differently. For example, let’s say that f(x) = x2, and a new function h(x) equals f(x + 4). If you plug in a value for x, what you’re doing is adding (x + 4) first and theninputting that value to f(x).
Let’s plug in x = −4.
h(−4) = f(−4 + 4)
h(−4) = f(0)
f(0) = 0
h(−4) = 0

Here is how you may see function translation on the SAT.
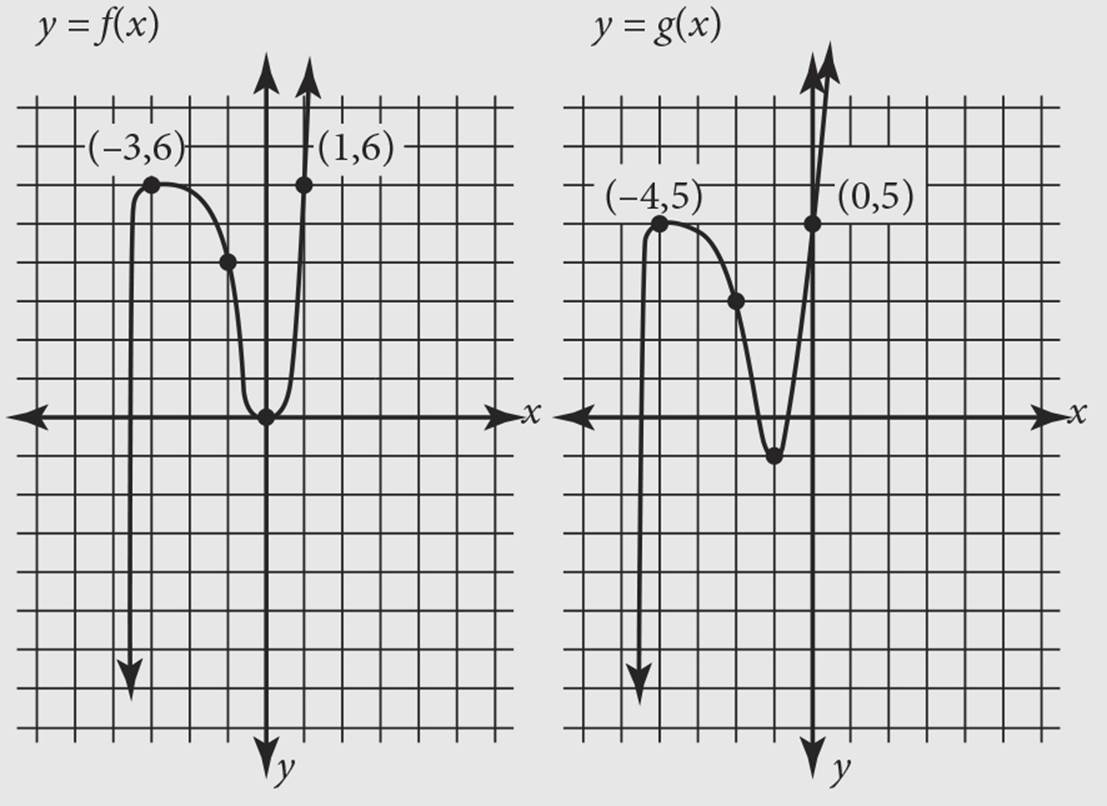
The figures above show the graphs of the functions f and g. The function f is defined by f(x) = 2x3 + 5x2 − x. The function g is defined by g(x) = f(x − h) − k, where h and k are constants. What is the value of hk ?
A.−2
B.−1
C. 0
D. 1
The effect on the graph is that it looks the same as f(x), only it’s 4 units to the left. The h(x) function is outputting the f(x) values from 4 units over.
Some other points on this graph are (−3, 1), (−5, 1), (−2, 4), (−6, 4), and so on.
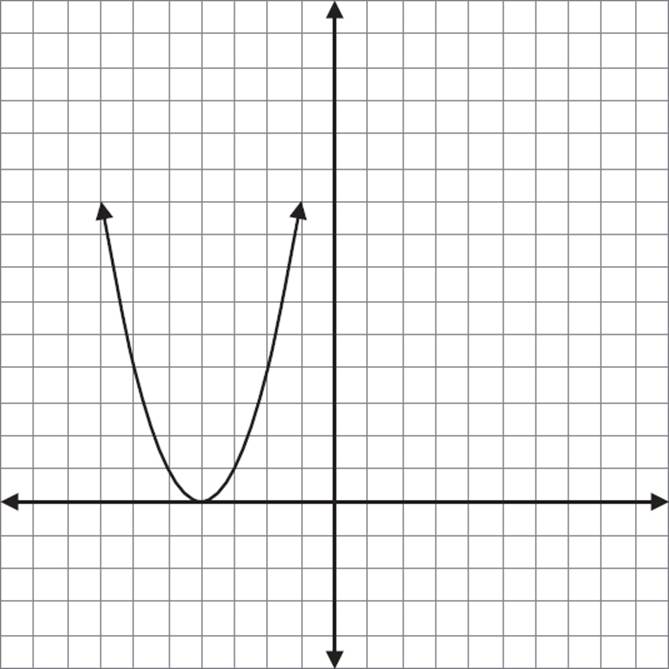
Graph of h(x) = f(x + 4)
Similarly, if we graph a function that equals f(x − 4), we take the graph of f(x) = x and shift it 4 units to the right.
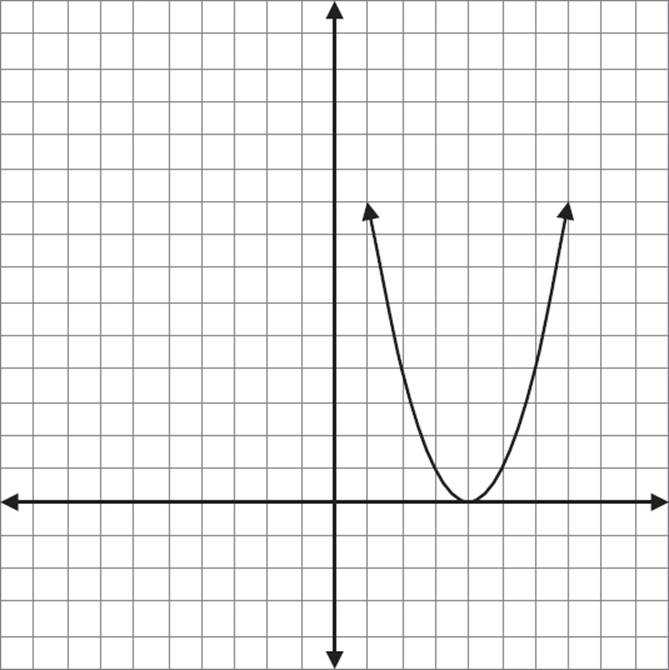
Graph of h(x) = f(x − 4)
Thus, the behavior of graphs follows a set of predictable patterns. To make working with graphs easier, try memorizing the following rules for translations:
Translation Rules for Functions
Compared to the graph of y = f(x),
y = f(x) + C moves the graph C units up
y = f(x) − C moves the graph C units down
y = f(x + C) moves the graph C units left
y = f(x − C) moves the graph C units right

The second graph moves down 1 and to the left 1. Remember that when a graph moves to the left, it is represented by (x + h), which would be the same as x − (−1). So h = −1. Because a negative k represents moving down, k = 1. Therefore, hk = (−1) × (1) = −1, and the correct answer is (B).