Math Workout for the GMAT
Part III Content and Strategy Review
Chapter 10 Integrated Reasoning
MEET THE INTEGRATED REASONING SECTION
The Integrated Reasoning section is 30 minutes long. You’ll see it as the second section of your test. Officially, there are only 12 questions, which sounds pretty great. However, most of those questions have multiple parts. So, for example, a Table Analysis question—one of the new question types we’ll discuss—usually has three statements that you need to evaluate. So, your answer to the question really consists of three separate responses. For the entire section, you’ll actually need to select approximately 28 different responses.
Integrated Reasoning Is Not Adaptive
Unlike the Quantitative and Verbal sections, the Integrated Reasoning section is not adaptive. So, you won’t see harder questions if you keep answering questions correctly. That’s good news because it means that you’ll more easily be able to focus your attention on the current question rather than worrying whether you got the previous question right!
Test writers refer to non-adaptive sections as linear. Pacing for a linear section is different from the pacing that we reviewed for the adaptive Quantitative and Verbal sections.
For Integrated Reasoning, pacing is motivated by two general principles.
Pacing Guidelines
1. Work the easier parts of each question first. As you’ll see, many Integrated Reasoning questions call for more than one response per question. Work the easier parts of each question first.
2. Don’t get stubborn. With so many questions to answer in only 30 minutes, the Integrated Reasoning section can seem very fast paced. Spending too much time on one question means that you may not get to see all of the questions. Sometimes it’s best to guess and move on.
Integrated Reasoning Scores
The Integrated Reasoning section is scored on a scale from 1 to 8 in one point increments. While GMAC has not released too many details about the way in which they calculate the score for this section of the test, there are two key facts to keep in mind.
· Scoring is all or nothing. Most Integrated Reasoning questions include multiple parts. To get credit for the question, you must select the correct response for each part. For example, Table Analysis questions generally include three statements that you must evaluate. If you select the wrong response for even one of these statements, you get no credit for the entire question.
· There are experimental questions. GMAC has stated that the Integrated Reasoning section contains experimental questions that do not count toward your score. They have not, however, stated how many experimental questions there are in the section. It’s likely that two or three of the twelve questions in the section are experimental. If you find a question particularly difficult or time-consuming, it is worthwhile to remember that the question could be experimental.
To score the section, GMAC first calculates a raw score. You get one point for each non-experimental question that you get completely correct. Then, your raw score is converted to the 1 to 8 Integrated Reasoning scaled score.
There’s a Calculator
There’s an onscreen calculator available for the Integrated Reasoning section. The calculator is not available, however, for the Quantitative section. For the Quantitative section, you still need to perform any necessary calculations by hand.
The calculator for the Integrated Reasoning section is relatively basic. There are buttons to perform the four standard operations: addition, subtraction, multiplication, and division. In addition, buttons to take a square root, find a percent, and take a reciprocal round out the available functions. There are also buttons to store and recall a value in the calculator’s memory.
To use the calculator, you’ll need to open it by clicking on the “calculator” button in the upper left corner of your screen. The calculator will generally open in the middle of your screen but you can move it around so that you can see the text of the problem or the numbers on any charts or graphs that are part of the question. The calculator is available for all Integrated Reasoning questions. You can enter a number into the calculator either by clicking on the onscreen number buttons or by typing the number using the keyboard.
Here’s what the calculator looks like:
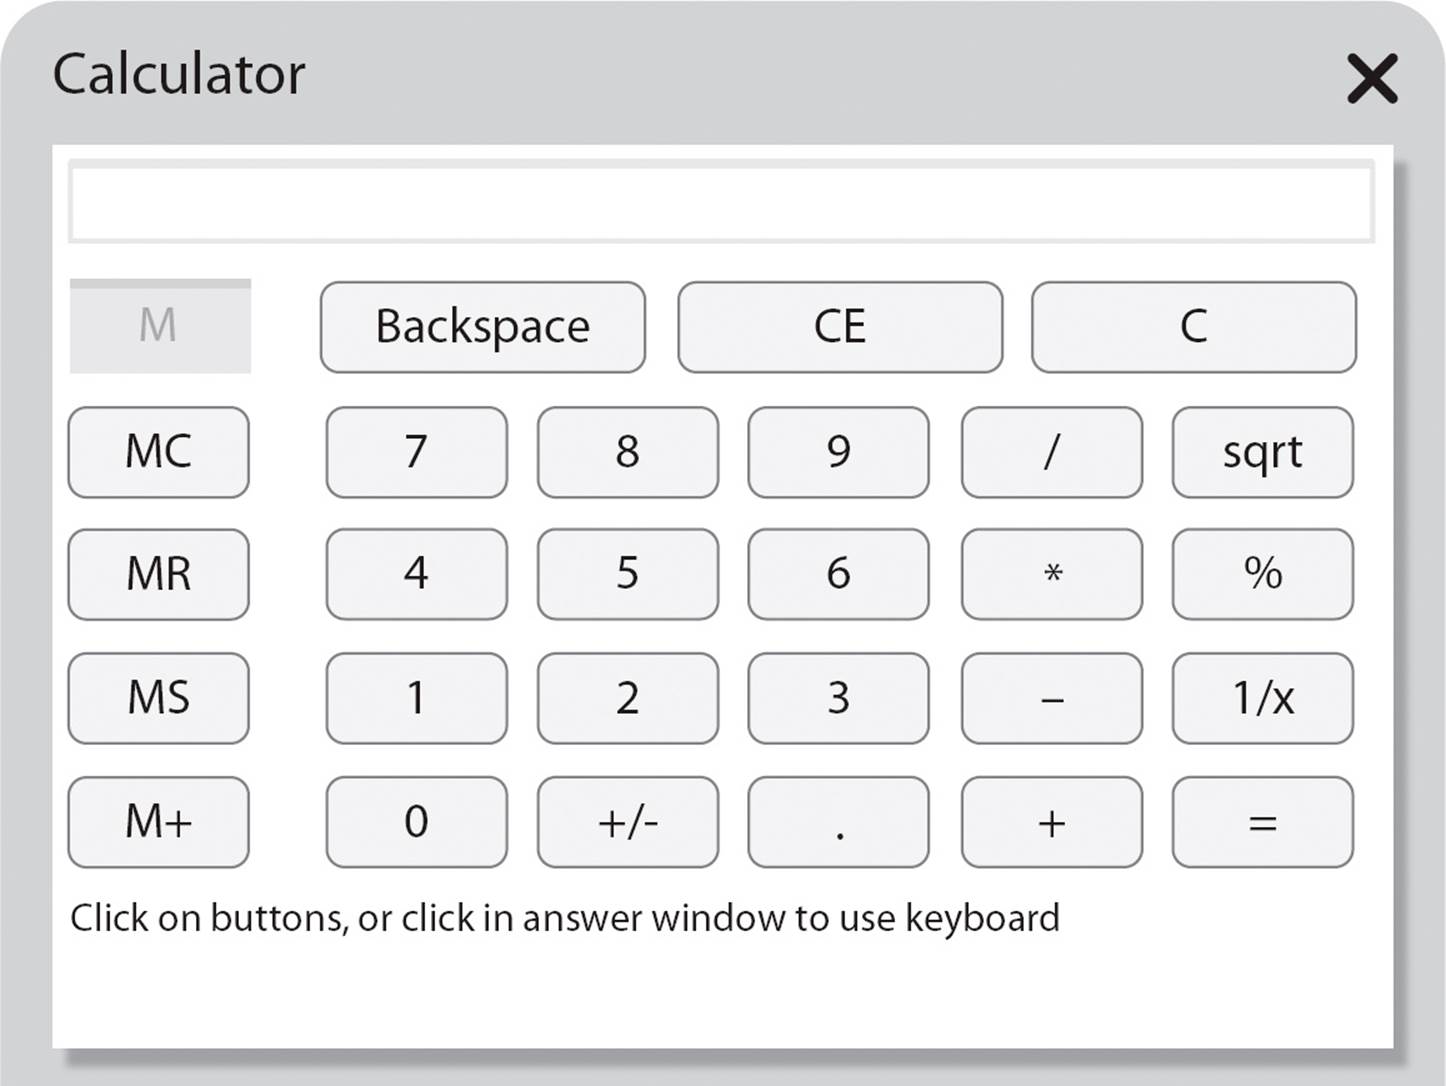
For the most part, the keys on the onscreen calculator work as you might expect. However, a few keys may not work as expected. Oddly enough, that’s particularly true if you are used to using a more sophisticated calculator. So, here are few tips about using some of the calculator keys:

MC is the memory clear key. Use this key to wipe out any values that you have stored in the calculator’s memory.

MR is the memory recall key. Use this key to return any value that you have stored in the memory to the calculation area. For example, if you want to divide the number currently on your screen by the number in the memory, you would enter the key sequence / MR =.

MS is the memory store key. Use this key to store the number currently on the screen in the calculator’s memory.

M+ is the memory addition key. Use this key to add the current onscreen number to the number in the calculator’s memory. For example, if 2 is stored in the calculator’s memory and 3 is on screen, then clicking M+ will result in 5 being stored in the calculator’s memory.

Backspace is used to clear the last digit entered. Use this key to correct mistakes when entering numbers without clearing the entire number. For example, if you entered 23 but meant to enter 25, click backspace then enter 5.

CE is the clear entry button. Use this button to correct a mistake when entering a longer calculation without starting over. For example, suppose you entered 2*3+5 but you meant to enter 2*3+9. If you click on CE right after you enter 5, your screen will show 6, the result of 2*3, and you can now enter +9= to finish your intended calculation.

C is the clear key. Use this key when you want to start a calculation over. In our previous example, if you click C after you enter 5, the intermediate result, 6, is not retained.

sqrt is the square root key. Click this key after you enter the number for which you want to take the square root. For example, if you enter 4 sqrt, the result 2 will display on your screen.

% is the key used to take a percentage without entering a decimal. For example, if you want to take 20% of 400, enter 400*20%. The result 80 will now show on your screen. Note that you do not need to enter = after you click %.
1/x is used to take a reciprocal. Click this key after you enter the number for which you want to take the reciprocal. For example, the keystrokes 2 followed by 1/x produces the result 0.5 on your screen. Again, note that you do not need to enter = after you click 1/x.
Be sure that you thoroughly understand the way the keys for the onscreen calculator work so as to avoid errors and wasted time when you take your GMAT.
Calculator Practice Tip
When you practice for
the Integrated Reasoning
section, use a calculator
similar to the calculator
provided by GMAC. If you
are doing online practice,
use the onscreen calculator.
If you are working
problems from this book,
use a basic calculator
rather than that fancy calculator
that you might still
have from your high school
or college math classes.
THE QUESTION TYPES
There are four question types in the Integrated Reasoning section. While some of these questions test Critical Reasoning skills similar to those tested on the Verbal section, these question types are also used to test the same type of content that is tested in the Quantitative section. So, expect to calculate percents and averages. You’ll also be asked to make a lot of inferences based on the data presented in the various charts, graphs, and tables that accompany the questions. So, the format of these questions may take some getting used to but the content will probably seem familiar.
Let’s take a more detailed look at each of the question types.
Table Analysis
Table Analysis questions present data in a table. If you’ve ever seen a spreadsheet—and really, who hasn’t?—you’ll feel right at home. Most tables have 5 to 10 columns and anywhere from 6 to 25 rows. You’ll be able to sort the data in the table by each column heading. The sort function is fairly basic, however. If you’re used to being able to sort first by a column such as state and then a column such as city to produce an alphabetical list of cities by state, you can’t do that sort of sorting for these questions. You can sort only one column at a time.
Here’s what a Table Analysis question looks like:
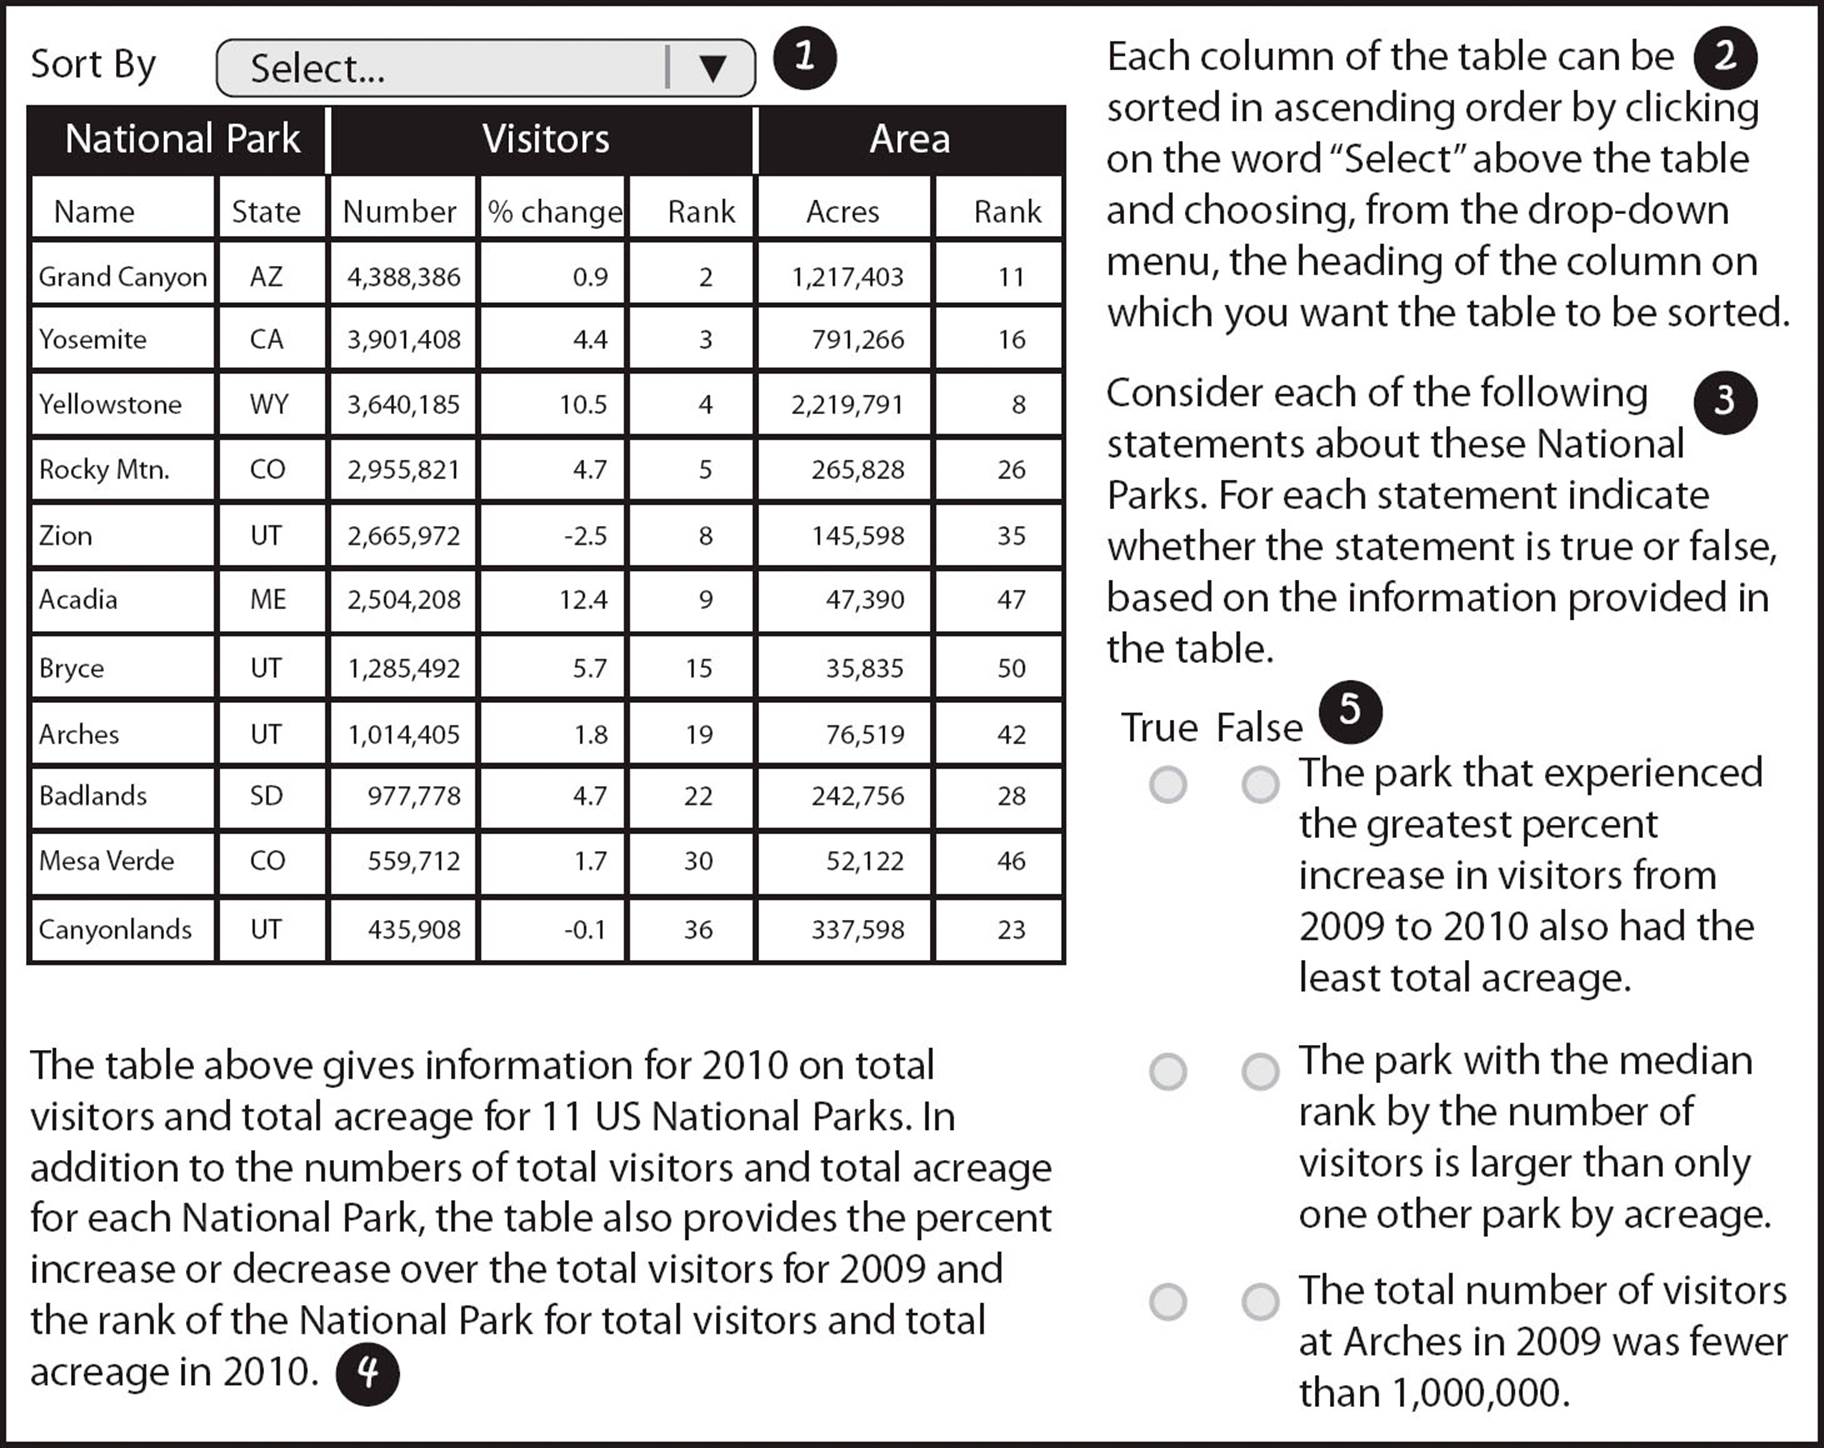
One thing you won’t see on your screen when you take the Integrated Reasoning section are the circled numbers. We’ve added those so we can talk about different parts of a Table Analysis question. Here’s what each circled number represents:

This is the Sort By drop-down box. When opened, you’ll see all the different ways that you can sort the data in the table. In this table, for example, the possibilities are National Park Name, National Park State, Visitors Number, Visitors % change, Visitors Rank, Area Acreage, and Area Rank. You can always sort by every column.

These are the standard directions for a Table Analysis question. These directions are the same for every Table Analysis question. So, once you’ve read these directions once, you don’t really need to bother reading them again.

These lines are additional directions. These additional directions are slightly tailored to the question. However, they’ll always tell you to base your answers on the information in the table. They always tell you which type of evaluation you are to make for each statement: true / false, yes /no, agree / disagree, etc. Again, you can probably get by without reading these most of the time.

These lines explain the table. Mostly, this information will recap the column headings from the table. Occasionally, you can learn some additional information by reading this explanatory text. For example, the explanatory text for this table states that the Visitors Number column is for 2010 and that % change column shows the change from 2009 to 2010.

These statements are the questions. Typically, there are four statements and you need to evaluate and select an answer for each. The good news is that you can answer these in any order. However, if you try to move to the next question without selecting a response for one or more statements, a pop up window opens to inform you that you have not selected an answer for all statements. You cannot leave any part of the question blank.
If you’ve read through the statements, you may have noticed that the questions asked you to do things such as calculate a percentage or find a median. That’s typical for Table Analysis questions. You’ve probably also realized just how helpful the sorting function can be in answering some questions.
Read What You Need When You Need It
You may not need to read
the explanatory information
about the table
(number 4) to evaluate the
statements. You should
study the column headings
first. If you understand
those, go straight to the
statements. You can always
go back and read the
explanatory information if
you need to.
Graphics Interpretation
Graphics Interpretation questions give you one chart, graph, or image and ask you to answer two questions based on that information. The questions are statements that include one drop-down box. You select your answer from the drop-down box to complete the statement.
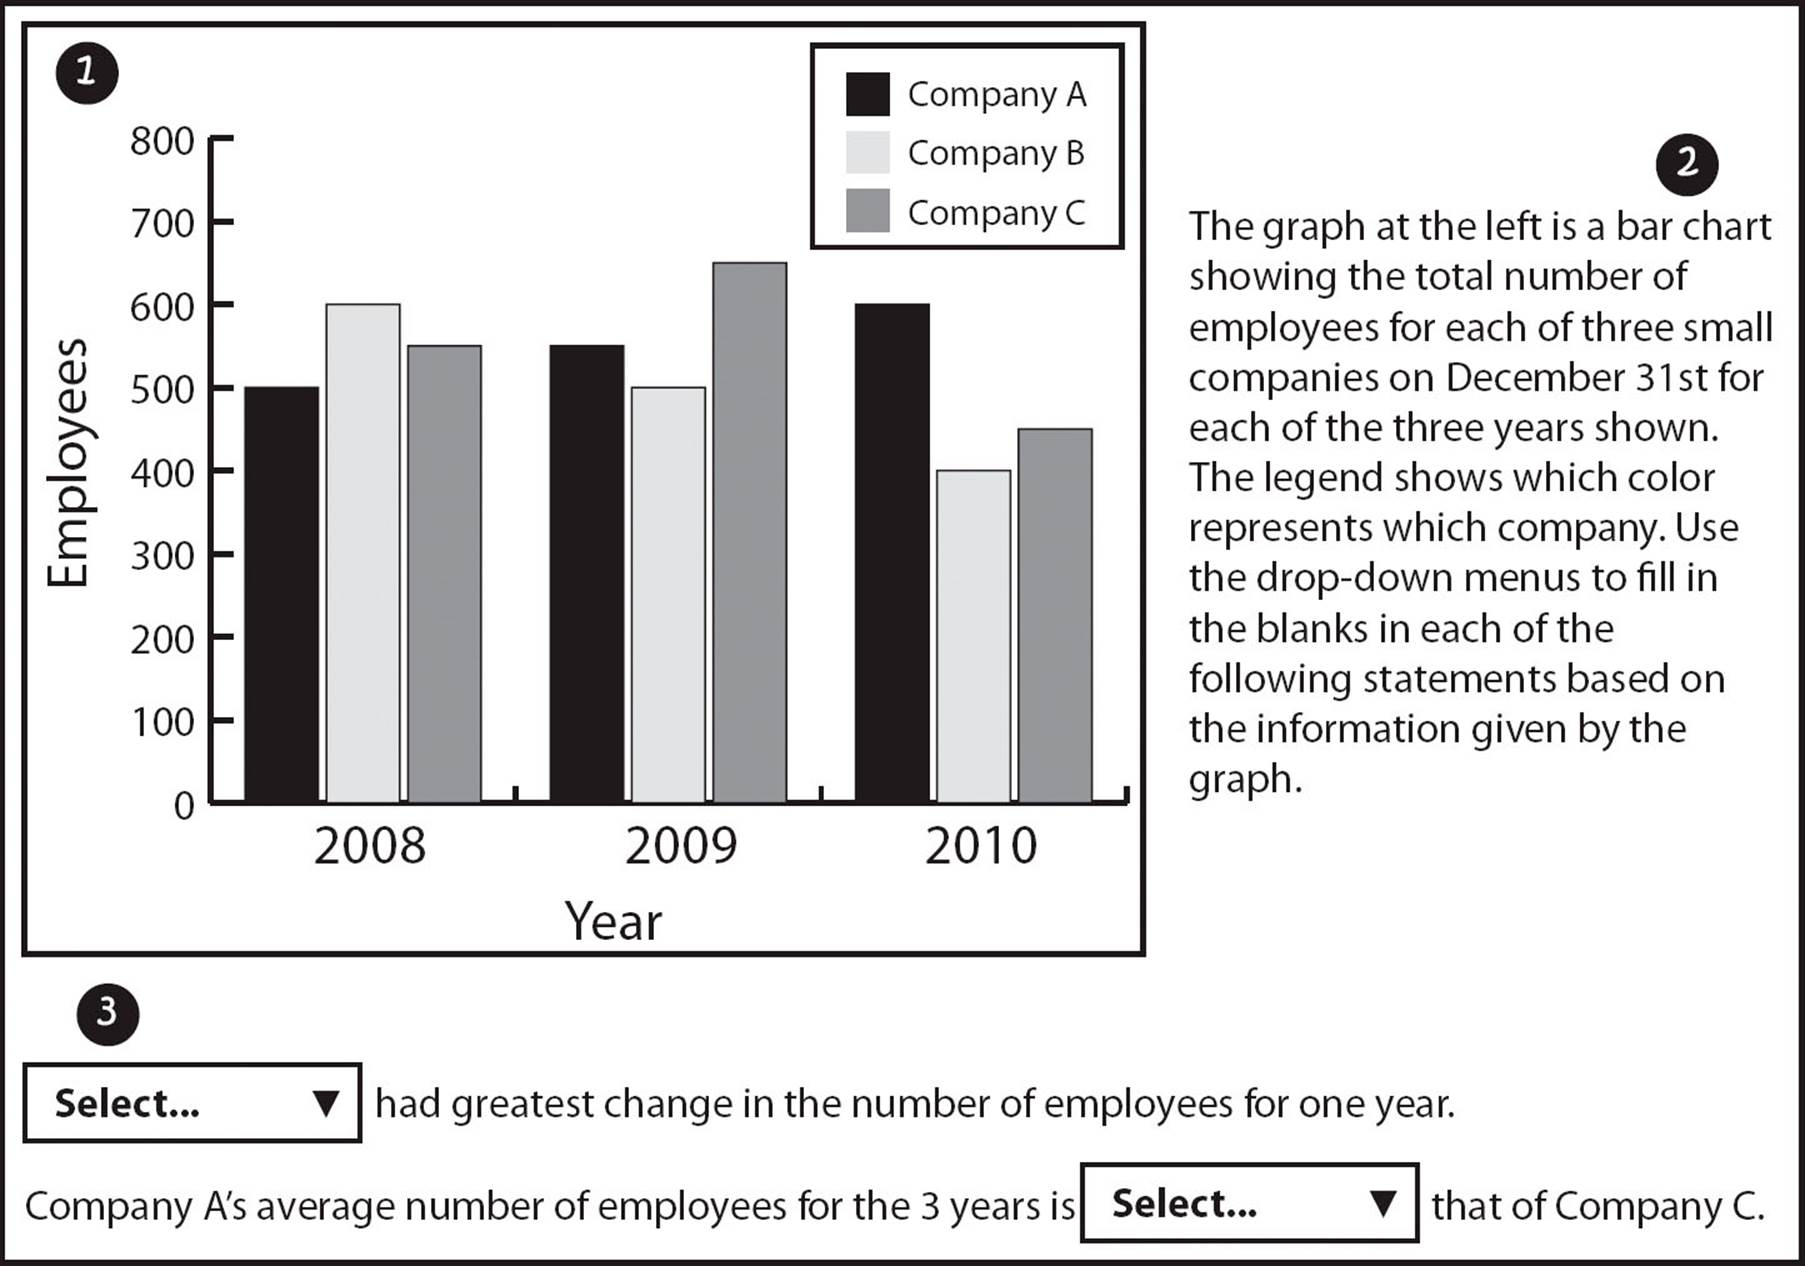
Here’s an example of a Graphics Interpretation question:
As with the Table Analysis questions, we’ve added the circled numbers so we can point out the different things that you’ll see on your screen for a Graphics Interpretation question. Here’s what each circled number represents:
The chart, graph, or image is always in the upper left of the screen. As shown here, the chart will take up a good deal of the screen. It will certainly be large enough that you can clearly extract information from it. You can expect to see a variety of different types of charts or graphs including scatter plots, bar charts, line graphs, and circle (or pie) charts. For the most part, you’ll see fairly standard types of graphs, however. Be sure to check out any labels on the axes as well as any sort of included legend.
These lines provide an explanation of the graph or chart. Mostly, you’ll be told what the chart represents as well as what the individual lines, bars, or sectors may represent. Sometimes, you’ll be given some additional information such as when measurements were made. For example, here you are told that the bars show the numbers of employees for each firm on December 31st of the year in question. This information is typically extraneous to answering the questions. The explanatory information always ends with the same line about selecting your answers from the drop-down menu.
These are the questions. Graphics Interpretation questions typically include two statements. You don’t have to answer them in order, but you must answer them both to move on to the next question. Each statement is typically a single sentence with one drop-down menu. Each drop-down menu typically includes three to five answer choices. Choose that answer choice that makes the statement true.
Graphics Analysis questions mostly ask you to find relationships and trends for the data. You can also be asked to calculate percentage increases or decreases, averages, and medians.
Two-Part Analysis
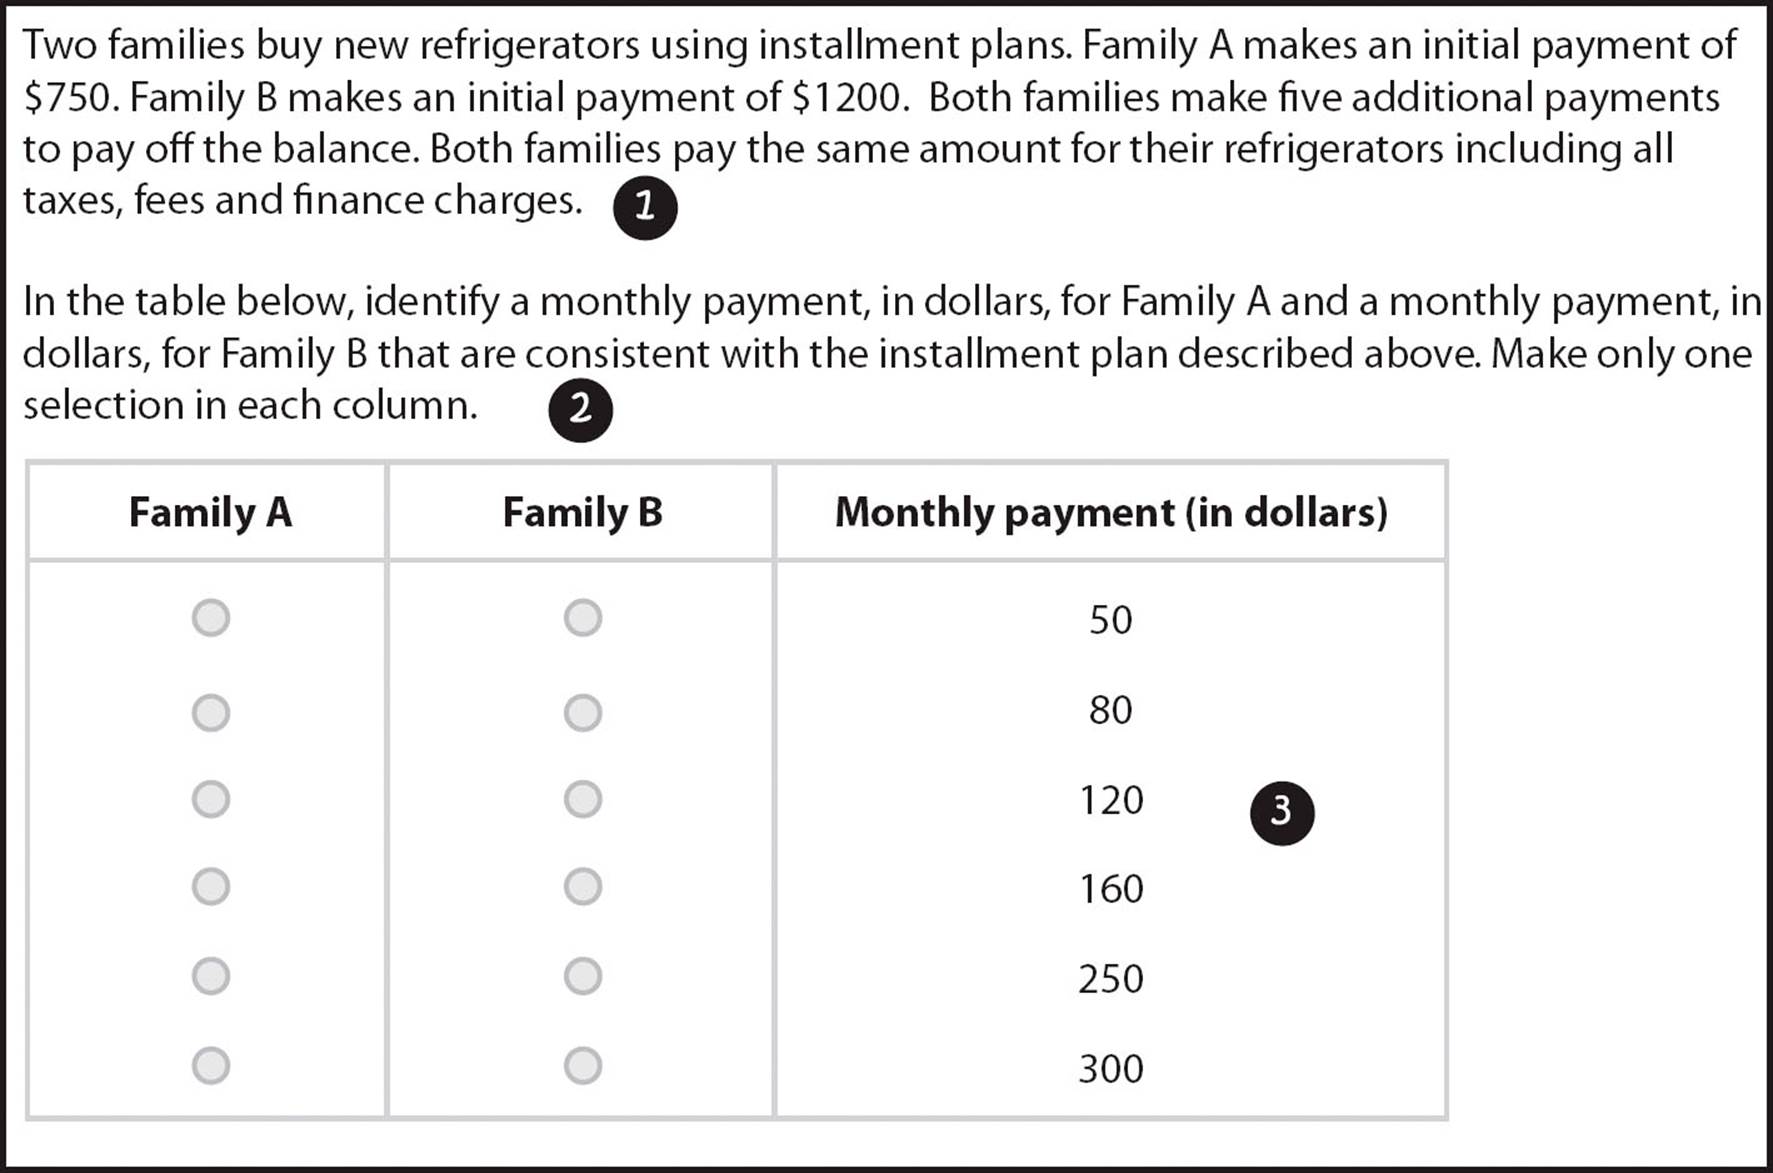
Next up is the Two-Part Analysis question. In many ways, the Two-Part Analysis question is most similar to a standard math question. You’ll typically be presented with a word problem that essentially has two variables in it. You’ll need to pick an answer for each variable that makes some condition in the problem true.
Here’s an example of a Two-Part Analysis question:
As you might have surmised, we have once again added the circled numbers so we can described the different parts of the question. Here’s what each circled number represents:
This first block of text is the actual problem. Here, you’ll find the description of the two variables in the problem. You’ll also find the condition that needs to be made true. As with any word problem, make sure that you read the information carefully. For these problems, you’ll also want to make sure that you are clear about which information goes with the first variable and which information goes with the second.
This part of the problem tells you how to pick your answers. Mostly this part tells you to pick a value for column A and a value for column B based on the conditions of the problem. This part is mostly boilerplate text that varies slightly from problem to problem.
These are the answer choices. Two-Part Analysis questions generally have five or six answer choices. You choose only one answer choice for each column. It is possible that the same number is the answer for both columns. So, if that’s what your calculations indicate, go ahead and choose the same number for both columns.
Most Two-Part Analysis questions can be solved using math that is no more sophisticated than simple arithmetic. There is one exception to that, however. While most Two-Part Analysis questions are math problems, you may see one that looks like a Critical Reasoning question. For these, you’ll be give an argument and you’ll need to do something like pick one answer that strengthens and one answer that weakens the argument.
Multi-Source Reasoning
Finally, we come to the Multi-Source Reasoning question. Multi-Source Reasoning questions present information on tabs. The information can be text, charts, graphs, or a combination. In other words, GMAC can put almost anything on the tabs! The layout looks a little bit like Reading Comprehension because the tabbed information is on the left side of your screen while the right side shows the questions.
Here’s an example of a Multi-Source Reasoning question:

Again, we’ve added circled numbers to indicate the different parts of the question. Here’s what each circled number represents:
The tabs appear across the top left of the screen. Some questions have two tabs and some, as in this example, have three. The tabs typically give you some sort of indication about what’s on the tab. The currently selected tab is white while the unselected tabs are grey. GMAC can put almost anything on each tab including graphs, tables, charts, text, or some combination. It’s a good idea to take a few seconds and get your bearings before attempting the questions. Make sure you know what is on each tab and how the information on one tab relates to information on the other tab or tabs.
The information for each tab appears on the left of the screen. In this case, the information is a graph. When you see a chart or graph, be sure to check out the axes. You’ll also want to look for a legend or other information to help explain the information shown by the graph or chart. For tables, check out the column headings so as to better understand the table. Finally, don’t neglect to read any supplied headings for the chart, graph, or table. Sometimes, that’s all you need for the chart to make sense.
These are the basic instructions for how to respond to the statements. These instructions help to explain how you need to evaluate each statement. Here, for example, you need to determine whether the statements are valid inferences. In other cases, you may be asked to evaluate the statements for a different choice such as true or false.
These are the actual questions. You need to pick a response for each statement. If you fail to respond to one or more statements, you won’t be able to advance to the next question in the section. In other words, these statements work just like the statements for the Table Analysis question type.
Multi-Source Reasoning questions usually come in sets. Each set typically consists of three separate questions. Two of those questions are typically in the statement style as shown in the example above. It’s also possible to get a standard multiple choice question as part of the set. For a standard multiple-choice question, there are five answer choices and you select one response.
You may need information from more than one tab to respond to a statement or multiple choice question. Don’t forget to think about the information on the other tabs while evaluating the statements. That’s why it’s important to take a few moments and get familiar with what’s on each tab before starting work on the questions.