Pre-Algebra Out Loud: Learning Mathematics Through Reading and Writing Activities (2013)
Chapter 7. Visualizing Algebra by Graphing Lines
WHAT? Introduction
A good way to help your students visualize algebra is to introduce the basics of graphing linear equations and allow them to create graphs and build equations from these graphs. The Common Core State Standards suggest that by eighth grade, students should be able to sketch graphs from functions that have been described verbally.
This chapter begins with an introduction to the rectangular coordinate system, also called the Cartesian coordinate system (named for the ancient mathematician-philosopher Descartes,) or more simply called the xy-plane. It then explores certain aspects of the plane and finishes by graphing the linear equations explored in this chapter.
WHY? Objectives
Using the activities in this chapter, pre-algebra students:
· Consider and briefly express what is the most unclear concepts from a lesson
· Visualize and comprehend the significant parts of an algebraic graph: points, ordered pairs, intercepts, slope, and so forth
· Fill in a K-W-L chart that asks readers what they already know, what they want to know, and what they learned regarding a lesson or mathematical concept
· Complete a semantic feature analysis showing different ways of expressing graphing features and terms
· Complete an anticipation guide to explore and compare their and the text's knowledge of linear equations and graphs
Mini-Lesson 7.1 The xy-Plane and Lines
CCSS Standard 8.EE: Equations and Expressions
Understand the connections between proportional relationships, lines, and linear equations.
Before students begin creating graphs, they need to learn a few new algebraic concepts. First, consider a linear equation in two variables; for example, ![]() . The single-variable equations that we studied earlier had one variable and usually one solution; these new equations will have many solutions. These solutions take the form of ordered pairs: generally (x,y) or specifically, for example, (2,4). Each linear equation in two variables has an infinite set of ordered pairs or solutions. All of the ordered pairs, which indicate points on a graph, lie on a straight line. Here are a few ordered pairs that are solutions to the example:
. The single-variable equations that we studied earlier had one variable and usually one solution; these new equations will have many solutions. These solutions take the form of ordered pairs: generally (x,y) or specifically, for example, (2,4). Each linear equation in two variables has an infinite set of ordered pairs or solutions. All of the ordered pairs, which indicate points on a graph, lie on a straight line. Here are a few ordered pairs that are solutions to the example: ![]() are (0,2), (1,3), and (
are (0,2), (1,3), and (![]() ).
).
We'll start with the linear equation: a linear equation in two variables (x and y) can be written in the form ![]() where A, B, and C are real numbers. But A and B cannot both equal 0.
where A, B, and C are real numbers. But A and B cannot both equal 0.
Students will learn more about different forms of linear equations in future algebra courses. For now, we'll stick to the basics.
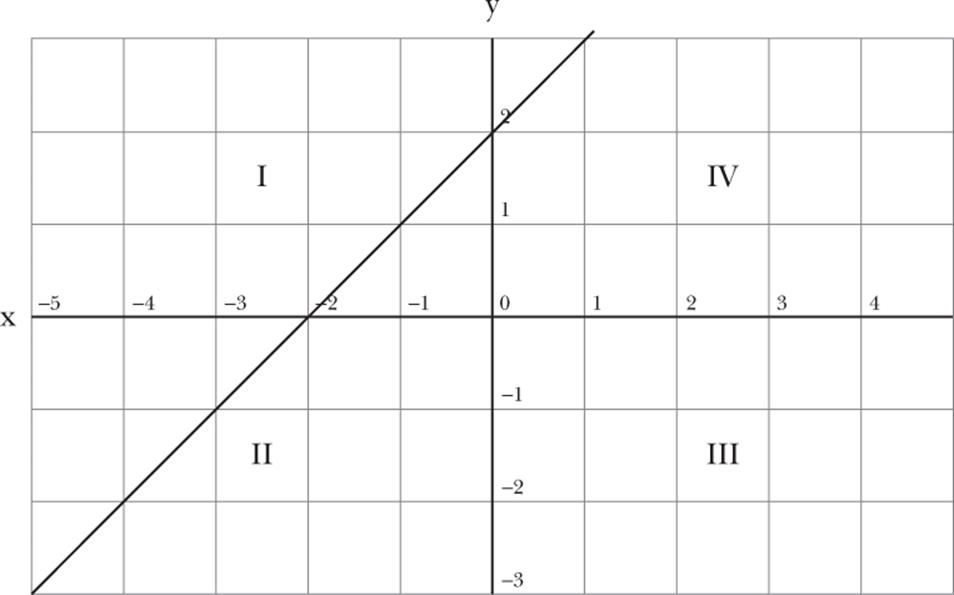
The next concept is the plane that will contain the graphs. Notice that the figure has four quadrants, I to IV, and that they are numbered in a counterclockwise order. The vertical bold line is the y-axis, and the horizontal bold line is the x-axis. The x-axis meets the y-axis at one point (0,0) called the origin.
Ordered pairs are points where the horizontal (![]() ) and vertical (
) and vertical (![]() ) grid lines intersect. The left value of the point (x,y) represents the x coordinate and the right value the y coordinate. For example, to plot the point (
) grid lines intersect. The left value of the point (x,y) represents the x coordinate and the right value the y coordinate. For example, to plot the point (![]() ), move 3 units from the origin along the x-axis to the negative, and from there move 2 units up to the positive.
), move 3 units from the origin along the x-axis to the negative, and from there move 2 units up to the positive.
The following shows the graph of a line with corresponding equation ![]() :
:
We know from geometry that it takes only two points and a straight edge or ruler to determine a line. The point (![]() ) sits on the x-axis and is called an x-intercept. The point (0,2) sits on the y-axis and is called an intercept. (
) sits on the x-axis and is called an x-intercept. The point (0,2) sits on the y-axis and is called an intercept. (![]() ) and (0,2) are solutions to the linear equation
) and (0,2) are solutions to the linear equation ![]() . Once we found these two points, we took a ruler and joined or sketched the line between the two intercepts and beyond them. Hence, we created the graph for the linear equation
. Once we found these two points, we took a ruler and joined or sketched the line between the two intercepts and beyond them. Hence, we created the graph for the linear equation ![]() . Every point along this line is an ordered pair solution to the equation
. Every point along this line is an ordered pair solution to the equation ![]() .
.
![]() Teaching Tip
Teaching Tip
Because it takes only two points to determine a line, students only need to find the x and y intercepts and join the two points to graph any linear equation. However, ![]() is the identity equation, and its x and y intercepts are the same point (0,0). In this case, any other point on the line
is the identity equation, and its x and y intercepts are the same point (0,0). In this case, any other point on the line ![]() will do for the second point, such as (2,2). Remember that it takes two points to make a line!
will do for the second point, such as (2,2). Remember that it takes two points to make a line!
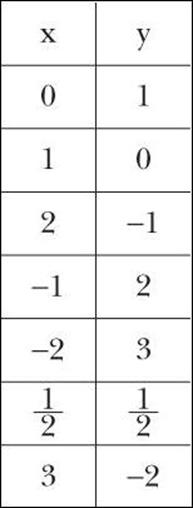
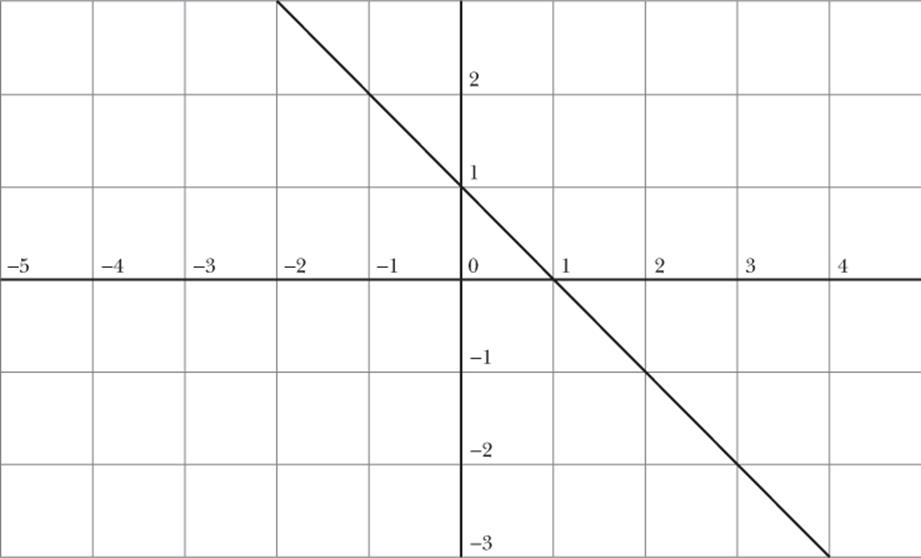
The linear equation represented by this line is y = 1 − x, with two intercepts: (0,1) and (1,0).
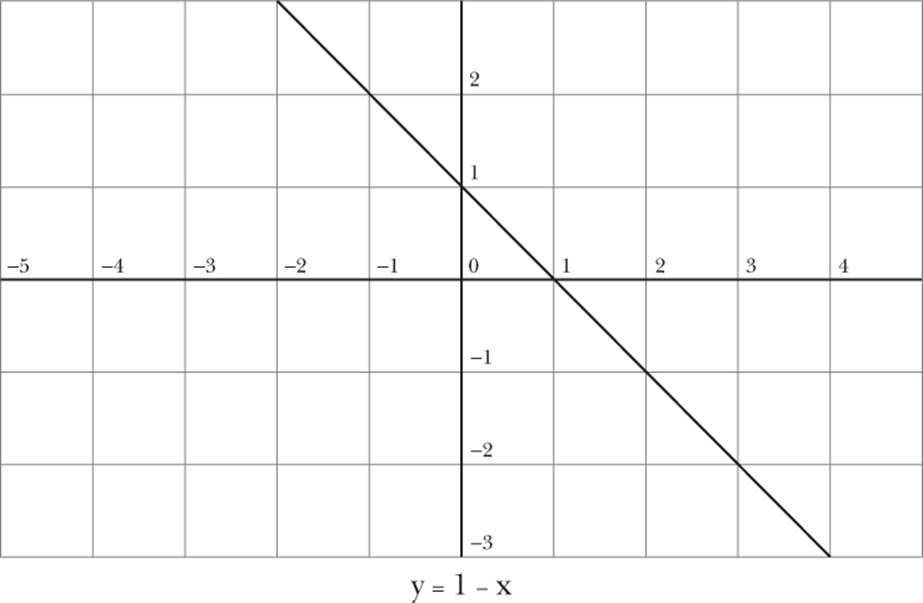
The following table lists several of the points on this line. It should be clear that the table would go on forever if we were to attempt to list all points on this line.
Activity 7.1: Muddiest Point
WHAT? Description
The muddiest point (Angelo & Cross, 1993) activity allows teachers to assess student comprehension of the content addressed in a classroom discussion or lesson. Students are given an index card or worksheet 7.1 at the end of the day's lesson and asked to jot down the topic they found most confusing. Also have them write out the topic they found easiest or simplest to grasp. Students hand in their cards as they leave the classroom. Often the cards will reveal one or two topics that several students found unclear and also where they understood the content. This point or points of confusion may be addressed in the next lesson or, if time permits, a review of these topics may become the next lesson.
WHY? Objectives
During this activity, pre-algebra students:
· Choose and write out the most unclear topic for them from the day's lesson
· Identify parts of the lesson they understood
HOW? Examples
Here is an example of a student's response to the muddiest and clearest parts of a lesson on linear equations in two variables and their graphs:
For me the muddiest topics in this unit are:
· x and y intercepts
· slopes
· constructing lines
· slope intercept form
For me the easiest topics in this unit are:
· plotting points
· parallel and perpendicular lines
· writing equations in slope intercept form
Worksheet 7.1: Muddiest Point
The muddiest point presented in class today is:
The easiest thing presented in class today was:
Activity 7.2: Reading and Understanding Graphs
WHAT? Description
The National Council of Teachers of Mathematics (2010) holds that it is vital for students to be able to interpret as well as create graphical representations of mathematical relations. Today computers and graphing calculators allow students to visualize and manipulate graphs of quantitative relationships. The latest technological tools include interactive graphs with sliders and other gauges that allow users to change variable values, which in turn change the graph. These tools allow students to see how the changes in the independent variable affect the dependent variable and the shape of the graph.
The prerequisites for interpreting graphs include understanding the basics of graphing and two-variable equations. Students who are introduced to graphing early seem to grasp better the notion of function. Notice how your students seem to like and often use the vertical line test to tell if a graph represents a function. Every time a student says, “It passes the vertical line test,” offer the opportunity to reinforce what that statement means (each x has exactly one y).
Once students have an understanding of variables, ordered pairs, intercepts, and axes, they are ready to examine and interpret graphical models. To interpret a graph, students should first read any headings or captions around the graph. Then they should refer to the graphical model and ask and answer as many of the following questions that are applicable to this particular graph. Using complete sentences will help students to clarify and complete their thoughts:
· What does the independent variable (x) represent in real-world terms?
· What does the dependent variable (y) represent?
· What does it mean when the y ![]() ?
?
· What does it mean when the x ![]() ?
?
· If ![]() a value], what is y? What does this point represent?
a value], what is y? What does this point represent?
· If the graph is linear, what does the slope of the line represent?
WHY? Objectives
During this activity, pre-algebra students:
· Learn about the xy-plane and graphs
· Write about the graphic model and what are its attributes
· Explore higher-level graphs
HOW? Example
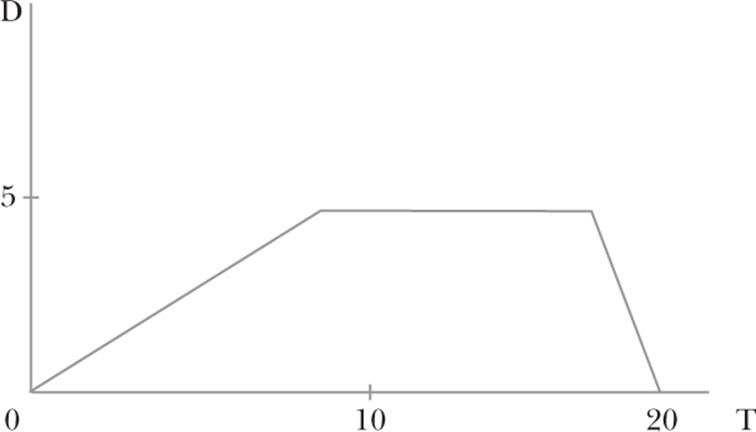
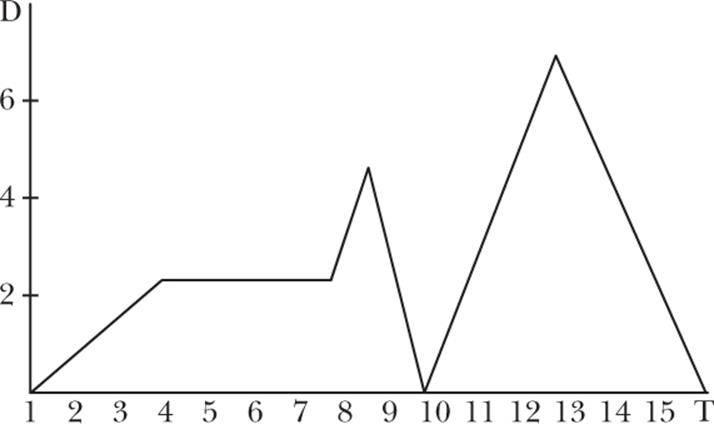
This graph represents the distance D (the number of blocks) that Brandylee walks from her home and back. The T-axis represents the time in minutes that passes as she walks.
If the highest point of the graph is ![]() , then it takes 10 minutes for Brandylee to walk 5 blocks from home. Her speed is
, then it takes 10 minutes for Brandylee to walk 5 blocks from home. Her speed is ![]() , which means she walked at a rate of 1 block per 2 minutes or 1.5 blocks per minute.
, which means she walked at a rate of 1 block per 2 minutes or 1.5 blocks per minute.
From 10 to 20 minutes, she does not walk, so she must have rested for 10 minutes. Then it looks as if she jogged home quickly, taking about 2 minutes. She ran the 5 blocks home in 2 minutes, so her speed was 2.5 blocks per minute.
The entire journey from home and back happened in 22 minutes.
Worksheet 7.2: Reading and Understanding Graphs
Name _____ Date _____
Directions: Consider the following graph of Gabriel walking in his neighborhood. Let ![]() in blocks from home and T represent the time in minutes.
in blocks from home and T represent the time in minutes.
On another sheet of paper, answer the following questions using clear, complete sentences:
· In your own words, write out what the D variable represents.
· In your own words, write out what the T variable represents.
· When ![]() , what does D equal? Write out what this means in terms of time and distance.
, what does D equal? Write out what this means in terms of time and distance.
· When ![]() minutes, how far is Gabriel from home?
minutes, how far is Gabriel from home?
· What are the basic shapes of the graph?
· Is distance a function of time in this graph?
· The graph changes at what points? How do these points represent Gabriel's walk?
· What is Gabriel doing at ![]() through
through ![]() seconds?
seconds?
· There are three points where ![]() . What does each point represent in terms of Gabriel's distance from home and time passed during his walk?
. What does each point represent in terms of Gabriel's distance from home and time passed during his walk?
· Can you determine the speed of Gabriel's walk at ![]() , and
, and ![]() in blocks per minute?
in blocks per minute?
In a paragraph describe Gabriel's walk as depicted by this graph. Feel free to be creative and embellish the story if you wish.
Activity 7.3: K-W-L
WHAT? Description
K-W-L (Ogle, 1986) is a reading strategy that uses note taking prior to, during, and after reading:
K stands for “What I Know”
W stands for “What I Want to Know”
L stands for “What I Learned”
Students write notes in a three-column grid using the following format:
|
K—What I Know |
W—What I Want to Know |
L—What I Learned |
|
During prereading, write notes about what you already know regarding the concepts presented. |
During prereading, write questions about what you want to know regarding the concepts presented. |
As you read or after reading, write answers to questions posed in column 2 or notes regarding what you have learned. |
WHY? Objectives
During this activity, pre-algebra students:
· Reflect on prior and new knowledge
· Merge prior knowledge with new knowledge
· Summarize prior and new knowledge
· Authentically assess [self-assess] their own learning process
HOW? Example
The concept is graphing a line. A student might fill in the table as shown below:
|
K—What I Know |
W—What I Want to Know |
L—What I Learned |
|
A graph of a line has many points on it. |
Where do you get the points from? |
The points are ordered pairs like (x,y) that make the equation work! |
Worksheet 7.3: K-W-L
Name _____ Date _____
Directions: The K-W-L reading strategy follows this format:
|
K—What I Know |
W—What I Want to Know |
L—What I Learned |
|
During prereading, write notes about what you already know regarding the concepts presented. |
During prereading, write questions about what you want to know regarding the concepts presented. |
As you read or after reading, write answers to questions posed in column 2 or notes regarding what you have learned. |
Use the reading titled _____ on page _____ to complete this table:
|
K—What I Know |
W—What I Want to Know |
L—What I Learned |
Worksheet 7.4: K-W-L for the Slope of a Line
Name _____ Date _____
Directions: The K-W-L reading strategy follows this format:
|
K—What I Know |
W—What I Want to Know |
L—What I Learned |
|
During prereading, write notes about what you already know regarding the concepts presented. |
During prereading, write questions about what you want to know regarding the concepts presented. |
As you read or after reading, write answers to questions posed in column 2 or notes regarding what you have learned. |
Use the reading titled _____ on page _____ to complete this table:
|
K—What I Know |
W—What I Want to Know |
L—What I Learned |
Mini-Lesson 7.2 The Slope of a Line
CCSS Standard 8.EE: Expressions and Equations
Understand the connections between proportional relationships, lines, and linear equations.
Every linear equation with two variables has a slope, that is, the measure of the slant or steepness of the line. By convention, the variable m usually is used to refer to the slope, a numerical measure of the slant of a line. If a graph descends from left to right, like the one below, it will have a negative slope. Graphs that descend from left to right will have a positive slope. The slope is also the comparison of the difference in Y's to the difference in X's.
Slope Formulas
![]()
![]() Teaching Tip
Teaching Tip
Lines that descend from left to right have negative slopes, and ones that ascend from left to right have positive slopes.
The x intercept of the line in the preceding graph is the point (1,0). The y intercept is the point (0,1). The slope of the line can be found using the slope formula and is −1.
![]()
![]() Teaching Tip
Teaching Tip
Refrain from using the expression “no slope.” Some texts consider a line with no slope to be a horizontal line. Other texts use the phrase to mean the slope does not exist, as in the case of any vertical line. To avoid confusion, tell your students not to use it at all.
Consider another form of the linear equation, the slope intercept form. The slope intercept form of a linear equation is ![]() , where m is the slope and b is the y intercept. When these ideas are put together, the equation for the line in the preceding graph is
, where m is the slope and b is the y intercept. When these ideas are put together, the equation for the line in the preceding graph is ![]() . Since the slope
. Since the slope ![]() and
and ![]() , the y intercept is the point (0,1).
, the y intercept is the point (0,1).
Slope Facts
· A horizontal line always has a slope of ![]() .
.
· A vertical line has an undefined slope.
· A steep line has a slope much greater than 1.
· A line that goes through the origin and bisects the xy plane has a slope of 1.
· All parallel lines have the same slope.
Example: Find the slope and y intercept for the line with equation ![]() .
.
First, rewrite the equation into slope intercept form:
![]()
![]()
![]()
Dividing both sides by −1 gives
![]()
The equation is now in slope intercept form. It can easily be seen that the slope is −2 and the y intercept ![]() .
.
Activity 7.4: Semantic Feature Analysis
WHAT? Description
Semantic feature analysis (Baldwin, Ford, & Readance, 1981) is a reading strategy that asks students to complete a matrix showing how various terms and concepts are alike or different. The matrix itself consists of several columns. The first lists the terms, and the other columns contain headings spelling out features that the terms or concepts might have in common.
WHY? Objectives
During this activity, pre-algebra students:
· Explore features of certain mathematical concepts
· Compare and contrast features of related mathematical concepts
· Summarize this information
· Refer back to the completed matrix when reviewing for exams
HOW? Example
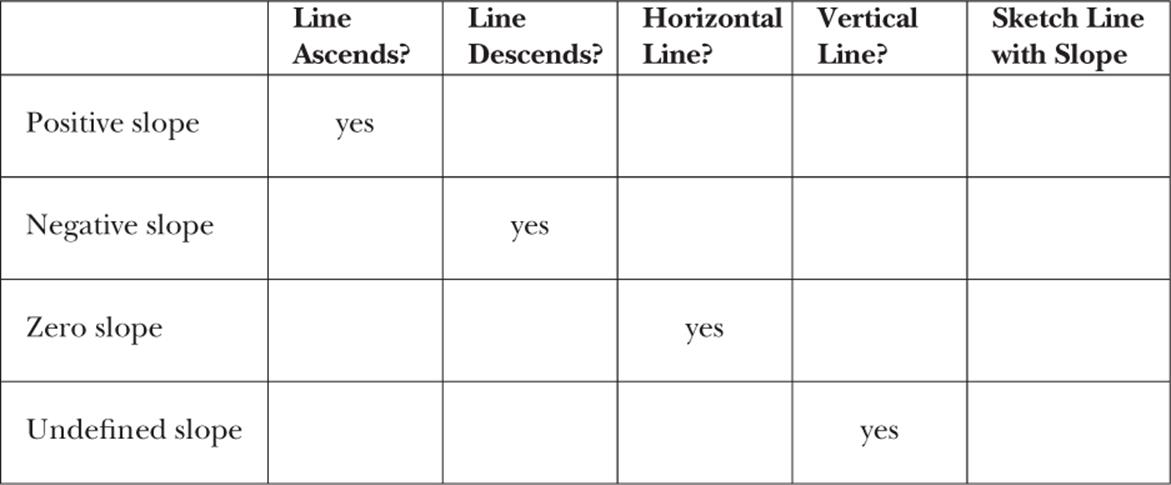
In this table on semantic feature analysis for slope, students were asked to fill in the table by writing yes or no to the questions along the top of the table for the types of slope given in column 1. Then for column 6, they sketched the line and its correct slant. The “yes” answers are given.
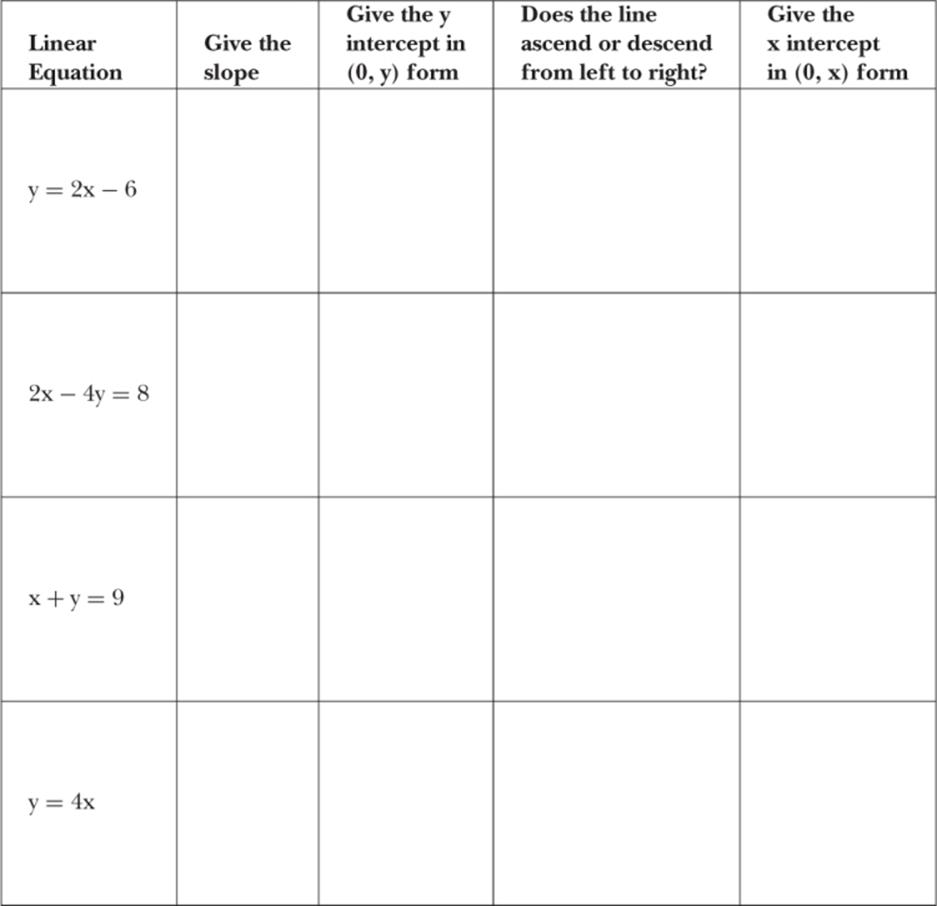
Worksheet 7.5: Semantic Feature Analysis: Linear Equations
Name _____ Date _____
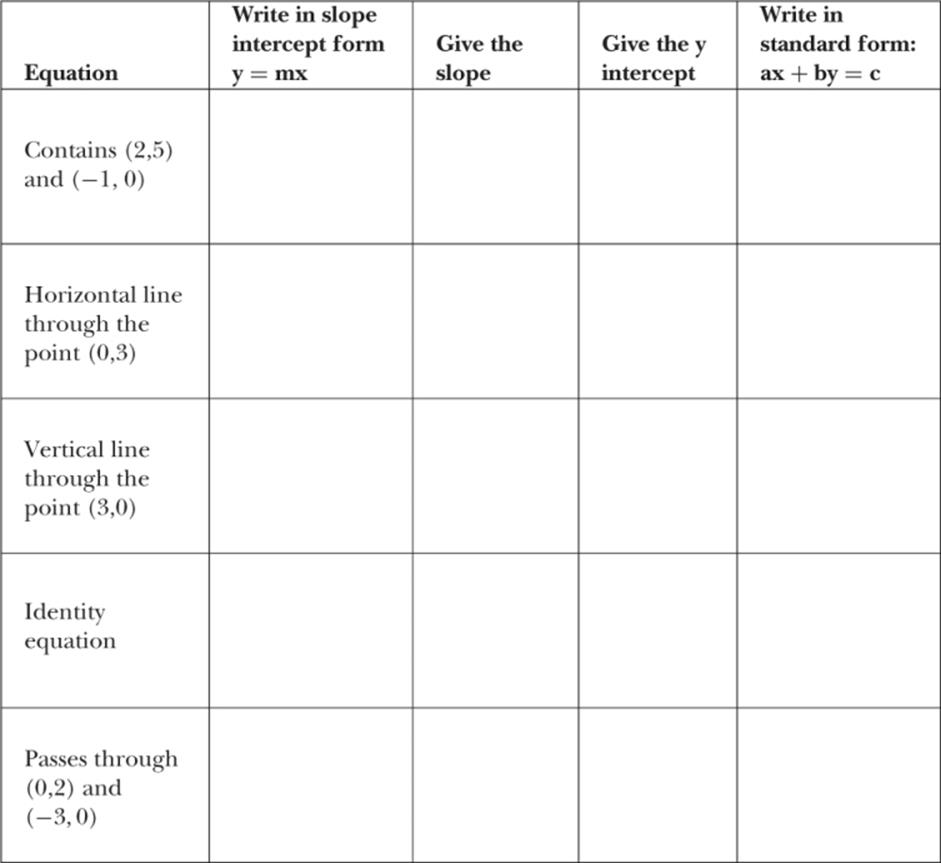
Directions: Beginning with each equation in the first column, answer each question across the top. If no solution exists, write “DNE” (for “does not exist”).
Worksheet 7.6: Semantic Feature Analysis: Slope
Name _____ Date _____
Directions: Beginning with each equation in the first column, answer each question across the top. If no solution exists, write “DNE” (for “does not exist”).
Activity 7.5: Anticipation Guide
WHAT? Description
Anticipation guides (Herber, 1978) are lists of statements that challenge students to explore their knowledge of concepts prior to reading the text.
A mathematical anticipation guide usually contains four to five statements, each with two parts. First, students are asked to agree or disagree with each statement. Then they are asked to read the text and determine whether the text or author agrees with each statement.
WHY? Objectives
During this activity, pre-algebra students:
· Complete anticipation charts
· Explore their opinions and prior knowledge of mathematical concepts
· Read closely to find evidence to support their claims or discover the text's view
· Uncover and identify any misconceptions regarding these concepts
HOW? Example
This example is an anticipation guide for a lesson on slope. Students were directed to put a check mark in the Me column next to any statement with which they agreed and a check mark next to any statement with which the text agreed:
|
Me |
Text |
|
|
|
1. A slope is the measure of the slant or tilt of a line. |
|
|
2. A horizontal line has an undefined slope. |
||
|
|
|
3. If a line falls from left to right, it will have a negative slope. |
|
4. Perpendicular lines never touch or cross each other. |
||
|
|
|
5. The slope-intercept form for linear equations is |
Worksheet 7.7: Anticipation Guide: Planes, Lines, and Point
Name _____ Date _____
Directions: Consider the lesson on linear equations and slope Then in the column labeled Me, place a check next to any statement with which you agree. After reading the section, consider the column labeled Text, and place a check next to any statement with which the text agrees.
|
Me |
Text |
|
|
A plane is a flat surface that goes on and on forever in all directions. |
||
|
Any line that goes through the point (0,0) will have a slope of 0. |
||
|
x intercepts are of the form (k,0) where k is any real number. _____ |
||
|
y intercepts are also of the form (k,0) where n is a real number. |
||
|
All linear equations can be written in the form |
Worksheet 7.8: Anticipation Guide: Linear Equations
Name _____ Date _____
Directions: Consider the lesson on linear equations and slope. Then in the column labeled Me, place a check next to any statement with which you agree. After reading the section, consider the column labeled Text, and place a check next to any statement with which the text agrees.
|
Me |
Text |
|
|
Another name for the xy-plane is the rectangular coordinate plane. |
||
|
Any line that goes through the point (0,0) will be the identity equation |
||
|
The equation |
||
|
The lines |
||
|
The slope is the difference in x's divided by the difference in y's. |