SAT SUBJECT TEST MATH LEVEL 1
STATISTICS, COUNTING, AND PROBABILITY
![]()
CHAPTER 16 Basic Concepts of Statistics, Counting, and Probability
![]()
• Statistics
• Counting
• Probability
• Exercises
• Answers Explained
Very few questions on the Math 1 test are about statistics and probability.
However, the ones that do appear are generally pretty easy if you know the appropriate definitions. Therefore, you should definitely review the material in this section.
STATISTICS
If you are analyzing a set of data, you must know four terms: mean (which on the Math 1 test is often referred to as the arithmetic mean), median, mode, and range.
The arithmetic mean of a set of numbers is what you have always called the average. If A represents the average (arithmetic mean) of a set of n numbers, then:
![]()
Key Fact O1
If A is the average (arithmetic mean) of a set of n numbers, then:
• ![]()
• nA = sum
When you take the Math 1 test, it is very unlikely that you will be asked to calculate the average of a list of numbers since that is just simple arithmetic. More likely, you will have to find the average of some algebraic expressions or have to apply the definition of average to a problem in geometry.
EXAMPLE 1: What is the average (arithmetic mean) of the measures of the five angles in a pentagon?
To find the average of five numbers you have to calculate their sum and divide by 5. By KEY FACT I2, the sum of the measures of the five angles in a pentagon is (5 – 2) × 180° = 3 × 180° = 540°. So the average is ![]() .
.
|
TACTIC |
Whenever you know the average, A, of a set of n numbers, multiply A by n to get their sum. |
EXAMPLE 2: Lior has taken five Russian tests so far this year and his average is 88. What grade does he need on his sixth test to raise his average to 90?
Use TACTIC O1 twice. So far Lior has earned 5 × 88 = 440 points. If after six tests his average is to be 90, then he needs a total of 6 × 90 = 540 points. So on his sixth test he needs 540 – 440 = 100 points.
EXAMPLE 3: A store has 30 employees—10 men and 20 women. The average salary of the men is $600 per week and the average salary of the women is $540 per week. What is the average weekly salary of all 30 employees?
If there were an equal number of men and women, the average would just be $570—the average of $600 and $540. However, since there are more women in the group than men, the women”s salaries must be given greater weight. The 10 men earn a total of 10 × $600 = $6,000 per week, and the 20 women earn a total of 20 × $540 = $10,800 per week. So the total weekly earnings of all 30 employees is $6,000 + 10,800 = $16,800. Finally, $16,800 ÷ 30 = $560.
On the Math 1 test, the five answer choices for Example 3 would probably be $570, two amounts less than $570 (one of which would be $560, the correct answer), and two amounts greater than $570. As you saw above, the “obvious” choice of $570 is wrong. Because there are more women than men, the correct answer has to be closer to the women”s figure than to the men”s. Certainly, you would know that the correct answer is less than $570.
The following tactic gives the procedure for calculating a weighted average.
|
TACTIC |
To calculate the weighted average of a set of numbers, multiply each number in the set by the number of times it appears. Then add all the products and divide by the total number of numbers in the set. |
By using TACTIC O2, the solution to Example 3 above would look like this:
![]()
The median of a set of n numbers arranged in increasing order is the middle number (if n is odd) or the average of the two middle numbers (if n is even). The mode of a set of numbers is the number that occurs most often. Note that not every set of numbers has a mode. The range of a set of numbers is the difference between the largest and the smallest numbers in the set.
EXAMPLE 4: On a recent quiz, a group of 10 students earned the following scores: 2, 3, 9, 3, 5, 7, 7, 10, 7, 6. To find the median, first list the scores in increasing order: 2, 3, 3, 5, 6, 7, 7, 7, 9, 10. The median is 6.5, the average of the middle two scores. The mode is 7, the score that occurs most often in the list. The range is 8, the difference between the largest number (10) and the smallest number (2).
The median is actually a special case of a measure called a percentile. In the same way that the median divides a set of data into two roughly equal groups, percentiles divide a set of data into 100 roughly equal groups. P63, the 63rd percentile, for example, is a number with the property that 63% of the data in the group is less than or equal to that number and the rest of the data is greater than that number. Clearly, percentiles are mainly used for large groups of data—it doesn”t make much sense to talk about the 63rd percentile of a set of data with 5 or 10 or 20 numbers in it. When you receive your SAT scores, you will receive a percentile ranking for each of your scores. If you are told that your Math score is at the 63rd percentile, that means that your score was higher than the scores of approximately 63% of all SAT test takers (and, therefore, that your score was lower than or equal to those of approximately 37% of SAT test takers).
From the definition of percentile, it follows that the median is exactly the same as the 50th percentile. Another term that is often used in analyzing data is quartile. There are three quartiles, Q1, Q2, and Q3, which divide a set of data into four roughly equal groups. Q1, Q2, and Q3 are called the first, second, and third quartiles and are equal to P25, P50, and P75, respectively. So, if M represents the median, then M = Q2 = P50. A measure that is sometimes used to show how spread out the numbers in a set of data are is the interquartile range, which is defined as the difference between the first and third quartiles: Q3 – Q1.
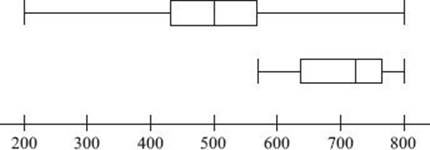
The interquartile range shows where the middle half of all the data lies. The interquartile range can be graphically illustrated in a diagram called a boxplot. A boxplot extends from the smallest number in the set of data (S) to the largest number in the set of data (L) and has a box representing the interquartile range. The box, which begins and ends at the first and third quartiles, also shows the location of the median (Q2). The box may be symmetric about the median, but does not need to be, as is illustrated in the two boxplots, below. The upper boxplot shows the distribution of math SAT scores for all students who took the SAT in 2010, while the lower boxplot shows the distribution of math scores for the students at a very selective college.
EXAMPLE 5: Twelve hundred 18-year-old boys were weighed, and their weights, in pounds, are summarized in the following boxplot.
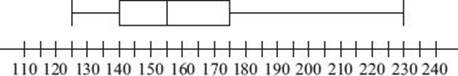
If the 91st percentile of the weights is 200 pounds, to the nearest hundred how many of the students weigh less than 140 pounds or more than 200 pounds?
From the boxplot, we see that the first quartile is 140. So, approximately 25% of the boys weigh less than 140. And since the 91st percentile is 200, approximately 9% of the boys weigh more than 200. So 25% + 9% = 34% of the 1,200 boys fall within the range we are considering.
Finally, 34% of 1,200 = 0.34 × 1200 = 408, or to the nearest hundred: 400.
A Math 1 test could have one or two questions that requires you to interpret the data presented in a boxplot or other table or graph. The graph could be a simple bar graph, line graph, circle graph, or stem-and-leaf plot. Reading these graphs should cause absolutely no difficulty. The associated question would likely ask you to express some of the data as a percent of the total data; this should entail a straightforward use of percents, as reviewed in Chapter 3.