SAT SUBJECT TEST MATH LEVEL 2
PART 2
![]()
REVIEW OF MAJOR TOPICS
![]()
CHAPTER 4
Data Analysis, Statistics, and Probability
|
• Data Analysis and Statistics • Probability |

4.1 Data Analysis and Statistics
![]()
MEASURES AND REGRESSION
Quantitative data are number sets such as heights, weights, test scores, tensile strength, and so forth. By contrast, categorical data consist of descriptive labels, such as hair color, city of residence, socioeconomic status, and the like. Since the Math Level 2 test is unlikely to include questions about categorical data, the concepts described below pertain to quantitative data only.
Measures of center summarize a data set using a single “typical” value. Three measures of center might be encountered on the Math Level 2 test: mean, median, and mode.
The mean is the sum of all the data values divided by the number of values. The formula for the mean ![]() of a data set is
of a data set is ![]() , where
, where ![]() indicates the sum of the data values xi and n is the number of data values.
indicates the sum of the data values xi and n is the number of data values.
To determine the median , the data must first be ordered. If the number of values is odd, the median is the single middle value. If the number of values is even, the median is the mean of the two middle values. There is no formula for the median of a data set.
The mode is the value that appears most often. There is no formula for the mode of a data set.
EXAMPLES
1. The heights of the starting basketball team for South High School are 69″, 72″, 75″, 78″, and 78″. Find the mean, median, and mode of this data set.
The mean is ![]() ″. The median is 75″. The mode is 78″.
″. The median is 75″. The mode is 78″.
2. The mean of 24 test scores is 77.5. When the 25th class member takes the test, the mean goes down by 1.1 points. What was that 25th score?
The total of the 24 test scores is 24 × 77.5 = 1860, and the total of the 25 test scores is 25 × 76.4 = 1910. Therefore, the 25th score is 1910 – 1860 = 50.
3. What is the median of the frequency distribution shown in the table?
|
Data Value |
Frequency |
|
24 |
3 |
|
25 |
7 |
|
26 |
5 |
|
27 |
1 |
There are 16 data values altogether, so the median is the mean of the 8th and 9th largest values. Both of these values are 25, so the median is also 25.
The Math Level 2 test might ask questions about measures of spread. These questions ask about how spread out a set of data values is.
The range is a measure of spread. It is the difference between the largest and smallest data values.
4. Find the range of the data values 85, 96, 72, 89, 66, and 78.
The largest value is 96 and the smallest is 66. The range is 96 – 66 = 30.
Loosely speaking, the standard deviation is the “average” difference between individual data values and their mean. The formula for the standard deviation s of a data set is ![]() . The larger the standard deviation, the more spread out a data set is. Standard deviation is a unit-free measure of the “distance” between a specific data value and the mean. Thus the standard deviation can be used to compare single data values from different data sets. A z-score, where
. The larger the standard deviation, the more spread out a data set is. Standard deviation is a unit-free measure of the “distance” between a specific data value and the mean. Thus the standard deviation can be used to compare single data values from different data sets. A z-score, where ![]() is the number of standard deviations s that a data value x is from the mean
is the number of standard deviations s that a data value x is from the mean ![]() . The greater the value of |z |, the less common the data value x is. In other words, fewer data values have a high z-score.
. The greater the value of |z |, the less common the data value x is. In other words, fewer data values have a high z-score.
5. Which data set has the smaller standard deviation: {5, 7, 9} or {4, 7, 10}?
Both data sets have a mean of 7. However, the first set is less spread out than the second, so the first has the smaller standard deviation. According to the formula, the standard deviation of the first data set is 2 while that of the second data set is 3.
6. A chart showing sports statistics for a particular school is shown below. Which is statistically a better score: 50.30 seconds in the backstroke or 74 inches in the high jump?
|
Stroke |
Mean |
Standard Deviation |
|
Backstroke |
50.72 sec. |
0.24 sec. |
|
High Jump |
72.9 in. |
0.54 in. |
A time of 50.30 seconds in the backstroke is ![]() standard deviations better (less) than the backstroke mean. A height of 74 inches in the high jump is
standard deviations better (less) than the backstroke mean. A height of 74 inches in the high jump is ![]() standard deviations better (more) than the high jump mean. Therefore, the high jump performance is better.
standard deviations better (more) than the high jump mean. Therefore, the high jump performance is better.
Measures of center and spread apply to a single variable. Regression is a technique for analyzing the relationship between two variables. This technique summarizes relationships such as mathematical equations in which the two variables are denoted by x (the independent variable) and y(the dependent variable). The Math Level 2 test may ask about any one of three models to capture the relationship between x and y :
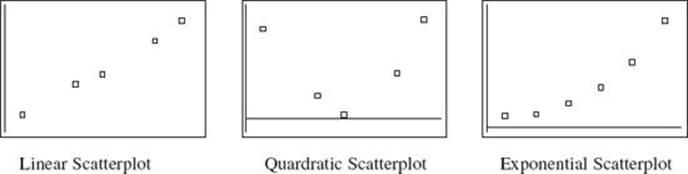
• Linear model y = a0 + a1x
• Quadratic model y = a0 + a1x + a2x2
• Exponential model ![]()
The figures below show scatter plots having these shapes. Regression techniques use paired values (x , y) to estimate parameter values a0, a1, a2, depending on the model selected. Once this is done, the equation for that model can be used to predict y for a given value of x.
The Level 2 test does not require students to know the mathematics of regression techniques. Students should know how to use their calculators to get parameter estimates for a particular model and to use the equation as a prediction tool.
7. The decennial population of Center City for the past five decades is shown in the table below. Use exponential regression to estimate the 1965 population.
Population of Center City
|
Year |
Population |
|
1950 |
48,000 |
|
1960 |
72,000 |
|
1970 |
95,000 |
|
1980 |
123,000 |
|
1990 |
165,000 |
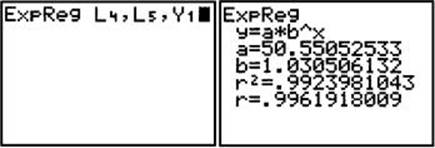
Transform the years to “number of years after 1950” and enter these values into L4. Then enter the populations in thousands. Set up the scatterplot by pressing 2ndY= and selecting a plot (Plot 1). Turn the plot on, select the scatter plot logo, and enter the list names. Then press STAT/CALC/ExpReg L4,L5,Y1. This will store the regression equation in Y1. The resulting command is shown in the left screen below. Press ENTER to display the values for the equation. These are shown in the right screen below.
Press ZOOM/9 to view the scatterplot and exponential curve. Press 2nd/CALC/value and enter 15, representing 1965. The cursor moves to the point on the regression curve where x = 15 and displays both x and y at the bottom of the screen, as shown below.
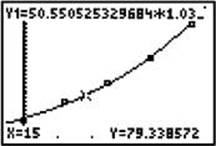
The 1965 population was about 79,300.
EXERCISES
1. Last week, police ticketed 13 men traveling 18 miles per hour over the speed limit and 8 women traveling 14 miles per hour over the speed limit. What was the mean speed over the limit of all 21 drivers?
(A) 16 miles per hour
(B) 16.5 miles per hour
(C) 17 miles per hour
(D) none of these
(E) cannot be determined
2. If the range of a set of integers is 2 and the mean is 50, which of the following statements must be true?
I. The mode is 50
II. The median is 50
III. There are exactly three data values
(A) only I
(B) only II
(C) only III
(D) I and II
(E) I, II, and III
3. What is the median of the frequency distribution shown below?
|
Data Value |
Frequency |
|
0 |
1 |
|
1 |
3 |
|
2 |
7 |
|
3 |
15 |
|
4 |
10 |
|
5 |
7 |
|
6 |
3 |
|
7 |
3 |
(A) 2
(B) 3
(C) 4
(D) 5
(E) Cannot be determined
4. Which of the following statements must be true?
I. The range of a data set must be smaller than its standard deviation.
II. The standard deviation of a data set must be smaller than its mean.
III. The median of a data set must be smaller than its mode.
(A) I only
(B) I and II
(C) II only
(D) I, II, and III
(E) none are true
5. The mean and standard deviation for SAT math scores are shown in the table below for five high schools in a large city. A particular score for each city is also shown (in the right column).
|
School |
Mean |
Standard Deviation |
Single Score |
|
A |
532 |
24 |
600 |
|
B |
485 |
30 |
560 |
|
C |
515 |
22 |
561 |
|
D |
396 |
26 |
474 |
|
E |
479 |
35 |
552 |
Which single score has the highest z-score?
(A) 474 in school D
(B) 552 in school E
(C) 560 in school B
(D) 561 in school C
(E) 600 in school A
6. Jack recorded the amount of time he studied the night before each of 4 history quizzes and the score he got on each quiz. The data are in the table below.
|
Score |
Time (min.) |
|
86 |
45 |
|
70 |
15 |
|
90 |
40 |
|
78 |
35 |
Use linear regression to estimate the score Jack would get if he studied for 20 minutes.
(A) 71
(B) 72
(C) 73
(D) 74
(E) 75
7. The scatter plot shows gas mileage (miles per gallon) at various speeds (miles per hour) when a car was driven 100 miles at various speeds on a test track.
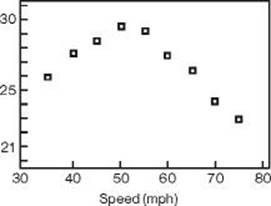
Which regression model is probably the best predictor of gas mileage as a function of speed?
(A) constant
(B) linear
(C) quadratic
(D) cubic
(E) exponential
Answers and Explanations
Measures and Regression
1. * (B) There are 13 eighteens and 8 fourteens, so the total over the speed limit is 346. Divide this by the 21 people to get 16.5.
2. (B) Since the data values are integers, the range is 2, and the mean is 50, the possible data values are 49, 50, and 51.
I. The set could consist of equal numbers of 49s and 51s and have a mean of 50 without 50 even being a data value. So I need not be true.
II. Since the mean is 50, there must be equal numbers of 49s and 51s, so 50 is also the median. II must be true.
III. Explanations in I and II imply that III need not be true.
3. (B) There are 49 data values altogether, so the median is the 25th largest. Adding the frequencies up to 25 puts the 25th number at 3.
4. (E) None are true. The range of any data set must be larger than its standard deviation because the range measures total spread while the standard deviation measures average spread. So Choice I is false. Either the mean or standard deviation of a data set can be larger. For example, the mean of the data {1, 5, 10} is 5.3, while its standard deviation is 4.51. The mean of the data set {1, 5, 20} is 8.7, while its standard deviation is 10.0. So Choice II is false. Either the median or mode of a data set can be larger. For example, the median of the data set {1, 2, 3, 4, 4} is 3, while its mode is 4. The median of the data set {1, 1, 2, 3, 4} is 2 while its mode is 1. So Choice III is false.
5. * (D) The z-scores for the five schools are 2.8 for A, 2.5 for B, 2.1 for C, 3 for D, and 2.1 for E.
6. * (C) Enter the data in two lists (study times in L1 and test scores in L2). Enter STAT/CALC/8, and enter VARS/YVARS/Function/Y1, followed by ENTER. This produces estimates of the slope (b) and y-intercept (a) of the regression line a + bx. Enter this expression into Y1. Enter Y1(2) to get the score of 72.
7. * (C) The scatter plot has the shape of a parabola with a maximum. Therefore, the quadratic model would be the best predictor.