Early Childhood Education
Intelligence Testing
The measurement of intelligence in children began with the Binet-Simon scale. Because Alfred Binet and Theophile Simon viewed intelligence as a holistic phenomenon, their test resulted in one score called the mental age (MA). A child who scored at the level of a six-year-old had a mental age (MA) of 6. In the first version of the Stanford-Binet, Lewis Terman took German psychologist William Stern’s suggestion to express the child’s performance as an intelligence quotient (IQ). It was calculated using the following formula: IQ = MA/CA x 100. A child who was 6-years-old chronologically, but whose score was equivalent to that of an 8-year-old would have an IQ of 133 (8/6 x 100 = 133). The current formula for calculating IQ is more mathematically sophisticated.
The Fifth Edition of the Stanford-Binet Intelligence Scales (SB5) (2003) is an individually administered test suitable for 2 year olds through adults. It includes comprehensive coverage of five factors: fluid reasoning, knowledge, quantitative reasoning, visual-spatial processing, and working memory, and the ability to compare verbal and nonverbal performance. Items range from the very easy to the very difficult. Scores are figured by comparing a child’s score to scores of other children the same age. When a child performs at the average for her/his age, her/his IQ is 100. For the youngest children (2-7 years) professionals can use the Stanford-Binet Intelligence Scales for Early Childhood (Early SB5), which combines a Test Observation Checklist and software-generated Parent Report with the subtests from the SB5.
David Wechsler (1896-1981), a clinical psychologist at Bellevue Hospital in New York, developed the Wechsler Intelligence Scale for Children (WISC) for 6- to 16-year-old children in 1949 and the Wechsler Preschool and Primary Scale of Intelligence (WPPSI) for 3- to 8-year-old children in 1967. He was dissatisfied with the single IQ score derived when using the Stanford-Binet. The Wechsler tests, designed for the normal population with IQs from 70 to 130, offer a general intelligence score, as well as verbal and performance scores. The tests, downward extensions of the Wechsler Adult Intelligence Scale, are now more widely used by psychologists than the Stanford-Binet. Both the Stanford-Binet and the WISC are useful for predicting children’s academic success. Neither the Wechsler tests nor the Stanford-Binet is sensitive enough to identify learning difficulties in preschool children, but the Stanford-Binet LM (1972) is most successful at identifying exceptionally gifted young children.
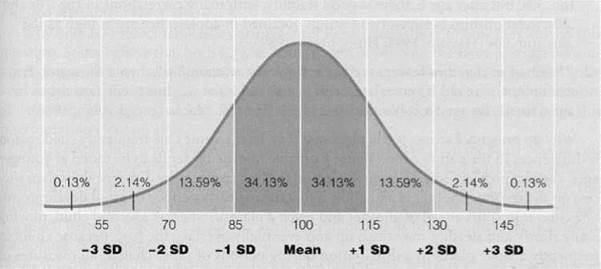
Figure 1. The normal curve. Scores on intelligence tests tend to form a normal, bell-shaped curve. Taken from Berk, L. E. (2003). Child development. Boston: Allyn and Bacon, p. 323.
Measuring the intelligence of infants and toddlers is a difficult task because infants cannot sit to answer questions or follow directions to perform certain tasks. The Bayley Scales of Infant Development (1993), based on the normative work of Arnold Gesell, is considered the best measure of infant development from 1 to 42 months. The mental scale includes sensory perceptual acuity, discriminations, learning and problem solving, verbal ability, and concept formation. The motor scale includes muscle control as well as gross and fine motor abilities. The testing professional also rates attitude, interest, emotion, energy, activity, and responsiveness using the Behavior Rating Scale. The Bayley Scales which assess sensorimotor skills are poor predictors of later intelligence scores because different aspects of intelligence (language, thinking, and problem solving) are assessed at later ages. Infant tests are helpful for identifying for further observation and intervention, infants who are likely to have developmental problems. The Fagan Test of Infant Intelligence, which measures habituation/recovery to visual stimuli, predicts childhood IQ better than do the Bayley Scales.
Intelligence test scores tend to be distributed normally among the population. Most intelligence tests convert their raw scores so the mean (average) score is 100 and the standard deviation (average variability) is 15. As you can see in the figure above, 68 percent of individual scores fall into the average range (IQs between 85 and 115); 13 59 percent of scores fall between 70 and 85 and 13 59 percent fall between 115 and 130. Only 2.27 percent of people score higher than 130 and 2.27 percent score lower than 70. The Stanford-Binet and the Wechsler tests are periodically restandardized to keep the mean at 100. Since 1930, intelligence test performance has been rising worldwide, a phenomenon called the Flynn effect in honor of New Zealand researcher, James Flynn, who first calculated the extent of the effect.
Further Readings: Black, Maureen M., and Karen Matula (1999). Essentials of Bayley Scales of Infant Development II Assessment. Hoboken, NJ: Wiley; Cole, Michael, Shelia R. Cole, and Cynthia Lightfoot (2005). The development of children. 5th ed. New York: Worth, pp. 505-516; Feldman, Robert S. (2007). Child development. 4th ed. Upper Saddle River, NJ: Pearson Prentice Hall, pp. 338-345; Plucker, Jonathan A., ed. (2003). Human intelligence: Historical influences, current controversies, teaching resources. Available online at http:///www.indiana.edu/-intell.
Carol S. Huntsinger