Hacking Education: 10 Quick Fixes for Every School (2015)
HACK 10. THE 360 SPREADSHEET
Collect a Different Kind of Student Data
One sees clearly only with the heart. Anything essential is invisible to the eyes.
— ANTOINE DE SAINT-EXUPÉRY, THE LITTLE PRINCE
THE PROBLEM: TURNING STUDENTS INTO NUMBERS
FOR AT LEAST a decade now, the driving force behind education reform has been data. We talk about collecting data, analyzing data, and making data-driven decisions. All of this data can certainly be useful, helping us notice patterns we might not have seen without aggregating our numbers in some way, looking for gaps and dips and spikes, allowing us to figure out where we are strong and where we need help. In terms of certain academic behaviors, we can quantify student learning to some extent and improve our practice as a result.
And yet, we know this is not enough. We know our students bring with them so many other kinds of data. So many other factors contribute to academic success: the atmosphere in their homes, the demands of their out-of-school school schedule, the physical concerns that distract them, the passions and obsessions that consume them. These things are much harder to measure, so we don’t even try, focusing instead on the things we can convert to numbers.
In the spring of 2015, Denver elementary teacher Kyle Schwartz asked her students to complete this sentence in writing: “I wish my teacher knew . . . ” The student responses were so unexpected, so moving, Schwartz shared some of them online, igniting a movement that went viral within hours. Teachers everywhere asked their students the same question, learning in late spring things that had troubled their kids all year:
“I wish my teacher knew how much I miss my Dad because he got deported to Mexico when I was 3 years old and I haven’t seen him in 6 years.”
“I wish my teacher knew that I’ve been having trouble balancing my homework and sports lately.”
“I wish my teacher knew I don’t have pencils at home.”
The overwhelming response to this idea illustrates a significant gap in the data we collect on our students. Despite our efforts to carefully examine student performance and choose instructional interventions that best meet their needs, the truth is, we need to be collecting, organizing, and analyzing more robust data on our students—facts about their home lives, their likes and dislikes, their learning preferences—the things that really matter.
THE HACK: COLLECT DATA ON THE WHOLE CHILD
Most teachers make an effort to get to know their students, and many regularly distribute surveys at the start of each school year to speed up that process. The problem is, most teachers read these surveys once, then file them away. Sure, they might have every intention of returning to the surveys and reviewing them later, but far too often, that time never comes. We rely on our day-to-day interactions for relationship building, and although we get to know some students quite well this way, others just fade into the background.
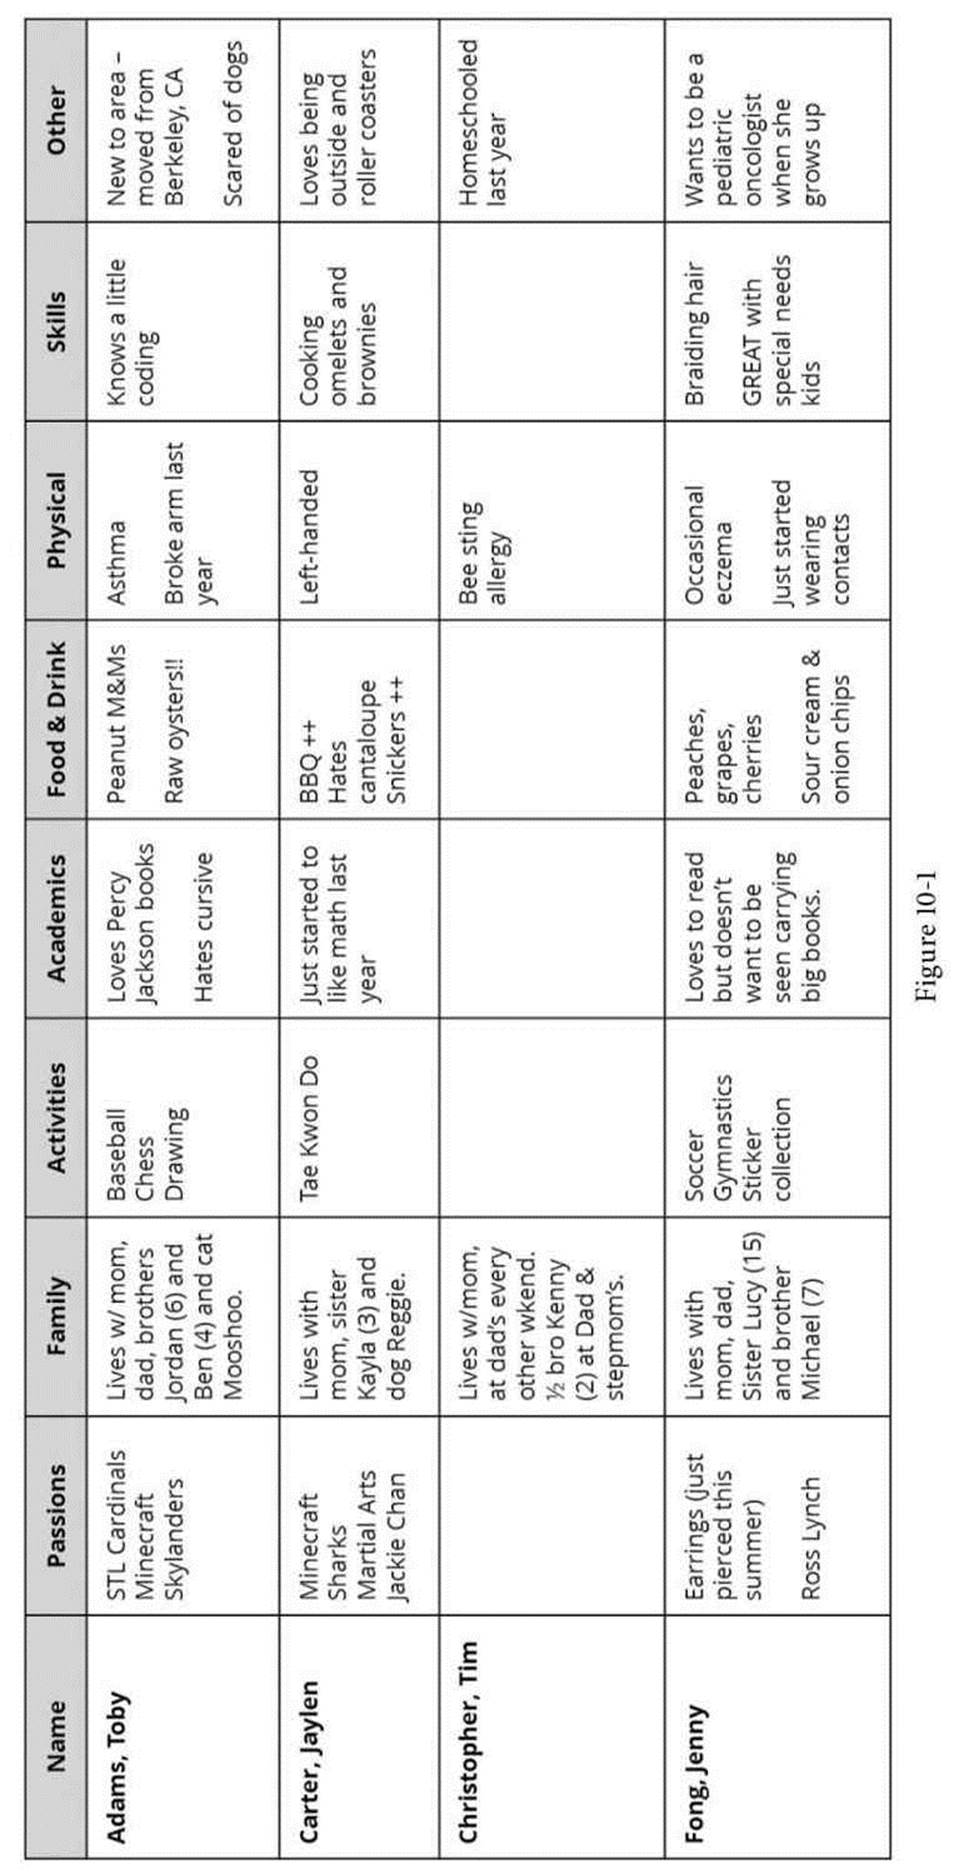
A 360 Spreadsheet is a place for teachers to store and access the “other” data we collect on our students, giving us a more complete, 360-degree view of each student. It’s a single chart that organizes it all and lets us see, at a glance, things we might otherwise forget. Many teachers already keep track of students’ birthdays. Think of this as a birthday chart on steroids. Figure 10-1 is just one possible version of a 360 Spreadsheet:
Because the 360 Spreadsheet is a single document, teachers can access it much more easily than they could a whole folder of surveys. Having the information formatted this way also makes it immediately clear which students a teacher needs to get to know better.
The chart in Figure 10-1 sorts student information into the following suggested categories:
· Passions: What is the student really into? Keeping track of things like hobbies, collections, and other hard-to-categorize obsessions will help you connect with your students. This information will boost your ability to help students select books for independent reading, choose topics for writing or research projects, or even better understand math or history concepts by placing them in the context of things they are just crazy about.
· Family: The home environment plays a major role in how well a student performs academically. This category can include information about whether a student lives in one home or travels between the homes of two parents. It might ask about the number of people who live in the household. It can also include other family-related facts, like whether anyone at home is dealing with an illness, is currently incarcerated, has special needs, travels frequently, or has a noteworthy profession or skill set (Mom is a circus performer? Probably worth noting.)
· Activities: This category will help you better understand what outside activities fill up a student’s schedule when they are not in school. Are they on a sports team? Do they have a part-time job? Will they be busier on certain days of the week or at certain times of the year? Not only will this information give you a more complete picture of who your students are, it will build your awareness of the other demands placed on their time.
· Academics: Here’s where you can put things a standardized test won’t tell you about a student’s academic needs and preferences: If a student struggles with handwriting, expresses a strong desire to work alone, has a strong interest in a particular subject area, or lights up during certain types of activities, record this information; it will help you individualize instruction later.
· Food & Drink: No, you are not a caterer. But why not keep a list of each child’s favorite candy or snack? While you’re at it, record food allergies on this chart as well—the information is probably in the school paperwork already; might as well add it here.
· Physical: Along with conditions that are already listed on students’ official paperwork, this category can include others that are not, but are still important, like needing to use the restroom frequently or the tendency to get cold easily.
· Skills: Our students bring with them talents and skills we may not even be aware of if we don’t ask, so when you find these things out, include them in your chart. Has a student been taking violin lessons for years? Add that. Do they know a lot about dairy farming? Origami? Photography? Put it all in there. Not only will knowing about these skills further develop your knowledge of the student, they may also come in handy when you need help or information about an area where you lack expertise.
· Other: This seems like it could be a throw-away category, but making room for miscellaneous information is a good idea. Things like sensitivities to loud noises, religious practices, or random facts about student histories (e.g., “Lived in China”) should also be recorded, even if they don’t necessarily fit into any broad category.
Although these categories offer vital information, they are just suggestions. Teachers can and should collect whatever information is most relevant to them, information that will help you connect to your students as whole people and build strong relationships with them.
WHAT YOU CAN DO TOMORROW
A 360 Spreadsheet works best if you use and maintain it all year long, but by following these steps, you will immediately get an idea of how powerful it can be at any point in the year:
· Gather the data. Have students submit their responses to a short list of questions about themselves (3 or 4 questions). Ask about things you haven’t already learned about them—look at the list above and choose a few topics you would like to know more about.
· Build your spreadsheet. Create a basic table in Microsoft Word, a spreadsheet in Excel, or just make a rough chart on paper—whatever works best for you to catalog the information in one place. Then record student responses, giving each student their own row and using the columns to record individual responses.
· Use the data. Over the next few days, find a way to use at least one fact from each student’s row in conversation with them—use a highlighter to mark off every time you use an item. Even though students gave you this information themselves, you’ll find that most of them are shocked that you remember!
A BLUEPRINT FOR FULL IMPLEMENTATION
Step 1: Take inventory.
Create a questionnaire or survey for collecting information about students. The ideal time to do this is at the beginning of the school year, but it’s never too late. Include questions about the topics suggested earlier, or add your own questions. For very young students, this questionnaire can be sent home for parents to complete.
Step 2: Enter data.
This is what separates this hack from what teachers often do, which is to collect the surveys, read them, then file them. By entering the data into a single chart, you can see student data at a glance.
Step 3: Study your data.
It’s a good idea to set aside some time right away to read through each student’s information carefully, mark anything that seems noteworthy, and start thinking about how you can use this information in your interactions with students. Also, look for gaps: If some categories are a bit sparse for some students, this is your signal to get to know those students better in those areas. If a student didn’t supply a response to a certain question, it could indicate a lack of interest in that topic, or it might mean they are not comfortable sharing anything about it yet. Follow up with the student to see what you can learn.
Step 4: Use your data for weekly planning.
The 360 Spreadsheet only works if you use it, and the best way to make sure you use it is to build it into your weekly planning. Sometimes it will influence instructional decisions: If you are thinking about ways to introduce a lesson, reminding yourself of students’ interests can help you better tie your content to the things students care about.
Other times your data will help with relationship building: Skim your chart every week for students you’ve had some trouble with or who have been especially quiet, and find something to ask each of them about. How is the new puppy doing? Are they looking forward to Rosh Hashanah? What have they been building lately in their Minecraft world? Instead of just intending to connect with students, add these specific conversation starters to your weekly plans and you’ll see wonderful results.
Step 5: Keep collecting.
What you want to know about students will evolve from the beginning of the year to the end, so keep collecting information. If one student happens to mention that his family went to Paris last summer, use that day’s exit slip to ask students to list places they have traveled with their families, and add this information to your spreadsheet. When a student mentions that her aunt and cousin just moved in with her family, take note—this will change the home dynamic and may impact the student’s school performance.
OVERCOMING PUSHBACK
I don’t have time to enter all this data. Consider collecting the initial round of information electronically: Creating a Google Form would allow student responses to be placed automatically into a Google spreadsheet, and all of these tools are free. From that point, you could manually add new information to the spreadsheet as the year progresses.
I have too many students / I only have my students for a short time / I teach online. In each of these situations, finding a systematic way to quickly learn about your students is even more important than it would be in a small, self-contained, full-year classroom, where it’s much easier for teachers to get to know their students well. Regardless of your teaching situation, the better you get at knowing your students as whole people, the better you’ll be at teaching them.
Some of this information is private; what if other students see it? Although much of the data you collect may seem innocuous enough—who cares if anyone finds out that Johnny likes peanut M&Ms?—some of the information will be private stuff. Treat your 360 Spreadsheet the same way you’d treat other confidential documents—don’t leave it open on your desk (or computer desktop), don’t share it whole-cloth with other educators, and keep it private even from your own family members. Do remember, though, that you are legally bound to report instances of child abuse or neglect when you learn about them. In these cases, sharing information with your guidance counselor or administrators would not only be appropriate, but required.
I’ve tried this, and it doesn’t work. If you’re already pouring this kind of student information into one central document, fantastic. But if you haven’t seen real benefits, it’s possible you’re not using the spreadsheet to its full potential. Do you look it over on a regular basis? When you notice a gap in student information, do you follow up with that student to learn more about him or her? Could you add a few different questions that would help you get to know your students better? Are you updating your chart throughout the year? You already have a system in place; now see if you can tweak it so it works even better.
THE HACK IN ACTION
Lisa Tremonte, a special education teacher at Apshawa Elementary School in West Milford, New Jersey, began using a 360 Spreadsheet in the fall of 2014. After giving students a survey, she entered their responses into the chart, then stored the spreadsheet in the front of her planning binder, which made it accessible at all times and enabled her to add to it over the school year as she learned more about her students. “In a quick glance,” she says, “I can access a wealth of information that really matters about my students. I use it to talk to my students about their lives outside of school when we’re saying hello or during lunch and snack time.”
Although the spreadsheet does serve an academic purpose, offering ideas when students struggle to come up with topics for writing assignments, its greater value is that it makes students feel seen. “It enables me to ask students direct questions about the sports they play, teams they love, their pets, siblings, and passions,” Tremonte says. “When I do, the look on their faces says it all. They know that I listen to them, care about them, and think their lives are important. The chart has given me the tools I need to ensure that each child feels loved, safe, and at home in my classroom every day.”
Although education has no silver bullets, building strong relationships with our students comes pretty close. It cuts back on classroom management problems, motivates students to work harder, helps us more effectively differentiate instruction, and generally makes school a better place to be for everyone. The easier you can make it to build those relationships, the more they will pay off for you and your students.