SAT Physics Subject Test
Chapter 2 Kinematics
KINEMATICS WITH GRAPHS
So far, we”ve dealt with kinematics problems algebraically, but for this test, you should also be able to handle kinematics questions in which information is given graphically. The two most popular graphs in kinematics are position-versus-time graphs and velocity-versus-time graphs.
Position vs. Time
For example, think of an object that”s moving along an axis in such a way that its position x as a function of time t is given by the following position-versus-time graph:
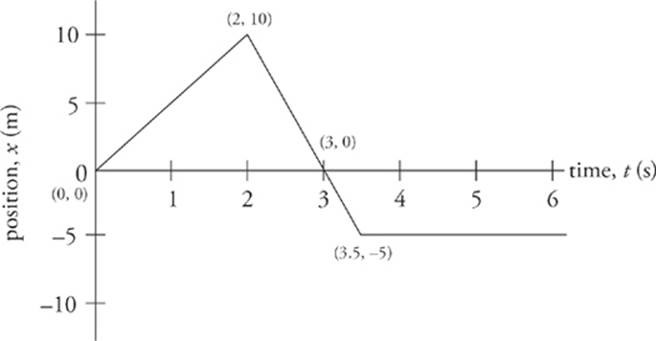
What does this graph tell us? It says that at time t = 0, the object was at x = 0. Then, in the next two seconds, its position changed from x = 0 to x = 10 m.
Then, at time t = 2 s, it reversed direction and headed back toward its starting point, reaching x = 0 at time t = 3 s, and continued, reaching position x = –5 m at time t = 3.5 s. Then the object remained at this position, x = –5 m, at least through time t = 6 s.
We can also determine the object”s average velocity (and average speed) during particular time intervals. For example, its average velocity from time t = 0 to time t = 2 s is equal to the distance it traveled, 10 – 0 = 10 m, divided by the elapsed time, 2 s.
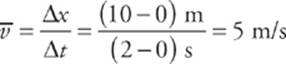
Notice that the ratio that gives us the average velocity, ∆x/∆t, is also the slope of the x versus t graph. For a straight line, the slope is constant. Thus, average velocity and velocity are equal. Therefore:
The slope of a position-versus-time graph gives the velocity.
What was the velocity from time t = 2 s to time t = 3.5 s? Well, the slope of the line segment joining the point (t, x) = (2 s, 10 m) to the point (t, x) = (3.5 s, –5 m) is
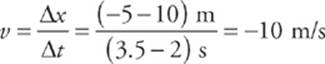
The fact that v is negative tells us that the object”s displacement was negative during this time interval; that is, it moved in the negative x direction. The fact that v is negative also agrees with the observation that the slope of a line that falls to the right is negative. What is the object”s velocity from time t = 3.5 s to time t = 6 s? Since the line segment from t = 3.5 s to t = 6 s is horizontal, its slope is zero, which tells us that the velocity is also zero, but we can also figure this out from looking at the graph, since the object”s position did not change during that time.
Finally, let”s figure out the average velocity and average speed for the object”s entire journey (from t = 0 to t = 6 s). The average velocity is
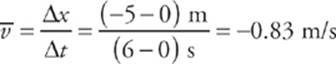
This is the slope of the imagined line segment that joins the point (t, x) = (0 s, 0 m) to the point (t, x) = (6 s, –5 m). The average speed is the total distance traveled by the object divided by the change in time. In this case, notice that the object traveled 10 m in the first 2 s, then 15 m (backward) in the next 1.5 s; it covered no distance from t = 3.5 s to t = 6 s.
Slope
The slope of a line that
goes up to the right is
positive, the slope of a
line that goes down to the
right is negative, and the
slope of a flat (horizontal)
line is zero.
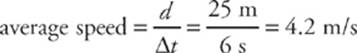
Therefore, the total distance traveled by the object is d = 10 + 15 = 25 m, which took 6 s, so
Note that the average velocity (or average speed) for the whole journey is not the same as taking the average of the velocities (or speeds) of the individual parts of the journey.
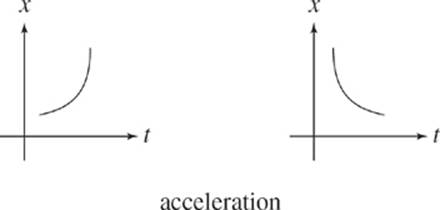
Also, remember that if any portion of a Position vs. Time graph is “curvy,” this indicates that the object is accelerating.
Velocity vs. Time
Let”s next consider an object moving along a straight axis in such a way that its velocity-versus-time graph looks like this:
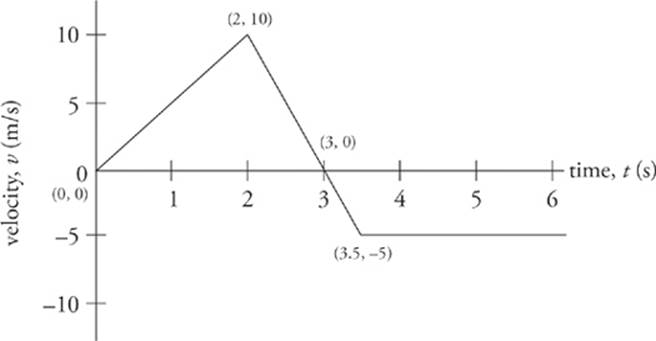
What does this graph tell us? It says that at time t = 0, the object”s velocity was v = 0. Over the first two seconds, its velocity increased steadily to 10 m/s. At time t = 2 s, the velocity began to decrease, eventually becoming v = 0, at time t = 3 s. The velocity then became negative after t = 3 s, reaching v = –5 m/s at time t = 3.5 s. From t = 3.5 s on, the velocity remained a steady –5 m/s.
What can we ask about this motion? First, the fact that the velocity changed from t = 0 to t = 2 s tells us that the object accelerated. The acceleration during this time was
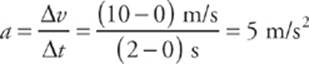
Now notice that the ratio that defines the acceleration, ∆v/∆t, also defines the slope of the v versus t graph. Therefore
The slope of a velocity-versus-time graph gives the acceleration.
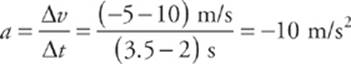
What was the acceleration from time t = 2 s to time t = 3.5 s? The slope of the line segment joining the point (t, v) = (2 s, 10 m/s) to the point (t, v) = (3.5 s, –5 m/s) is
The fact that a is negative tells us that the object”s velocity change was negative during this time—that is, the object accelerated in the negative direction. In fact, after time t = 3 s, the velocity became more negative, telling us that the direction of motion was negative at increasing speed. What is the object”s acceleration from time t = 3.5 s to time t = 6 s? Since the line segment from t = 3.5 s to t = 6 s is horizontal, its slope is zero, which tells us that the acceleration is zero, but you can also see this from looking at the graph; the object”s velocity did not change during this time interval.
Velocity vs. Time Graphs: How Far?
We can ask another question when we see a velocity-versus-time graph: How far did the object travel during a particular time interval? For example, let”s figure out the displacement of the object from time t = 4 s to time t = 6 s. During this time interval, the velocity was a constant –5 m/s, so the displacement was ∆x = v∆t = (–5 m/s)(2 s) = –10 m.
We”ve actually determined the area between the graph and the horizontal axis—after all, the area of a rectangle is base × height and, for the shaded rectangle shown on the next page, the base is ∆t and the height is v. So, base × height equals ∆t × v, which is displacement.
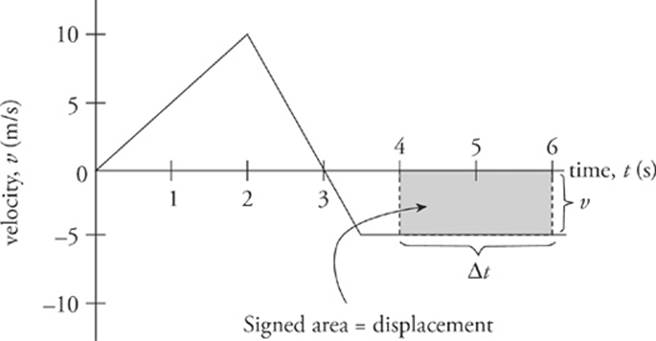
We call this the signed area because regions below the horizontal axis are negative quantities (since the object”s velocity is negative, its displacement is negative). Therefore, by counting areas above the horizontal axis as positive and areas below the horizontal axis as negative, we can make the following claim:
Given a velocity-versus-time graph, the area between the graph and the t-axis is equal to the object”s displacement.
What is the object”s displacement from time t = 0 to t = 3 s? Using the fact that displacement is the area bounded by the velocity graph, we figure out the area of the triangle shown below.
Displacement vs.
Distance
If we wish to find the
distance traveled using
a velocity vs. time graph,
then all areas are
considered to be positive.
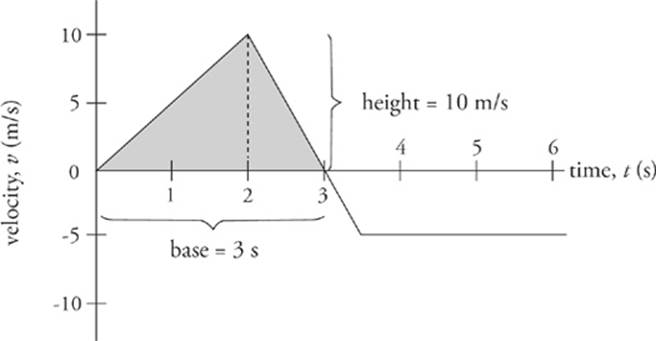
Since the area of a triangle is ![]() × base × height, we find that ∆x =
× base × height, we find that ∆x = ![]() (3 s)(10 m/s) = 15 m.
(3 s)(10 m/s) = 15 m.
![]()
Questions 11-12
The velocity of an object as a function of time is given by the following graph:
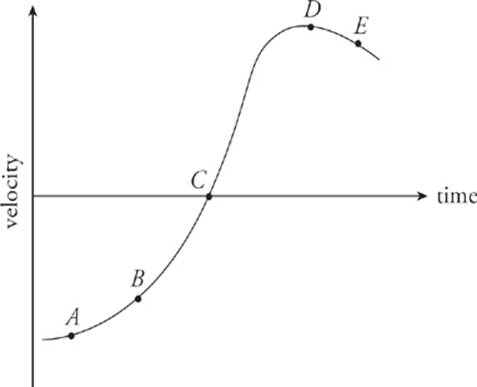
11. At which point (A, B, C, D, or E) is the magnitude of the acceleration the greatest?
12. How would you answer this same question if the graph shown were a position-versus-time graph?
Here”s How to Crack It
11. The acceleration is equal to the slope of the velocity-versus-time graph. Although this graph is not composed of straight lines, the concept of slope still applies; at each point, the slope of the curve is the slope of the tangent line to the curve. The slope is essentially zero at points A and D(where the curve is flat), small and positive at B, and small and negative at E. The slope at point C is large and positive, so this is where the object”s acceleration is the greatest.
12. If the graph shown were a position-versus-time graph, then the slope would be equal to the velocity. The slope of the given graph starts at zero (around point A), slowly increases to a small positive value at B, continues to slowly increase to a large positive value at C, and then, at around point D, quickly decreases to zero. Of the points designated on the graph, point D is the location of the greatest slope change, which means that this is the point of the greatest velocity change. Therefore, this is the point at which the magnitude of the acceleration is greatest.
![]()