SAT For Dummies
Part IV
Take a Number, Any Number: The Mathematics Sections
Chapter 18
Playing the Odds: Statistics and Probability
In This Chapter
![]() Understanding probability and answering multiple-probability questions
Understanding probability and answering multiple-probability questions
![]() Solving problems that deal with geometric probability
Solving problems that deal with geometric probability
![]() Using mean, median, and mode
Using mean, median, and mode
![]() Interpreting scatterplots and other graphs
Interpreting scatterplots and other graphs
![]() Thinking logically to solve logic-based SAT questions
Thinking logically to solve logic-based SAT questions
If you take the SAT 25 times, what are the odds that you’ll die of boredom before entering college? Your SAT proctor, even more bored than the 25 test takers in front of him, launches an ink-filled balloon into the 30-square-foot classroom. What is the probability that it will miss you and land on the mouth-breather in the next row?
Questions like these — similar but humorless — confront you on the SAT. To increase the odds that you’ll ace the topic of statistics and probability, read on. Also peruse this chapter to get the lowdown on the three ms (mean, median, and mode) and scatterplots and other graphs, as well as logic questions.
Working with the Odds: Probability
The probability of an event (or the odds that it will occur) is almost always defined as a fraction. So in many probability situations, you have to compute two separate numbers, one for the numerator and one for the denominator of the fraction. What do these numbers stand for? Well, here’s the formula:

Say that you have a jar containing 6 red, 4 yellow, and 8 blue marbles. The probability of
picking a blue marble = ![]() , which can be reduced to 4⁄9.
, which can be reduced to 4⁄9.
Probability can also be written as a percentage. The easiest way to compute the percentage is with your calculator. Suppose the probability that a major label will sign your garage band is 5⁄8. (In your dreams, by the way. The real probability is 5⁄889,300,923.) Enter 5 ÷ 8 on your calculator to get 0.625. Now move the decimal two places to the right. Bingo. The probability that you and your bandmates will ride to the MTV studio in a limo is 62.5%.
 An event that is certain to happen has a probability of 1, or 100%. An event that is impossible has a probability of zero. Nothing can ever have a probability greater than one or less than zero. Another way to say the second fact: Negative probability doesn’t exist.
When you calculate probability, remember the number 1. All the possible events must have probabilities that add up to 1 (or 100%). That fact leads to a useful rule, which may be stated in three ways:
![]() The probability that an event won’t happen equals 1 minus the (decimal or fractional) probability of the event.
The probability that an event won’t happen equals 1 minus the (decimal or fractional) probability of the event.
![]() The probability that an event won’t happen equals 100% minus the (percent) probability of the event.
The probability that an event won’t happen equals 100% minus the (percent) probability of the event.
![]() The probability that an event won’t happen equals
The probability that an event won’t happen equals

Imagine that you’re sitting in class with 19 other students, and your teacher decides to pick one student at random to stay after school for a round of eraser cleaning. What’s the chance that she picks you? It’s 1⁄20: Out of 20 students, there’s only one you.
So what’s the chance that she doesn’t pick you? Figure it out all three ways:
![]() 1 – 1⁄20 = 20⁄20 – 1⁄20 = 19⁄20
1 – 1⁄20 = 20⁄20 – 1⁄20 = 19⁄20
![]() Because 1⁄20 = 5%, 100% – 5% = 95%
Because 1⁄20 = 5%, 100% – 5% = 95%
![]() Because there are 20 total possibilities (20 students),
Because there are 20 total possibilities (20 students), ![]()
The following sections discuss two variations of the typical SAT probability problem.
Psyching out multiple-probability questions
Not surprisingly, the SAT writers have found plenty of ways to make probability problems harder. One of their favorite torture devices is to ask you about a probability involving multiple events. When a problem involves multiple events, the total number of possibilities is the product of the number of possibilities for each event. If, for example, you open your closet on laundry day and find two clean shirts and three pairs of pants, the total number of outfits you can make is 2 × 3 = 6 (assuming you’re not a fashionista and don’t care about little things like complementary colors). This rule is known as the counting principle, although the “multiplication principle” may be a better name for it. This method works whether you’re using whole numbers, percentages, or fractions.
Multiple-probability questions on the SAT may resemble the following example:
 Jenny arranges interviews with three potential employers. If each employer has a 50% probability of offering her a job, what’s the probability that she gets offered all three?
(A) 10%
(B) 12.5%
(C) 20%
(D) 25%
(E) 100%
The answer is (B). Applying the counting principle to Jenny’s situation, you can say that the probability of her being offered all three jobs is 50% × 50% × 50%, or 1⁄2 × 1⁄2 × 1⁄2 = 1⁄8 (12.5%).
Surviving geometric probability
Unbelievably, those SAT writers sometimes expect you to combine your knowledge of two different areas of mathematics: geometry and probability. (Turn to Chapter 16 for a geometry review.) Check out this example:
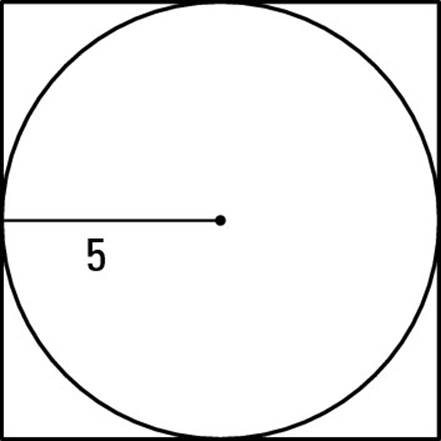
A dart is thrown at the dartboard below. If the radius of the circle is 5 inches, then the probability that the dart lands in the square but not in the circle is closest to
(A) 21%
(B) 22%
(C) 50%
(D) 78%
(E) 79%
The answer is (A). You may recognize this question as a variation of the shaded-area problem. (Check out Chapter 16 for more info on shaded areas.) Because the problem asks about the four corner regions of the diagram, first you have to figure out the area of these regions. The area of the circle is πr2 = π(5)2 = 25π square inches. Because a side of the square equals the circle’s diameter, which is 10, the square’s area is 102 = 100 square inches. That makes the total area of the corner regions equal to 100 – 25π = 100 – 78.54 = 21.46. Because the square’s area is 100, the probability that the dart lands in one of the corners is 21.46⁄100 = 21.46%.
Saying “MMM”: Mean, Median, and Mode
Sometimes the SAT writers give you a group of numbers and ask you to find their average (officially called their mean, or sometimes arithmetic mean). This sort of problem is probably familiar to you, especially if you’re into computing your grade-point average or your favorite baseball player’s batting average. To find the average, just add up the numbers and divide the total by the number of numbers you just added. For example, to find the average of 2, 4, and 9, add those three numbers (total = 15) and divide by three. The average is 5.
 When you calculate an average, don’t fall into the trap of dividing by 2 all the time. You must divide by the number of terms you’re averaging.
 If a group of numbers is evenly spaced, the mean is the middle number (assuming there is one). Suppose you’re asked to find the arithmetic mean of the numbers from 1 to 19. Even with a calculator, adding up all the numbers and then dividing is time-consuming, not to mention easy to mess up. But the 19 numbers are evenly spaced (all 1 apart), and 10 is the middle number. No matter which way you start, from 1 or from 19, you find nine numbers evenly spaced on either side of 10. Therefore, 10 is the average, the mean, and the arithmetic mean. (Use any term you want.)
Remember that this trick works only when the numbers are evenly spaced. If you’re told to find the average of 3, 5, 7, 12, and 18, you have to compute the long way. And despite what common sense may tell you, only an odd number of numbers has a middle number. For example, this trick doesn’t work for a list like 3, 4, 5, 6, 7, 8; this list has an even number of terms, so it doesn’t have a middle term. Remember, you can still find the average by adding up all the numbers and dividing by the total number of numbers. You just can’t use the middle term as a shortcut.
Moving beyond mean (to nice and friendly, or affable and amiable, which are variations on the nice/friendly theme), SAT mathematicians also want you to understand median. The median, as those of you with drivers’ licenses already know, is the strip down the middle of the road. In math, the median is defined as the middle number in a list, when the list is in numerical order. That last bit is important because you may have a list like 2, 5, 3, 7, 8 and need to find the median. It’s not 3, but 5. When you put the numbers in order, the list reads 2, 3, 5, 7, 8, with 5 sitting right in the middle.
If you have an even number of numbers (say, 3, 5, 6, 7, 8, 10), the list has no middle number, so mathematicians cheat a little. The median is the mean of the two numbers closest to the middle. In this example, the two numbers in question are 6 and 7, so the median is 6.5.
The last of the three ms is the mode, the easiest to find. In a mixed bag of numbers, the mode is the number or numbers that pop up most frequently. So if you have a set with three 4s and three 8s, plus pairs of a bunch of other numbers, you have two modes, 4 and 8, in that set. You can also have a set with no mode at all if everything shows up the same number of times.
Which of the following is true for the set of numbers 3, 4, 4, 5, 6, 8?
(A) mean > mode
(B) median > mean
(C) mode > median
(D) median = mode
(E) median = mean
The answer is (A). If you average the terms, you get 30 ÷ 6, or 5, which is the mean. The median is 4.5 (halfway between the third and fourth terms), and the mode is 4. So (A) is the only one that fits.
Reading Graphs
Some of the math questions on the SAT are called data interpretation. Sounds important, huh? Actually, it’s just a pompous name for “reading a graph,” something you’ve been doing for years. Don’t let graph problems intimidate you. Here are the three most common types of graphs you’re likely to see on the SAT:
![]() Bar graph
Bar graph
![]() Circle or pie graph
Circle or pie graph
![]() Two-axes line graph
Two-axes line graph
I explain these graphs in more detail in the following sections. Because the SAT writers sometimes try to trip you up by asking you to compare statistics in two different graphs, I cover that topic here, as well.
Bar graphs
A bar graph has vertical or horizontal bars. The bars may represent actual numbers or percentages. If a bar goes all the way from one side of the graph to the other, it represents 100 percent.
Circle or pie graphs
The circle or pie graph represents 100 percent. The key to this graph is determining the total that the percentages are part of. Below the graph you may be told that in 1994, 5,000 students graduated with PhDs. If a 25-percent segment on the circle graph is labeled “PhDs in history,” you know that the number of history PhDs is 25 percent of 5,000, or 1,250.
Two-axes line graphs and scatterplots
A typical line graph has a bottom and a side axis. You plot a point or read a point from the two axes. A special kind of two-axes graph is the scatterplot. A scatterplot contains a bunch of dots scattered around a two-line graph. Here’s an example:
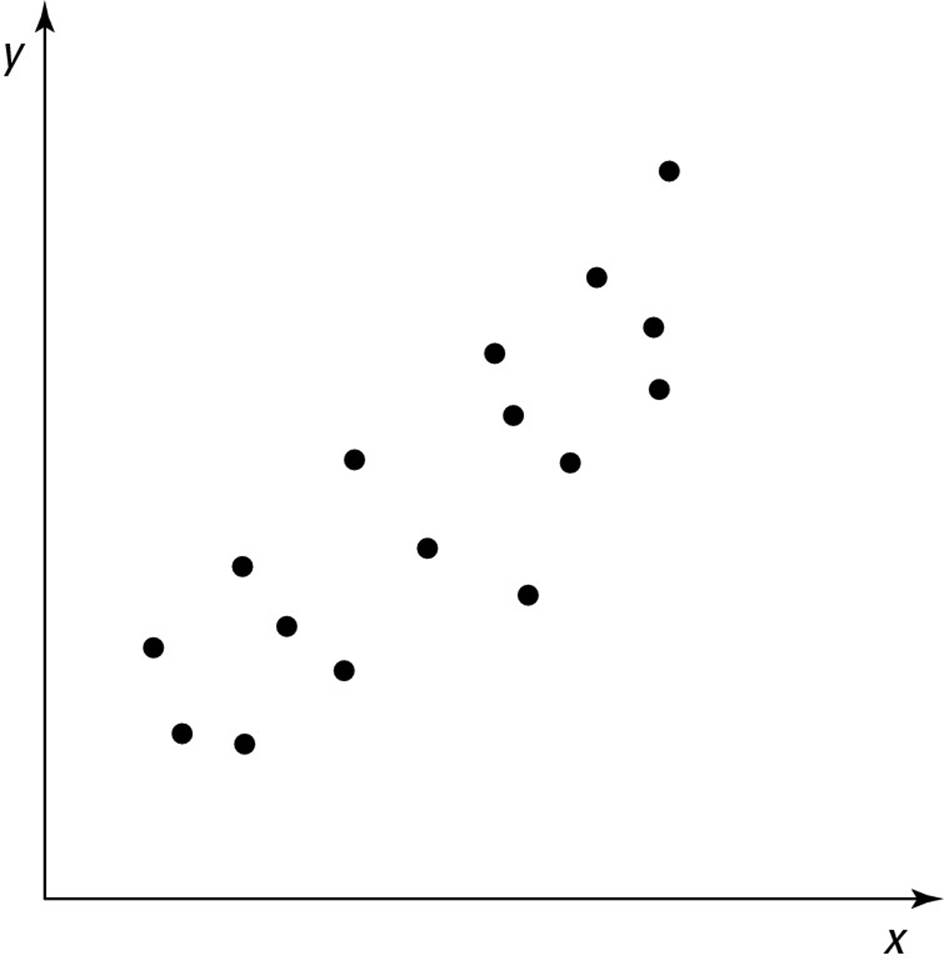
Notice how the points seem to follow a certain trend, getting higher as you move to the right. When a trend is present, drawing a line that estimates the behavior of the points is possible. This line is known as a line of best fit. On the test, you may be given a scatterplot and have to choose the line of best fit from a list of choices, or you may have to estimate the slope of the line of best fit.
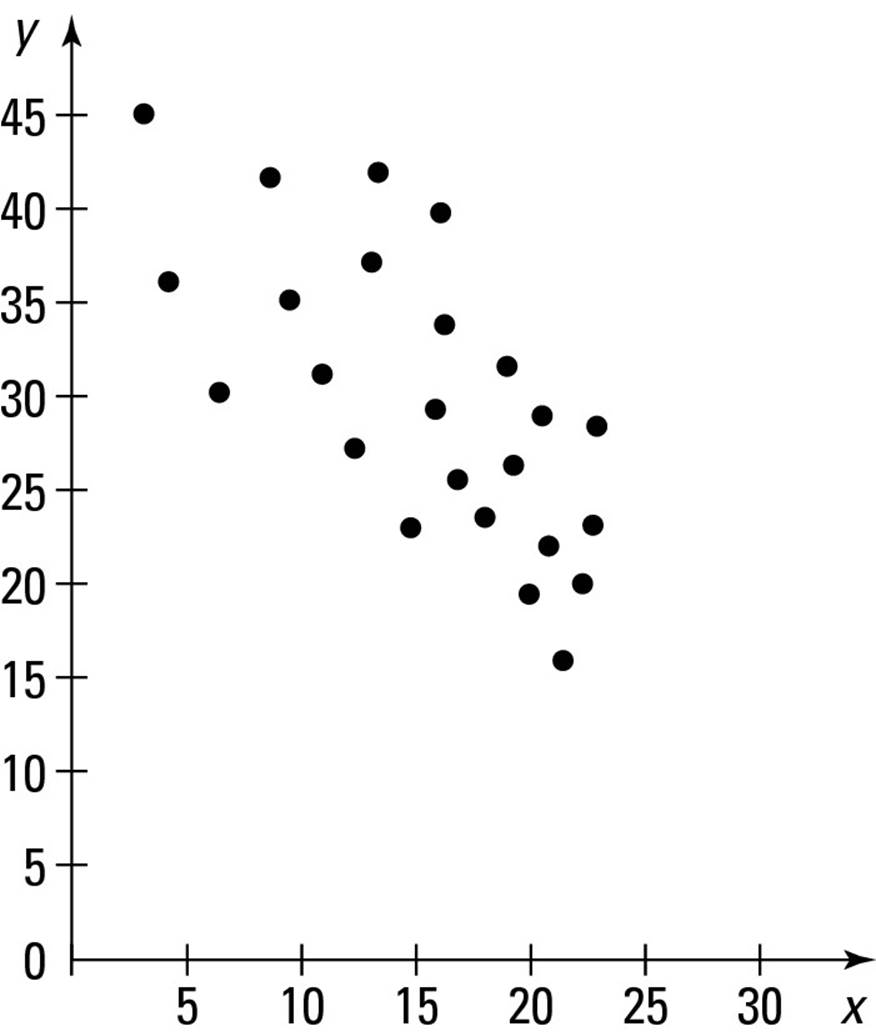
For the following data set, the line of best fit would have a slope that is closest to
(A) –2
(B) –1
(C) 0
(D) 1
(E) 2
The correct answer is (A). Because the data moves downward, it must be (A) or (B). If you look at the top left point, you can estimate its coordinates as (5, 45). The bottom right point
is around (20, 15). The slope of the line connecting these points would be ![]() .
.
Multiple graphs
Some questions use two graphs in one problem. No need to fret! I’m here to help you through the art of answering multiple-graph questions. To get started, run your eyeballs over the two graphs that follow.
You must read these graphs together. The second graph is a bar graph going from 0 to 100 percent. Read the graph by subtracting to find the appropriate percentage. For example, in 1990, “Grandparents won’t donate a building” begins at 20 percent and goes to 50 percent, a difference of 30 percent. You’ve fallen into a trap if you say that “Grandparents won’t donate a building” was 50 percent. In 1993, “Just felt like it” goes from 80 percent to 100 percent, which means it was actually 20 percent.
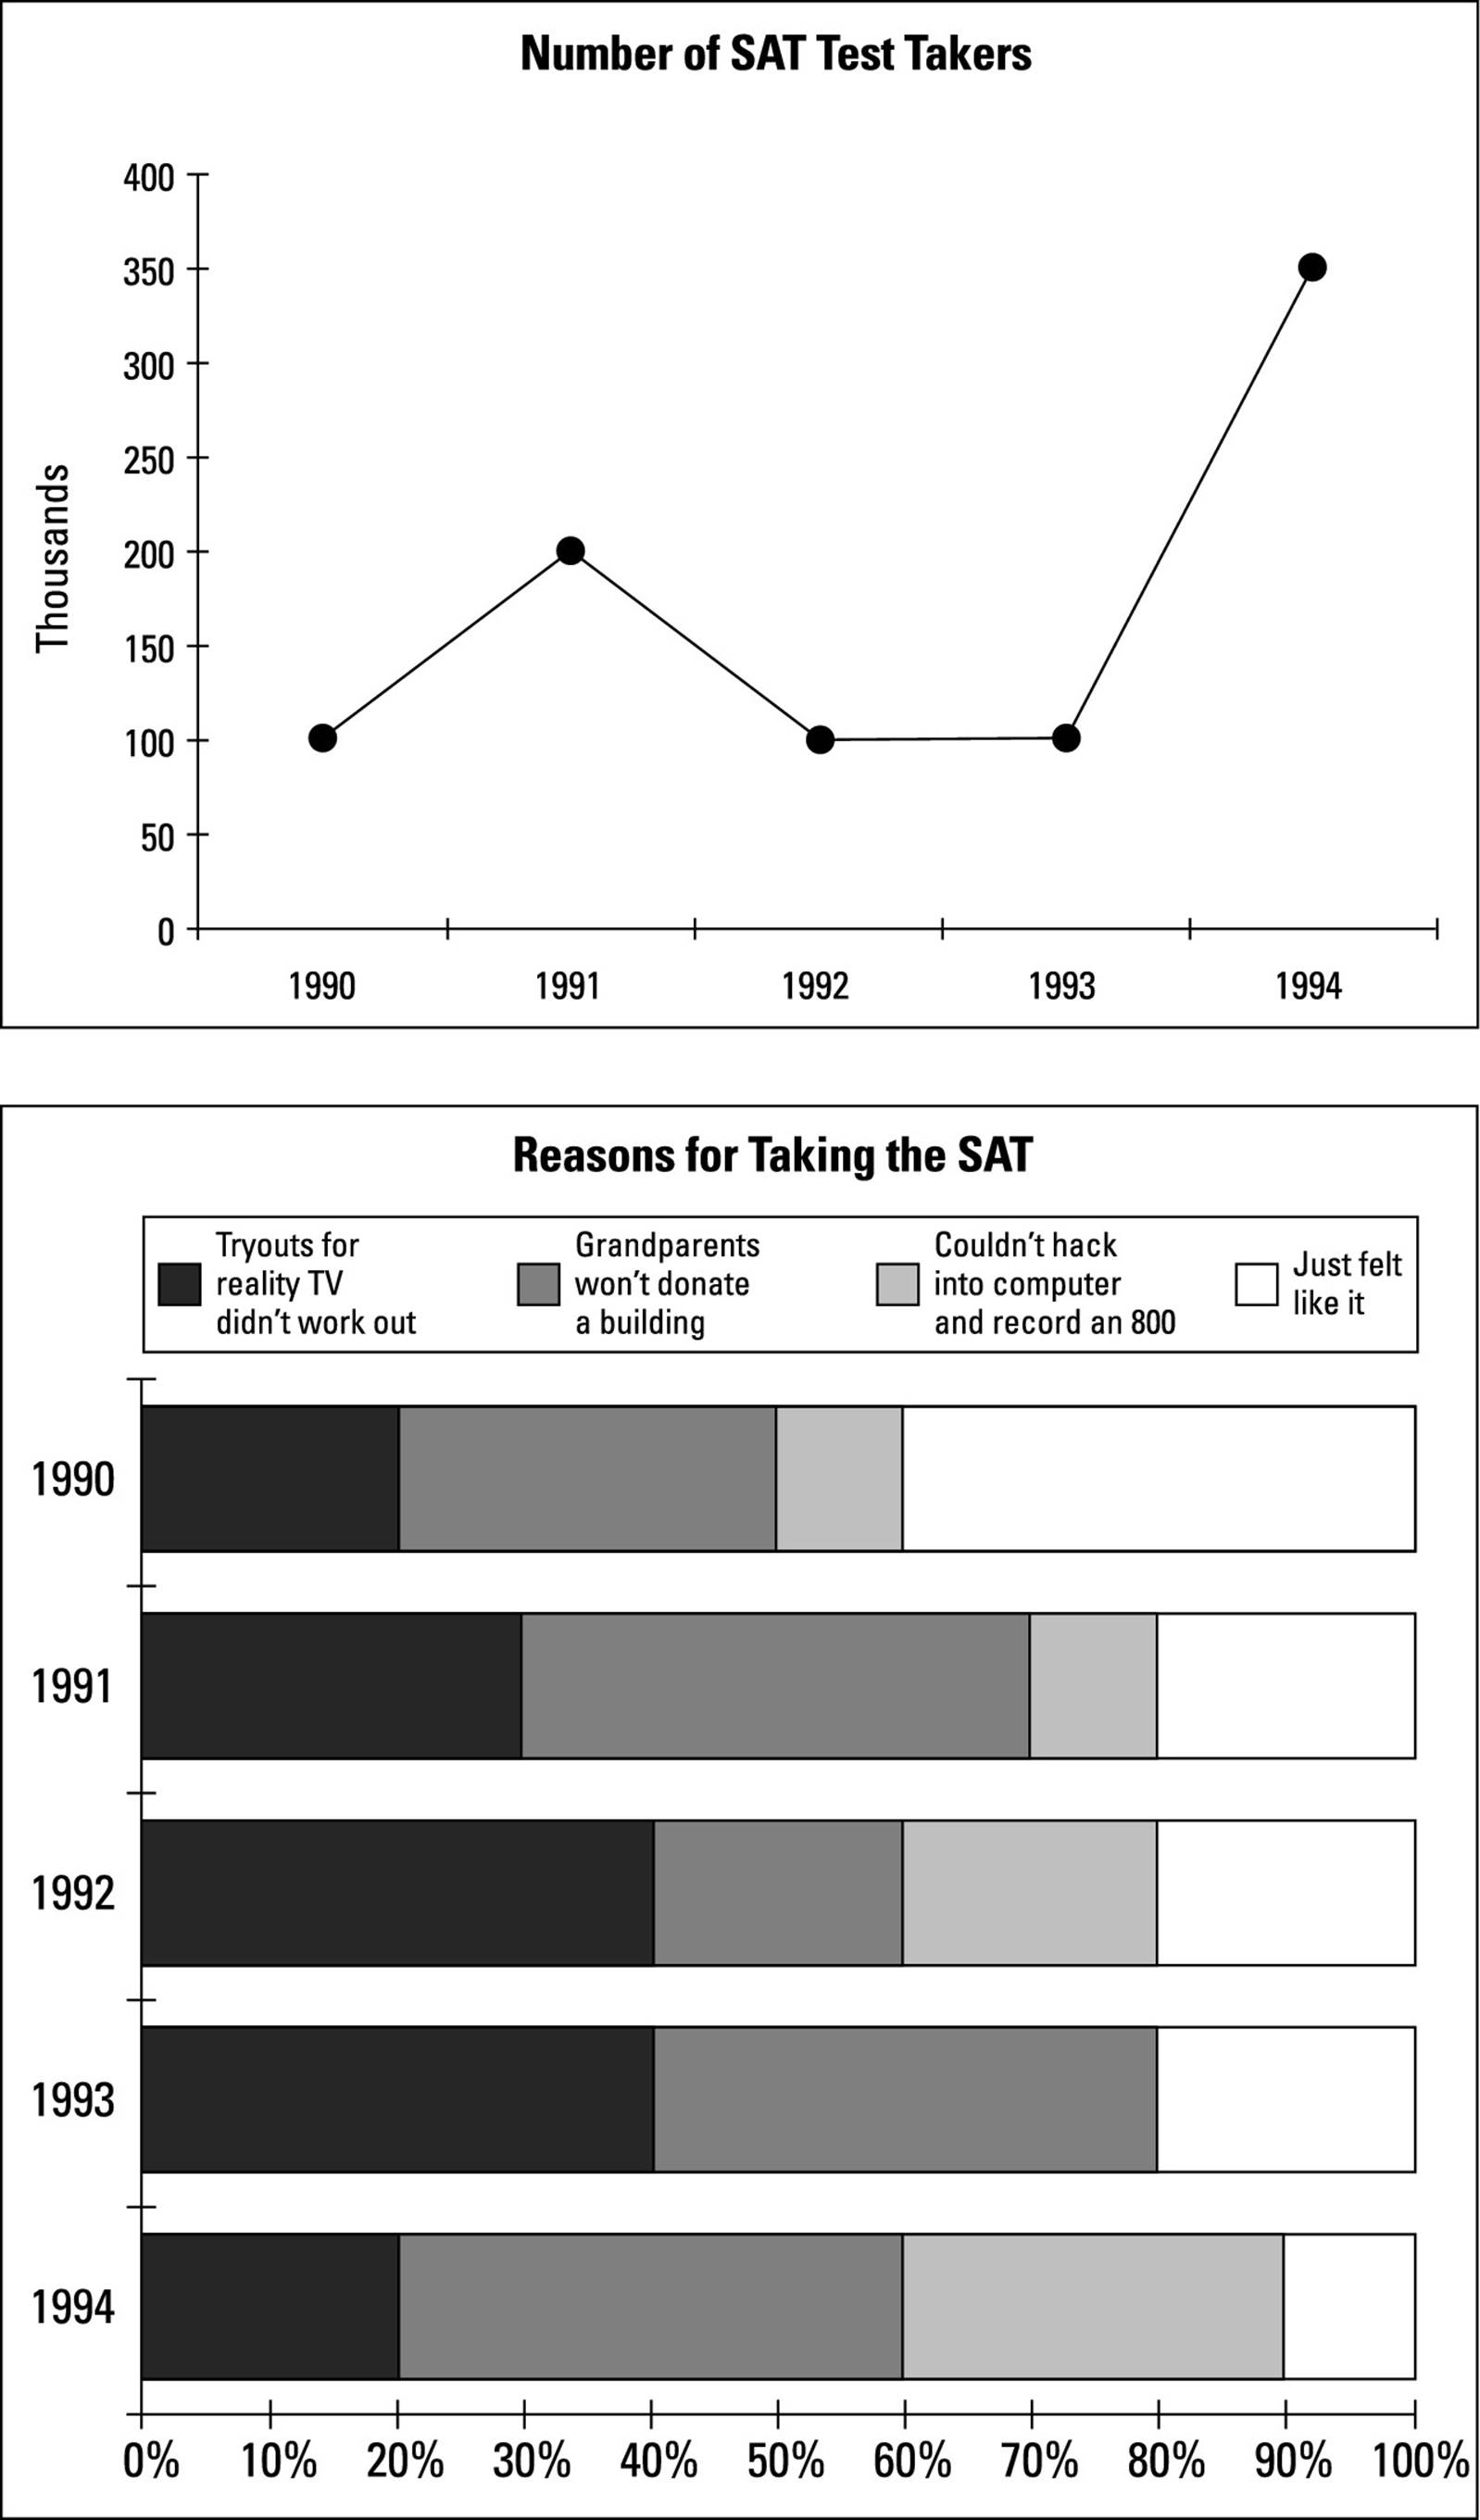
The first graph gives you the number of SAT test takers in thousands. (By the way, I’m not using real statistics from the makers of the SAT.) Be sure to look at the labels of the axes. For example, Thousands along the side axis tells you that in 1990, there weren’t 100 test takers but 100,000. Using the two graphs together, you can find out the number of test takers who took the SAT for a particular reason. For example, in 1991, 200,000 students took the test. Also in 1991, “Couldn’t hack into computer and record an 800” (from 70 to 80, or 10 percent) made up 10 percent of the reasons for taking the SAT. Multiply 10 percent or 0.10 × 200,000 = 20,000 test takers.
Ready to try some practice questions? On the test, you usually encounter three to five questions about a particular graph. Answer the following question based on the two practice graphs that deal with SAT test takers and appear earlier in this section.
The number of students who took the SAT in 1994 because their grandparents wouldn’t donate a building was how much greater than the number of students who took the SAT in 1992 because they couldn’t hack into the computer and record an 800?
(A) 250,000
(B) 140,000
(C) 120,000
(D) 100,000
(E) 20,000
The answer is (C). In 1994, “Grandparents won’t donate a building” accounted for 40 percent of test-taking reasons (from 20 to 60). Because 1994 had 350,000 test takers, multiply 0.40 × 350,000 = 140,000. In 1992, “Couldn’t hack into computer and record an 800” counted for 20 percent of test-taking reasons (60 to 80). In 1992, 100,000 students took the test. Multiply 0.20 × 100,000 = 20,000. The correct answer is 140,000 – 20,000 = 120,000, or (C).
Analyzing Logic Questions
The SAT occasionally tosses you a logic question, disguised as a simple math question. This type of question has two parts. First is the set of statements or conditions, sometimes called the facts. These statements describe the relationship between or among people, items, or events. You may, for example, be given statements about students at a school and then be asked which ones can be assigned to the same classes. You may be told facts about events that can happen on certain days of the week or about what different combinations of items are possible.
A logic question often takes a long time to solve. Make the decision whether you have the time — and the patience! — to do it properly. If not, skip the question and come back to it later, if you can. Don’t rush yourself.
Before you start doodling to solve a logic problem, be sure you know all the people or items involved. Make a “program” of all the players by writing down the pool of people or events. For example, if the question talks about five teachers, Mahaffey, Negy, O’Leary, Plotnitz, and Quivera, use initials and jot down M, N, O, P, and Q on the test booklet.
What not to call the umpire
Mathematicians love baseball — or at least baseball stats. So take a moment to rest from your math labors and watch your favorite team. You can call the ump disinterested (fair) but not uninterested (bored out of his skull). Unless you want to go down on strikes, also avoid calling himpusillanimous (cowardly) and mendacious (lying). Whatever you think of the pay scale, stay away from mercenary (in it only for the money, as opposed to in it for the love of the game) and partial or partisan (taking sides). Nor would an umpire appreciate being labeled iniquitous (evil) or intemperate (excessive, extreme).
To gain the ump’s favor, try calling him judicious (showing good judgment) and discerning (sharp, perceptive). Describing the umpire’s calls as sonorous (deep and pleasant in sound) may also get you to first base.
Next, use a diagram to show the relationship between people or events. Here are a few of the most common diagrams.
![]() Calendar: Draw a simple calendar and fill in the events that happen on particular days.
Calendar: Draw a simple calendar and fill in the events that happen on particular days.
![]() Ordering or sequencing: You may have a relationship problem in which some people are taller or heavier than others. Write a line of people, with A above B if A is taller than B, C at the bottom if she is the shortest, and so on.
Ordering or sequencing: You may have a relationship problem in which some people are taller or heavier than others. Write a line of people, with A above B if A is taller than B, C at the bottom if she is the shortest, and so on.
![]() Grouping or membership: This problem asks you which items or people could belong to which group. For example, membership in a club may require four out of five characteristics. Often this type of question doesn’t require a graph, but it does require a lot of if . . . thenstatements, such as “If A is in the group, then B isn’t.”
Grouping or membership: This problem asks you which items or people could belong to which group. For example, membership in a club may require four out of five characteristics. Often this type of question doesn’t require a graph, but it does require a lot of if . . . thenstatements, such as “If A is in the group, then B isn’t.”
Try your hand at this logic-based example:
Five spices — lemon pepper, marjoram, nutmeg, oregano, and paprika — are aligned next to one another between the left and right sides of a kitchen cabinet. Their arrangement must conform to the following conditions:
The marjoram is immediately to the right of the paprika.
The oregano is either all the way to the left or second from the left.
The lemon pepper is farther left than the nutmeg.
Which of the following could not be true?
(A) The paprika is second from the left.
(B) The marjoram is to the right of the lemon pepper.
(C) The nutmeg is exactly in the middle.
(D) The lemon pepper is exactly in the middle.
(E) The nutmeg is all the way to the right.
The answer is (D). To help keep track of the information, write out initials for the roster of spices — L, M, N, O, and P — and make five simple dashes to represent the five positions of the spices:
___ ___ ___ ___ ___
The easiest condition to accommodate is the one that indicates that the oregano must be first or second from the left. Draw these two possibilities:
O ___ ___ ___ ___
___ O ___ ___ ___
The next thing to note is that the paprika and marjoram must always move together. So test out the answer choices, making sure to also fulfill the third condition. Choice (A) is fine, because you can write O, P, M, L, N and meet all conditions. Choice (B) also works, because you can write O, L, P, M, N. And for (C), you can write either O, L, N, P, M or L, O, N, P, M.
Choice (D) is no good, though. If L is in the middle, you have to put P and M to its right because they always travel together. But that doesn’t leave room to put N to the right of L, so you can’t fulfill the third condition. Take a moment to check that (E) works. (It does, with one option being O, L, P, M, N.) Choice (D) is the only option that doesn’t work, so that’s your answer.