SAT 2016
CHAPTER 8
The SAT Math Test: Problem Solving and Data Analysis
1. Working with Data
2. Working with Rates, Ratios, Percentages, and Proportions
3. Working with Tables of Data
4. Working with Graphs of Data
The SAT Math: Problem Solving and Data Analysis
Why is problem-solving and data analysis important on the SAT Math test?
About 26% (15 out of 58 points) of the SAT Math questions fall under the category of Problem Solving and Data Analysis. Questions in this category test your ability to
create a representation of a problem, consider the units involved, attend to the meaning of quantities, and [apply reasoning about] ratios, rates, and proportional relationships.
They also assess your skill in
interpreting and synthesizing data, [as well as identifying] quantitative measures of center, the overall pattern, and any striking deviations from the overall pattern in different data sets.
The specific topics include
• using rates, ratios, and proportional relationships to solve problems
• evaluating and analyzing data gathering methods
• calculate and use statistics of “central tendency” like mean, median, and mode
• basic measures of data “spread” such as standard deviation, range, and confidence intervals
• solving problems concerning percentages and percent change
• analyzing scatterplots, pie graphs, tables, histograms, and other graphs
• exploring linear, quadratic, and exponential relationships in data
How are these skills used?
Analyzing and drawing inferences from data are core skills not only in mathematics and the physical sciences, but also in social sciences such as psychology, sociology, and economics. Since these subjects constitute a substantial portion of any liberal arts curriculum, colleges consider these to be essential college preparatory skills.
Sound intimidating? It”s not.
If you take the time to master the four core skills presented in these 16 lessons, you will gain the knowledge and practice you need to master SAT Math problem-solving and data analysis questions.
Skill 1: Working with Data
Lesson 1: Working with averages (arithmetic means)
The average (arithmetic mean) of four numbers is 15. If one of the numbers is 18, what is the average (arithmetic mean) of the remaining three numbers?
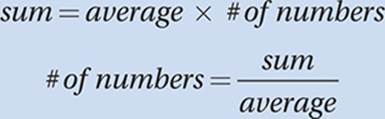
The average (arithmetic mean) of any set of numbers is calculated with the formula
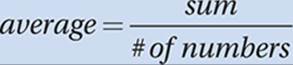
But it is helpful to notice that this form can take two other forms:
(Medium) In this problem, we are given the average of the set and the number of numbers in the set. So we can use the formula sum = average × # of numbers to find the sum of these numbers: 15 × 4 = 60. If one of these numbers is 18, then the sum of the remaining three numbers is 60 − 18 = 42. Using the first formula above gives us an average of 42/3 = 14.
Ms. Aguila”s class, which has 20 students, scored an average of 90% on a test. Mr. Bowle”s class, which has 30 students, scored an average of 80% on the same test. What was the combined average score for the two classes? (Disregard the % symbol when gridding. For instance, enter 74% as 74.)
(Medium) Can we just take the average of the scores for the two classes, and say the overall average is (90 + 80)/2 = 85? No, because there are more students in the second class, so we can”t “weigh” the two classes equally. Using the formula above we can calculate the sum of all of the scores in both classes. In Ms. Aguila”s class, the sum of the scores is 90 × 20 = 1,800, and the sum of the scores in Mr. Bowe”s class is 80 × 30 = 2,400. Therefore, the sum of all of the scores in the two classes combined is 1,800 + 2,400 = 4,200. Since there are 50 students altogether in the two classes, the combined average is 4,200/50 = 84.
Lesson 2: Working with medians and modes
The median of 1, 6, 8, and k is 5. What is the average (arithmetic mean) of these four numbers?
The medianof any set of numbers is the number that divides the ordered setinto two equal sets. In other words, half of the numbers should be less than or equal tothe median, and half the numbers should be greater than or equal tothe median. To find a median,
1. Put the numbers in increasing (or decreasing) order.
2. If there are an odd number of numbers, the median is the middle number.
3. If there are an even number of numbers, the median is the average of the two middle numbers.
(Medium) Using this definition we can find the value of k. The tricky part is step 1, since we don”t know where k should be when we put the numbers in order. Clearly, however, there are only four possibilities to consider.
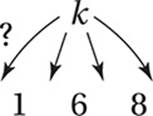
If k is the least of these numbers, then the correct ordering is k, 1, 6, 8. Since there are an even number of numbers, the median is the average of the middle two: (1 + 6)/2 = 3.5. But this contradicts the given fact that the median is 5, so that doesn”t work. Putting k in the next slot gives us an order of 1, k, 6, 8. In this case, the median would be (k + 6)/2.
Multiply by 2:
k + 6 = 10
Subtract 6:
k = 4
Notice that this confirms our assumption that k is between 1 and 6, so k must equal 4. Now we must find the average of these four numbers: (1 + 4 + 6 + 8)/2 = 19/2 = 9.5.
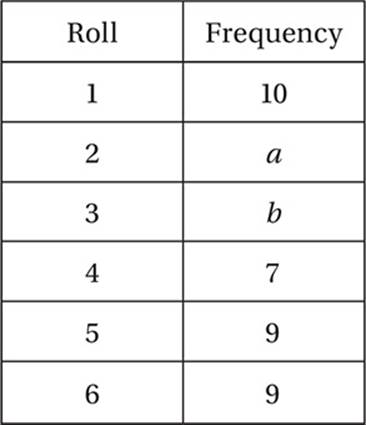
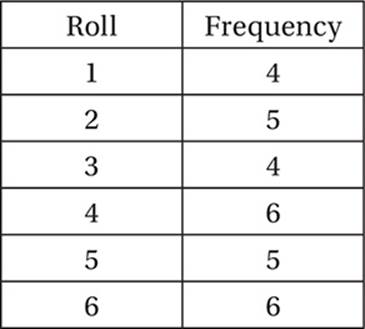
The table above shows the results of 50 rolls of a die, with two missing values labeled a and b. If the mode of these 50 rolls is 2, what is the greatest possible average (arithmetic mean) value of these rolls?
The mode of a set of numbers is the number that appears the most frequently. This means that not every set of numbers has a mode. For instance, in the set 1, 1, 2, 3, 4, the mode is 1, but the set 1, 2, 3, 4 does not have a mode, because every numbers occurs once.
(Hard) This data set has 50 numbers, each representing a roll of a die. If the mode is 2, then 2 is the most frequent roll. Since the table above shows that the highest known frequency is 10 (for a roll of 1), then a (the number of times a 2 was rolled) must be at least 11. We also know that the total number of rolls is 50, so 10 + a + b + 7 + 9 + 9 = 50, and therefore a + b = 15. The question asks us to find the greatest possible average of these rolls, so we want to maximize the sum of all of the rolls. This means that we want b (the number of times a 3 was rolled) to be as great as possible. Since b = 15 − a, then the greatest b can be is 15 − 11 = 4. Therefore a = 11 and b = 4. Now we have to find the average of these 50 numbers: [(1)(10) + (2)(11) + (3)(4) + (4)(7) + (5)(9) + (6)(9)]/50 = (10 + 22 + 12 + 28 + 45 + 54)/50 = 3.42.
Lesson 3: Understanding data spread
The SAT Math test may occasionally ask you about the “spread” of a set of data. You will NOThave to calculate technical statistics like variance, standard deviation, or margin of error, but you mightbe asked to answer more basic questions about the “spread” of a set of data, as in the questions below.
The “range” of a set of data is defined as the absolute difference between the least value and the greatest value in the set. If five positive integers have an average (arithmetic mean) of 10, what is the greatest possible “range” of this set?
(Medium-hard) If five numbers have an average of 10, then their sum must be 5 × 10 = 50. If we want the greatest possible “range,” then we must maximize one of these numbers by minimizing the sum of the other numbers. Since the smallest positive integer is 1, we can minimize the sum of the other four numbers by setting them all equal to 1. This gives us 1 + 1 + 1 + 1 + x = 50, so x = 46. This gives us a maximum “range” of 46 − 1 = 45.
The “absolute deviation” of a number in a set is the absolute difference between that number and the average (arithmetic mean) of the set. The “average absolute deviation” of a set is the average (arithmetic mean) of all of the absolute deviations in the set. Which of the following sets has the greatest “average absolute deviation?”
A) 2, 2, 2, 2
B) 2, 3, 4, 5
C) 4, 4, 5, 5
D) 4, 4, 4, 5
(Medium) When a question introduces a new term, read its definition carefully—several times, if necessary. This question gives us two new terms. To understand these terms, let”s apply them to a simple set of numbers, such as the set in choice (A). The average of this set is 2; therefore, the “absolute deviation” of each of these numbers is its “absolute difference” from 2, which is 0 for each number. The “average absolute deviation” of the entire set is defined as the average of these “absolute deviations,” which is, of course, (0 + 0 + 0 + 0)/4 = 0.
Notice that the “average absolute deviation” of a number set is a measure of “spread.” Since the numbers in (A) are bunched up as tightly as possible, their “average absolute deviation” is 0. Now let”s look at the remaining choices. Which seems to have the greatest “spread?” Once you”ve made your guess, do the calculations and see if you”re right. For confirmation, you should find that the “average absolute deviations” are (A) 0, (B) 1, (C) 0.5, and (D) 0.375. Therefore, the correct answer is (B).
Lesson 4: Variations and drawing inferences from data
The variables x and y vary directly if they have a constant ratio, that is,
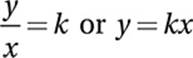 (where k is a constant)
The variables x and y vary inversely if they have a constant product, that is,
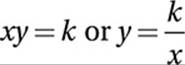 (where k is a constant)
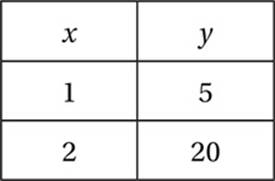
Given the ordered pairs in the table above, which of the following could be true?
A) y varies directly as x
B) y varies inversely as x
C) y varies directly as the square of x
D) y varies inversely as the square of x
(Medium-hard) Using the definitions above, we can see whether y and x vary directly or inversely. Do they have a constant ratio? No: 5/1 ≠ 20/2. Therefore, they do not vary directly and (A) is incorrect. Do they have a constant product? No: 1 × 5 ≠ 2 × 20. Therefore, they do not vary inversely, and (B) is incorrect. To check (C), we must ask: do y and x2 have a constant ratio? Yes: 5/(1)2 = 20/(2)2 = 5, therefore the correct answer is (C).
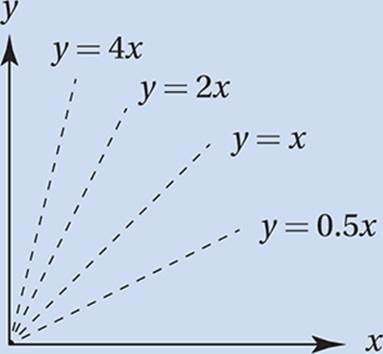
If y varies directly as x, then the graph of their relation in the xy-plane is a line through the origin:
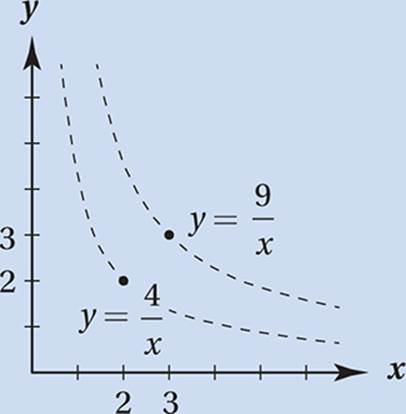
If y varies inversely as x, then the graph of their relation in the xy-plane is a hyperbola that approaches, but does not touch, thex-andy-axes:
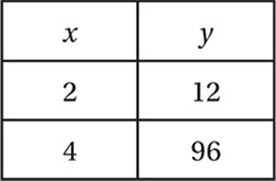
The variables x and y are related by an equation of the form y = Axn where A and n are both positive real numbers. Based on the data in the table above, what is the value of y when x = 3?
A) 40.5
B) 46.0
C) 54.0
D) 64.0
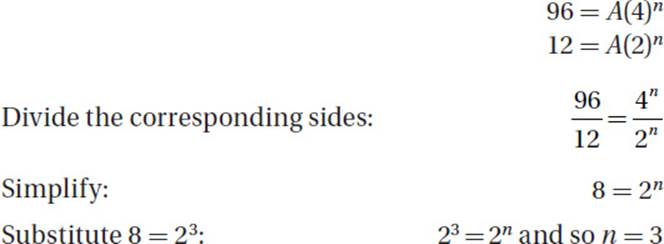
(Medium) In order to find the value of y when x = 3, we must find the specific equation relating x and y. We can find the values of A and n in the equation y = Axn by first plugging in the values from the table. Plugging in the first ordered pair gives us 12 = A(2)n and plugging in the second ordered pair gives us 96 = A(4)n.
(Notice that this means that y varies directly as x3.)
Substitute n = 3 into either
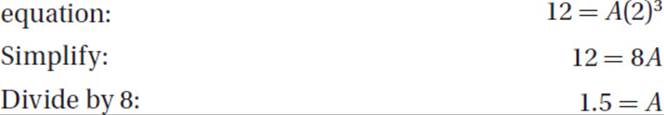
Therefore, the equation that relates x and y is y = 1.5x3. Finally, we find y when x = 3 by substituting into the equation: y = 1.5(3)3 = 1.5(27) = 40.5, so the correct answer is (A).
Exercise Set 1 (No Calculator)
1
The “range” of a set of data is defined as the absolute difference between the least value and the greatest value in the set. Four positive integers have an average (arithmetic mean) of 7.5.
a. What is the greatest possible range of this set?
b. What is the least possible range of this set?
2
If the median of 2, 4, 6, and b is 4.2, what is the average (arithmetic mean) of these four numbers?
3
The average (arithmetic mean) of 2, 5, 8 and k is 0. What is the median of these numbers?
4
A set of numbers has a sum of 48 and an average of 6. How many numbers are in the set?
5
If the average (arithmetic mean) of 4 and x is equal to the average (arithmetic mean) of 2, 8, and x, what is the value of x?
6
The median of a set of 22 consecutive even integers is 25. What is the largest number in the set?
7
If p varies inversely as q and p = 4 when q = 6, the which of the following is another solution for p and q?
A) p = 8 and q = 12
B) p = 8 and q = 10
C) p = 12 and q = 1
D) p = 12 and q = 2
8
A set of n numbers has an average (arithmetic mean) of 3k and a sum of 12m, where k and m are both positive. Which of the following is equivalent to n?
A) ![]()
B) ![]()
C) ![]()
D) ![]()
9
If y varies inversely as the square of x, then when x is multiplied by 4, y will be
A) divided by 16
B) divided by 2
C) multiplied by 2
D) multiplied by 16
10
Let f(x, y) = Ax2y3 where A is a constant. If f(a, b) = 10, what is the value of f(2a, 2b)?
A) 100
B) 260
C) 320
D) 500
11
A set of four integers has a mode of 7 and a median of 4. What is the greatest possible average (arithmetic mean) of this set?
A) 3.50
B) 3.75
C) 4.00
D) 4.25
Exercise Set 1 (Calculator)
12
Four positive integers have a mode of 4 and a median of 3. What is their sum?
13
Five different integers have an average (arithmetic mean) of 10. If none is less than 5, what is the greatest possible value of one of these integers?
14
If b varies inversely as a, and b = 0.5 when a = 32, then for how many ordered pairs (a, b) are a and b both positive integers?
15
The median of 11 consecutive integers is 28. What is the least of these integers?
16
If y = Ax3 and y = 108 when x = 3, then for what value of x does y = 62.5?
17
A set of four positive integers has a median of 2 and a mode of 2. If the average (arithmetic mean) of this set is 3, what is the largest possible number in the set?
18
If y varies inversely as x and the graph of their relation in the xy-plane passes through the point (2, 15), what is the value of y when x = 4?
19
A six-sided die was rolled 30 times and the results tabulated above. What is the difference between the average (arithmetic mean) of the rolls and the median of the rolls?
A) 0.1
B) 0.2
C) 0.3
D) 0.4
20
If y varies inversely as the square of x, and y = 4 when x = 2, then what is the value of y when x = 3?
A) ![]()
B) ![]()
C) 3
D) 9
21
At a fixed temperature, the volume of a sample of gas varies inversely as the pressure of the gas. If the pressure of a sample of gas at a fixed temperature is increased by 50%, by what percent is the volume decreased?
A) 25%
B) 
C) 50%
D) 
22
If the graph of y = f(x) in the xy-plane contains the points (4, 3) and (16, 6), which of the following could be true?
A) y varies directly as the square of x
B) y varies inversely as the square of x
C) y varies directly as the square root of x
D) y varies inversely as the square root of x
EXERCISE SET 1 ANSWER KEY
No Calculator
1a. 26 If the average of 4 numbers is 7.5, they must have a sum of 4 × 7.5 = 30. To maximize the range, we must maximize one of the numbers by minimizing the other 3 by setting them all equal to 1 (the smallest positive integer). The numbers therefore are 1, 1, 1, and 27, and the range is 27 − 1 = 26.
1b. 1 To minimize the range, we “cluster” the numbers as closely together as possible. The tightest cluster of integers with a sum of 30 is 7, 7, 8, and 8, which gives a range of 8 − 7 = 1.
2. 4.1 If the set contains four numbers, its median is the average of the middle two numbers, so the middle two numbers must have a sum of (2)(4.2) = 8.4. Thus the four numbers must be 2, 4, 4.4, and 6. (Notice that the question did not say that all numbers were integers.) The average of these is 16.4/4 = 4.1.
3. 3.5 If the average of these numbers is 0, their sum must be (4)(0) = 0, and therefore k = −15 and the numbers, in increasing order, are −15, 2, 5, and 8. The median is (2 + 5)/2 = 3.5.
4. 8 6 = 48/n, so n = 8.
5. 8
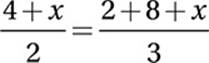
Cross-multiply:
12 + 3x = 20 + 2x
Subtract 2x and 12:
x = 8
6. 46 The median divides the set into two equal parts, so 11 of these numbers must be less than 25 and 11 must be greater than 25. Since they are consecutive even integers, the 11 numbers above the median must be 26, 28, 30, 32, . . . 46.
7. D If p and q vary inversely, their product is a constant. 4 × 6 = 24, and the only other pair with a product equal to 24 is (D) 12 and 2.
8. A n = sum/average = 12m/3k = 4m/k
9. A The equation relating x and y is y = k/x2. If x = 1, then y = k. If x is multiplied by 4, then x = 4 and y = k/16, so y has been divided by 16.
10. C f(a, b) = Aa2b3 = 10. f(2a, 2b) = A(2a)2(2b)3 = 32(Aa2b3) = 32(10) = 320.
11. B If this set has a mode of 7, then at least two of the numbers are 7. If the median is 4, then the two middle numbers must have a sum of (2)(4) = 8. Therefore the two middle numbers are 1 and 7, and the sequence must be n, 1, 7, 7. To maximize the average, we must maximize n, but ncan”t be 1, because then the set would not have a mode of 7. It must be the next lower integer, 0, and the average is (0 + 1 + 7 + 7)/4 = 3.75.
Calculator
12. 11 The only four numbers that satisfy these conditions are 1, 2, 4, and 4.
13. 24 If the average of five numbers is 10, their sum is 5 × 10 = 50. To maximize one, we must minimize the sum of the other four. If none is less than five, and all are different integers, they are 5, 6, 7, 8, and 24.
14. 5 If the variables vary inversely, their product is constant. (0.5)(32) = 16. The only pairs of positive integers with a product of 16 are (1, 16), (2, 8), (4, 4), (8, 2), and (16, 1).
15. 23 If the middle number is 28, there are five numbers less than 28, and five greater. Since they are consecutive integers, the least is 28 − 5 = 23.
16. 2.5 Since 108 = A(3)3, A = 4, so if 62.5 = 4x3, x = 2.5.
17. 7 At least two of the integers must be 2 and none can be less than 1. If the sum must be 4 × 3 = 12, the set including the largest possible number is 1, 2, 2, and 7.
18. 7.5 The product of x and y is 2 × 15 = 30, so y = 30/4 = 7.5.
19. C Average = (1 × 4 + 2 × 5 + 3 × 4 + 4 × 6 + 5 × 5 + 6 × 6)/30 = 3.7. Median = average of 15th and 16th roll: (4 + 4)/2 = 4. 4 − 3.7 = 0.3.
20. A y and x2 must have a constant product of 4 × 22 = 16. Therefore, y = 16/9.
21. B Pick values for the original pressure and volume, such as 2 and 3. If they vary inversely, their product is the constant 2 × 3 = 6. If the pressure is increased by 50%, it becomes (1.5)(2) = 3, and so the volume becomes 6/3 = 2, a change of −33 1/3%.
22. C For both ordered pairs, ![]() is a constant:
is a constant:  , so y is directly proportional to the square root of x.