SAT 2016
CHAPTER 9
THE SAT MATH: ADVANCED MATHEMATICS
1. Understanding Functions
2. Working with Quadratics and Other Polynomials
3. Working with Exponentials and Radicals
4. Working with Rational Expressions

The SAT Math: Advanced Mathematics
Why are the Advanced Mathematics topics important on the SAT Math test?
About 27% (16 out of 58 points) of the SAT Math questions are Advanced Mathematics questions. Questions in this category are about
understanding of the structure of expressions and the ability to analyze, manipulate, and rewrite these expressions. This includes an understanding of the key parts of expressions, such as terms, factors, and coefficients, and the ability to interpret complicated expressions made up of these components.
It will also assess your skill in
rewriting expressions, identifying equivalent forms of expressions, and understanding the purpose of different forms.
The specific topics include
• solving, graphing, and analyzing quadratic equations
• solving equations with radicals that may include extraneous solutions
• solving systems including linear and quadratic equations
• creating exponential or quadratic functions from their properties
• calculating with and simplifying rational expressions
• analyzing radicals and exponentials with rational exponents
• creating equivalent forms of expressions to reveal their properties
• working with compositions and transformations of functions
• analyzing higher-order polynomial functions, particularly in terms of their factors and zeros
How is it used?
Fluency in these topics in advanced math is essential to success in postsecondary mathematics, science, engineering, and technology. Since these subjects constitute a portion of any liberal arts curriculum, and a substantial portion of any STEM (science, technology, engineering, or mathematics) program, colleges consider these to be essential college preparatory skills for potential STEM majors.
Sound intimidating? It”s not.
If you take the time to master the four core skills presented in these 14 lessons, you will gain the knowledge and practice you need to master SAT Advanced Math questions.
Skill 1: Understanding Functions
Lesson 1: What is a function?
A function is just a “recipe” for turning any “input” number into another number, called the “output” number. The input number is usually called x, and the output number is f(x) or y. For instance, the function f(x) = 3x2 + 2 is a three-step recipe for turning any input number, x, into another number, f(x), by the following steps: (1) square x, (2) multiply this result by 3, and (3) add 2 to this result. The final result is called f(x) or y.
If f(2x) = x + 2 for all values of x, which of the following equals f(x)?
A) 
B) 
C) 
D) 2x – 2
(Medium) Let”s use the “function-as-recipe” idea. The equation tells us that f is a function that turns an input of 2x into x + 2. What steps would we need to take to accomplish this?
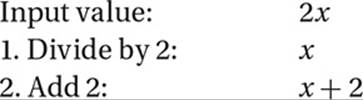
Therefore, f is a two-step function that takes an input, divides it by 2, and then adds 2. Therefore, f(x) equals the result when an input of x is put through the same steps, which yields (B) 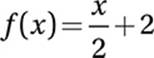 .
.
Another way to think about this problem is to pick a value for x, like x = 1. Substituting this into the given equation gives us f(2(1)) = 1 + 2, or f(2) = 3. Therefore, the correct function must take an input of 2 and turn it into 3. If we substitute x = 2 into all of the choices, we get (A) f(2) = 2, (B) f(2) = 3, (C) f(2) = 0, and (D) f(2) = –1. Clearly, the only function that gives the correct output is (B).
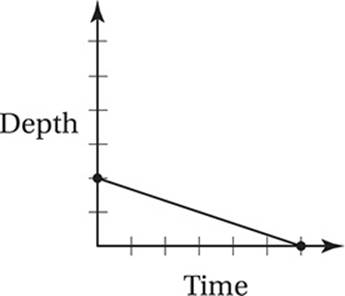
The graph above shows the depth of water in a right cylindrical tank as a function of time as the tank drains. Which of the following represents the graph of the situation in which the tank starts with twice as much water as the original tank had, and the water drains at three times the original rate?
A) 
B) 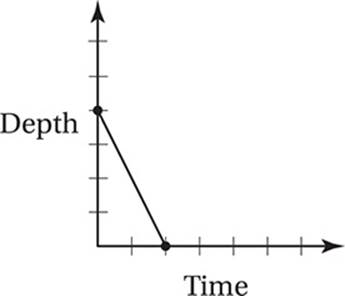
C) 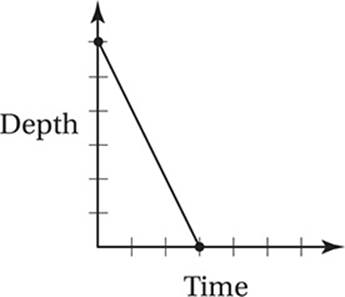
D) 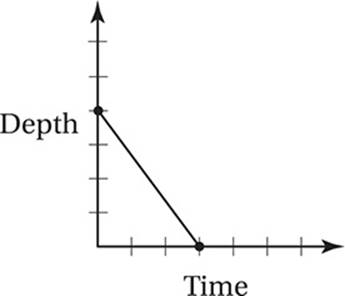
(Medium) Although no increments are shown on the axes (so, for instance, the tick marks on the time axis could indicate minutes, or hours, or days, or any other time unit, and the tick marks on the depth axis could represent meters, or centimeters, or any other depth unit), we do know thatthe point at which the axes cross is the origin, or the point (0, 0). The given graph shows that the tank starts at 2 depth units and drains completely after 6 time units. In other words, the tank drains at 1/3 of a depth unit per time unit. (Remember from Chapter 8 that the slope equals the unit rate of change.) In the new graph, then, the tank should start at a depth of 2 × 2 = 4 depth units, and it should drain at 3 × 1/3 = 1 depth unit per time unit. In other words, it should take 4 time units for the tanks to drain completely. The only graph that shows this correctly is (A).
Lesson 2: Functions as graphs, equations, or tables
Make sure you”re fluent in expressing functions in three ways: as graphs in the xy-plane, equations in functional notation, or tables of ordered pairs. Also, make sure you can go from one format to another. Every input-output (x – y) pair can be represented in any of these three ways. For instance, if the function g turns an input value of –2 into an output value of 4, we can translate this in three ways:
• The graph of y = g(x) in the xy-plane contains the point (–2, 4).
• g(–2) = 4
• In a table of ordered pairs for the function, x = –2 is paired with y = 4.
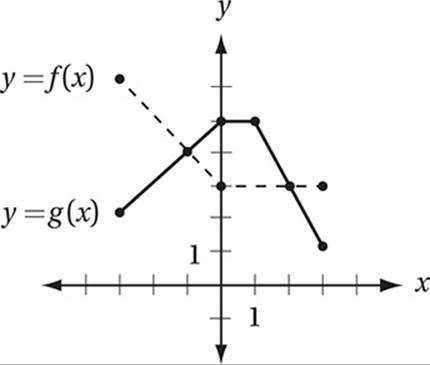
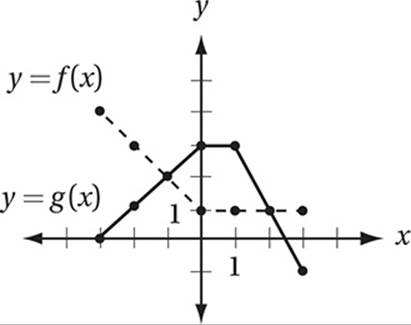
The graphs of functions f and g are shown above for –3 ≤ x ≤ 3. Which of the following describes the set of all x for which f(x) ≤ g(x)?
A) x ≥ –3
B) –3 ≤ x ≤ –1 or 2 ≤ x ≤ 3
C) –1 ≤ x ≤ 2
D) 3 ≤ x ≤ 5
(Easy) The key to this problem is understanding what the statement f(x) ≤ g(x) means. Since f(x) and g(x) are the y-values of the respective functions, f(x) is less than or equal to g(x) wherever the graphs cross or the graph of g(x) is above the graph of f(x). The two graphs cross at the points (–1, 4) and (2, 3), and g(x) is above f(x) at every point in between, so the correct answer is (C) –1 ≤ x ≤ 2.
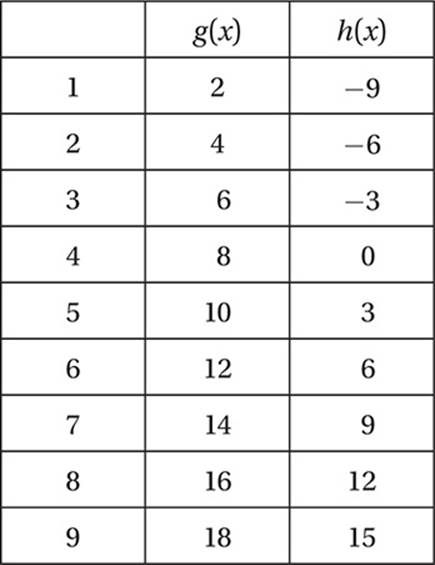
Given the table of values for functions g and h above, for what value of x must g(h(x)) = 6?
A) 2
B) 5
C) 6
D) 12
(Medium-hard) The notation g(h(x)) = 6 means that when the input number, x, is put into the function h, and this result is then placed into function g, the result is 6. Working backward, we should ask: what input to g would yield an output of 6? According to the table, only an input of 3 into gwould yield an output of 6. This means that h(x) = 3. So what input into h would yield an output of 3? Consulting the table again, we can see that g(5) = 3, and therefore x = 5 and the correct answer is (B).
Lesson 3: Compositions and transformations of functions
The notation f(g(x)) indicates the composition of two functions, g and f. The number x is put into the function g and this result is put into the function f and the result is called f(g(x)).
If f(x) = x + 2 and f(g(1)) = 6, which of the following could be g(x)?
A) g(x) = 3x
B) g(x) = x + 3
C) g(x) = x – 3
D) g(x) = 2x + 1
(Medium-hard) The notation f(g(1)) = 6 indicates that the number 1 is placed into function g, then the result is placed into function f, and the result is an output of 6.
Given equation:
f(g(1)) = 6
Use the given definition of f:
g(1) + 2 = 6
Subtract 2:
g(1) = 4
In other words, g is function that gives an output of 4 when its input is 1. The only function among the choices that has this property is (B) g(x) = x + 3.
If f(x) = x2 + 1 and g(f(x)) = 2x2 + 4 for all values of x, which of the following expresses g(x)?
A) g(x) = 2x + 1
B) g(x) = 2x + 2
C) g(x) = 2x + 3
D) g(x) = 2x2 + 1
(Medium-hard) As with the previous question, it helps to use the law of substitution to simplify the problem. By the definition of f, g(f(x)) = g(x2 + 1) = 2x2 + 4. Therefore, the function g turns an input of x2 + 1 into an output of 2x2 + 4. What series of steps would accomplish this?
Starting expression:
x2 + 1
Multiply by 2:
2x2 + 2
Add 2:
2x2 + 4
Therefore, g is a two-step function that takes an input, multiplies it by 2, and adds 2, which is the function in choice (B).
When the function y = g(x) is graphed in the xy-plane, it has a minimum value at the point (1, –2). What is the maximum value of the function h(x) = –3g(x) – 1?
A) 4
B) 5
C) 6
D) 7
(Medium) The graph of y = h(x) = –3g(x) – 1 is the graph of g after it has been stretched vertically by a factor of 3, reflected over the x-axis, and then shifted down 1 unit. This would transform the minimum value point of (1, –2) to a maximum value point on the new graph at (1, –3(–2) – 1) or (1, 5), so the correct answer is (B).
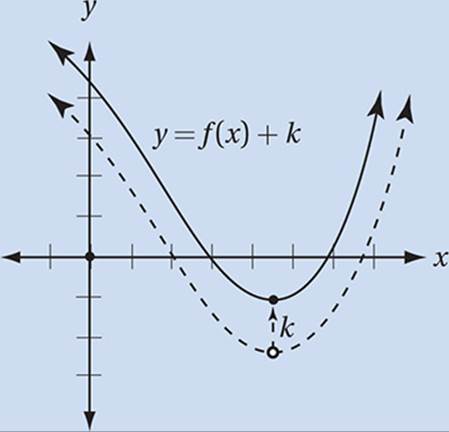
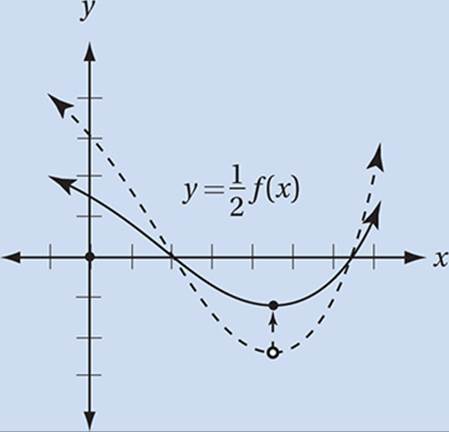
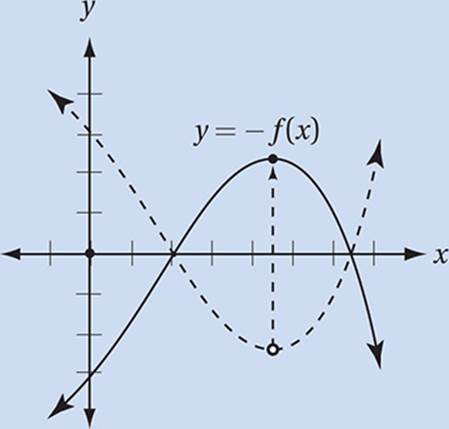
Function Transformations
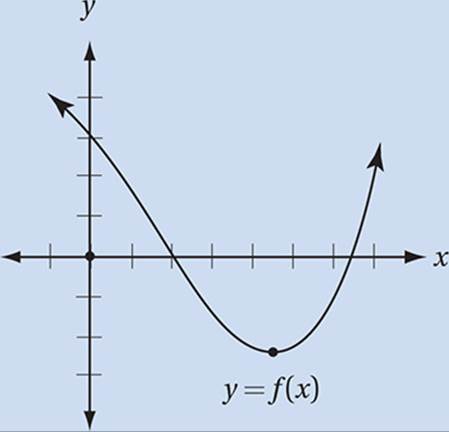
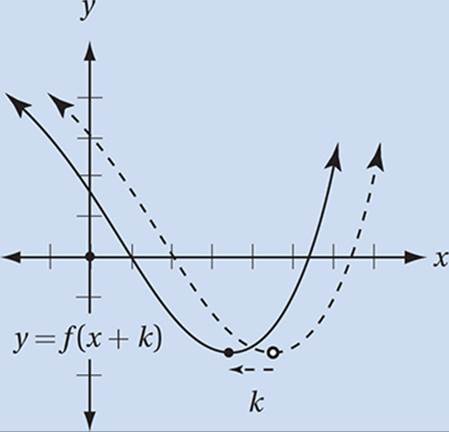
If the function y = f(x) is graphed in the xy-plane (as in the example above), then the following represent transformations of function f.
The graph of y = f(x + k), where k is a positive number, is the graph of y = f(x) shifted left k units.
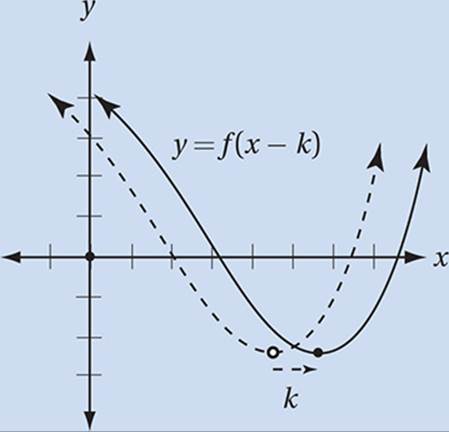
The graph of y = f(x – k), where k is a positive number, is the graph of y = f(x) shifted right k units.
The graph of y = f(x) + k, where k is a positive number, is the graph of y = f(x) shifted up k units.
The graph of y = kf(x) is the graph of y = f(x) stretched vertically by a factor of k (if k > 1) or shrunk vertically by a factor of k (if k < 1).
The graph of y = –f(x) is the graph of y = f(x) reflected over the x-axis.
Exercise Set 1 (Calculator)
1
If f(x) = x2 + x + k, where k is a constant, and f(2) = 10, what is the value of f(–2)?

2
The minimum value of the function y = h(x) corresponds to the point (–3, 2) on the xy-plane. What is the maximum value of g(x) = 6 – h(x + 2)?
3
The function g is defined by the equation g(x) = ax + b, where a and b are constants. If g(1) = 7 and g(3) = 6, what is the value of g(–5)?
4
Let the function h be defined by the equation h(x) = f(g(x)) where f(x) = x2 – 1 and g(x) = x + 5. What is the value of h(2)?
![]()
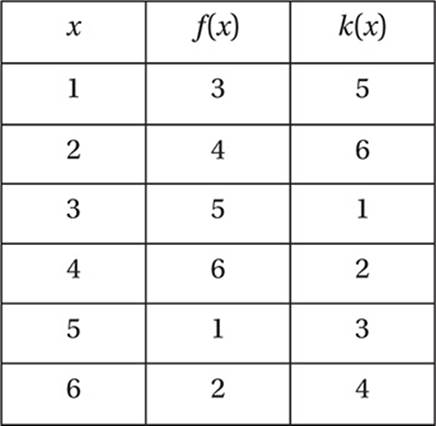
Questions 5–9 refer to the table below.
5
According to the table above, f(3) =
6
According to the table above, f(k(6)) =
7
According to the table above, k(k(6)) =
8
According to the table above, if k(f(x)) = 5, then what is the value of x?
9
Which of the following is true for all values of x indicated in the earlier table?
A) f(k(x)) – k(f(x)) = 0
B) f(k(x)) + k(f(x)) = x
C) f(k(x)) – k(f(x)) = x
D) f(k(x)) + k(f(x)) = 0
![]()
10
If g(x – 1) = x2 + 1, which of the following is equal to g(x)?
A) x2 + 2
B) x2 + 2x
C) x2 + 2x + 1
D) x2 + 2x + 2
11
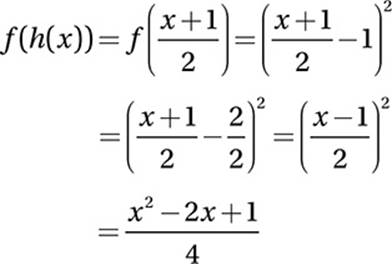
If 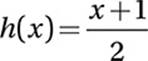 and f(x) = (x – 1)2, then which of the following is equal to f(h(x)) for all x?
A) 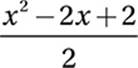
B) 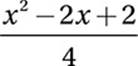
C) 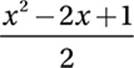
D) 
Exercise Set 1 (No Calculator)
![]()
Questions 12–19 are based on the graph below.
12
What is the value of g(–1)?
13
What is the value of g(f(3))?
14
What is the value of f(g(3))?
15
If g(f(x)) = –1, what is the value of x + 10?
16
If f(k) + g(k) = 0, what is the value of k?
17
If f(a) = g(a), where a < 0, and f(b) = g(b), where b > 0, what is the value of a + b?
18
Let h(x) = f(x) × g(x). What is the maximum value of h(x) if –3 ≤ x ≤ 3?
19
Which of the following graphs represents the function y = f(x) + g(x)?
A) 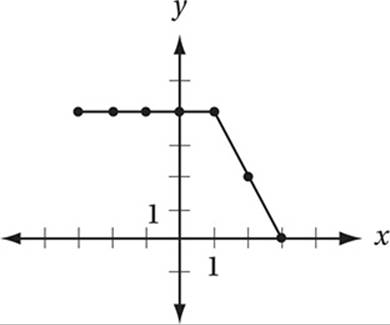
B) 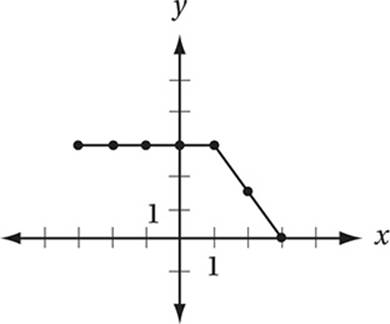
C) 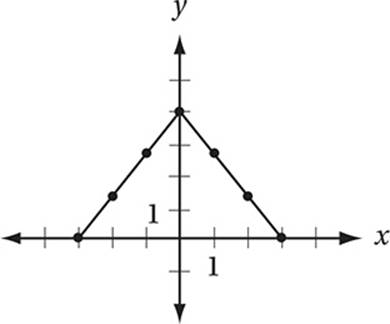
D) 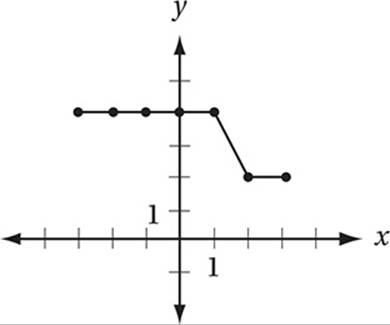
![]()
EXERCISE SET 1 ANSWER KEY
Calculator
1. 6 f(2) = 22 + 2 + k = 10, so 6 + k = 10 and k = 4. Therefore, f(–2) = (–2)2 + (–2) + 4 = 6.
2. 4 The graph of the function g(x) = 6 – h(x + 2) is the graph of h after (1) a shift 2 units to the left, (2) a reflection over the x-axis, and (3) a shift 6 units up. If we perform these transformations on the point (–3, 2), we get the point (–5, 4), and so the maximum value of g is 4 when x = –5.
3. 10
g(3) = a(3) + b =6
g(1) = a(1) + b = 7
Subtract the equations:
2a = –1
Divide by 2:
a = –0.5
Substitute to find b:
–0.5 + b = 7
Add 0.5:b
= 7.5
Therefore
g(x) = –0.5x + 7.5
g(–5) = –0.5(–5) + 7.5 = 10
4. 48
h(2) = f(g(2)) = f(2 + 5) = f(7) = (7)2 – 1 = 48
5. 5
f(3) = 5
6. 6
f(k(6)) = f(4) = 6
7. 2
k(k(6)) = k(4) = 2
8. 5 According to the table, the only input into k that yields an output of 5 is 1. Therefore, f(x) must be 1, and the only input into f that yields an output of 1 is x = 5.
9. A Examination of the table reveals that, for all given values of x, f(g(x)) = x and g(f(x)) = x. (This means that f and k are inverse functions, that is, they “undo” each other.) This implies that f(k(x)) – k(f(x)) = x – x = 0.
10. D One way to approach this question is to pick a new variable, z, such that z = x – 1 and therefore x = z + 1.
Original equation:
g(x – 1) = x2 + 1
Substitute z = x – 1:
g(z) = (z + 1)2 + 1
FOIL:
g(z) = z2 + 2z + 1 + 1
Simplify:
g(z) = z2 + 2z + 2
Therefore
g(x) = x2 + 2x + 2
11. D
No Calculator
12. 2 The graph of g contains the point (–1, 2), therefore g(–1) = 2.
13. 3 The graph of f contains the point (3, 1); therefore, f(3) = 1, and so g(f(3)) = g(1). Since the graph of g contains the point (1, 3), g(1) = 3.
14. 2 The graph of g contains the point (3, –1); therefore, g(3) = –1, and so f(g(3)) = f(–1). Since the graph of f contains the point (–1, 2), f(–1) = 2.
15. 8 The only input to function g that yields an output of –1 is 3. Therefore, if g(f(x)) = –1, f(x) must equal 3. The only input to f that yields an output of 3 is –2, therefore x = –2 and x + 10 = 8.
16. 3 The only input for which f and g give outputs that are opposites is 3, because f(3) = 1 and g(x) = –1.
17. 1 The two points at which the graphs of g and f cross are (–1, 2) and (2, 1). Therefore, a = –1 and b = 2 and so a + b = 1.
18. 4 h(x) = f(x) × g(x) has a maximum value when x = –1, where f(1) × g(1) = 2 × 2 = 4.
19. A To graph y = f(x) + g(x), we must simply “plot points” by choosing values of x and finding the corresponding y-values. For instance, if x = –3, y = f(3) + g(3) = 4 + 0 = 4, so the new graph must contain the point (–3, 4). Continuing in this manner for x = –2, x = –1, and so on yields the graph in (A).