Barron's AP Psychology, 7th Edition (2016)
Chapter 2. Methods
KEY TERMS
Hindsight bias
Applied research
Basic research
Hypothesis
Independent variable
Dependent variable
Theory
Operational definition
Validity
Reliability
Sampling
Sample
Population
Representative sample
Random sampling
Stratified sampling
Experiment—laboratory and field
Confounding variables—participant and situation-relevant
Random assignment
Controls
Group-matching
Experimenter bias
Double-blind procedure
Single-blind procedure
Response or participant bias
Social desirability
Hawthorne effect
Placebo method
Correlations—positive and negative
Survey method
Response rate
Naturalistic observation
Case study method
Descriptive statistics
Frequency distribution
Measures of central tendency—mean, median, mode
Extreme scores or outliers
Positive versus negative skew
Measures of variability—range, standard deviation, variance
z score
Normal curve
Correlation coefficient
Scatter plot
Line of best fit/regression line
Inferential statistics
Sampling error
p value
Statistical significance
Institutional Review Board (IRB)
Coercion
Informed consent
Anonymity
Confidentiality
Debriefing
RESEARCH METHODS
Psychology is a science, and it is therefore based on research. Though people are often guided effectively by their common intuition, sometimes it leads us astray. People have the tendency upon hearing about research findings (and many other things) to think that they knew it all along; this tendency is called hindsight bias. After an event occurs, it is relatively easy to explain why it happened. The goal of scientific research, however, is to predict what will happen in advance.
An understanding of research methods is fundamental to psychology. Because of that, you are more likely to see a free-response (or essay) question on this topic than on any other.
Sometimes psychologists conduct research in order to solve practical problems. For instance, psychologists might compare two different methods of teaching children to read in order to determine which method is better or they could design and test the efficacy of a program to help people quit smoking. This type of research is known as applied research because it has clear, practical applications. Other psychologists conduct basic research. Basic research explores questions that are of interest to psychologists but are not intended to have immediate, real-world applications. Examples of basic research would include studying how people form their attitudes about others and how people in different cultures define intelligence.
Terminology
HYPOTHESES AND VARIABLES
Although some research is purely descriptive, most psychological research is guided by hypotheses. A hypothesis expresses a relationship between two variables. Variables, by definition, are things that can vary among the participants in the research. For instance, religion, stress level, and height are variables. According to an experimental hypothesis, the dependent variable depends on the independent variable. In other words, a change in the independent variable will produce a change in the dependent variable. For instance, consider the hypothesis that watching violent television programs makes people more aggressive. In this hypothesis, watching television violence is the independent variable since the hypothesis suggests that a change in television viewing will result in a change in behavior. In testing a hypothesis, researchers manipulate the independent variable and measure the dependent variable. Hypotheses often grow out of theories. A theory aims to explain some phenomenon and allows researchers to generate testable hypotheses with the hope of collecting data that support the theory.
Researchers not only need to name the variables they will study, they need to provide operational definitions of them. When you operationalize a variable, you explain how you will measure it. For instance, in the hypothesis above, what programs will be considered violent? What behaviors will be considered aggressive? These and many other questions need to be answered before the research commences. The operationalization of the variables raises many issues about the validity and reliability of the research.
TIP
When writing about research, students often describe the goal as proof of the hypothesis. However, proving a hypothesis is impossible. Rather, research aims to gather data that either supports or disproves a hypothesis.
VALIDITY AND RELIABILITY
Good research is both valid and reliable. Research is valid when it measures what the researcher set out to measure; it is accurate. Research is reliable when it can be replicated; it is consistent. If the researcher conducted the same research in the same way, the researcher would get similar results.
SAMPLING
Before one can begin to investigate a hypothesis, one needs to decide who or what to study. The individuals on which the research will be conducted are called participants (or subjects), and the process by which participants are selected is called sampling. In order to select a sample (the group of participants), one must first identify the population from which the sample will be selected. The population includes anyone or anything that could possibly be selected to be in the sample.
The goal in selecting a sample is that it be representative of a larger population. If I conduct my research about television violence using only my own psychology students, I cannot say much about how viewing violent television affects other people. My students may not be representative of a larger population. I would be better off specifying a larger and more diverse population, the whole student body of 1,000, for example, and then randomly selecting a sample of 100. The definition of random selection is that every member of the population has an equal chance of being selected. Random selection increases the likelihood that the sample represents the population and that one can generalize the findings to the larger population.
Note that psychologists use the term random differently than laypeople. If I choose my sample by standing in front of the library on a Wednesday morning and approaching people in a way I feel is random, I have not used random sampling. Perhaps, without realizing it, I was less likely to approach people I did not know or people wearing college sweatshirts. Since they would not stand an equal chance of being selected for the study, the selection process is not random. In addition, the method just described would not yield a representative sample of the school’s population. Not everybody will walk past the library on Wednesday morning. People who do not will have no chance of being selected for the study and therefore are not part of the population. Random selection is best done using a computer, a table of random numbers, or that tried-and-true method of picking names out of a hat.
Selecting a sample randomly maximizes the chance that it will represent the population from which it was drawn and allows researchers to draw generalizations about the population based on their findings about their sample.
Even if I randomly select a sample of 100 people from the school’s population of 1,000, clearly the sample will probably not perfectly reflect the composition of the school. For instance, if the school has exactly 500 males and 500 females in it, what are the chances that my random sample will have the same 1:1 ratio? Although we could compute those odds, that is not necessary. Clearly, the larger the sample, the more likely it is to represent the population. A sample of all 1,000 students guarantees that it is perfectly representative, and a sample of 1 person guarantees that it is far from representative. So why not use all 1,000 students? The downside of a large sample is time and money. Also, realizing that the populations psychologists study are often much larger than 1,000 people is important. Therefore, for research to use large, but not prohibitively large, samples is considered optimum. Statistics can be used to determine how large a sample should be in order to represent a population of any particular size. If asked on the Advanced Placement Examination to design your own research, you should specify the size of your sample and avoid using samples of extreme sizes.
One additional action can be taken to increase the likelihood that a sample will represent the larger population from which it was chosen. Stratified sampling is a process that allows a researcher to ensure that the sample represents the population on some criteria. For instance, if I thought that participants of different racial groups might respond differently, I would want to make sure that I represented each race in my sample in the same proportion that it appears in the overall population. In other words, if 500 of the 1,000 students in a school are Caucasian, 300 are African American, and 200 are Latino, in a sample of 100 students I would want to have 50 Caucasians, 30 African Americans, and 20 Latinos. To that end, I could first divide the names of potential participants into each of the three racial groups, and then I could choose a random subsample of the desired size from each group.
Experimental Method
Experiments can be divided into laboratory experiments and field experiments. Laboratory experiments are conducted in a lab, a highly controlled environment, while field experiments are conducted out in the world. The extent to which laboratory experiments can be controlled is their main advantage. The advantage of field experiments is that they are more realistic.
Psychologists’ preferred method of research is the experiment because only through a carefully controlled experiment can one show a causal relationship. An experiment allows the researcher to manipulate the independent variable and control for confounding variables. A confounding variable is any difference between the experimental and control conditions, except for the independent variable, that might affect the dependent variable. In order to show that the violent television programs cause participants’ aggression, I need to rule out any other possible cause. An experiment can achieve this goal by randomly assigning participants to conditions and by using various methods of control to eliminate confounding variables.
Students often equate all research with experiments. As described in the text, many different kinds of research can be conducted, but only experiments can identify cause-and-effect relationships.
Assignment is the process by which participants are put into a group, experimental or control. Random assignment means that each participant has an equal chance of being placed into any group. The benefit of random assignment is that it limits the effect of participant-relevant confounding variables. If participants were given the opportunity to choose whether to be in the group watching the violent television or not, it is highly unlikely that the two groups would be comprised of similar people. Perhaps violent people prefer violent television and would therefore select the experimental group. Even if one were to assign people to groups based on a seemingly random criterion (when they arrived at the experiment or where they were sitting in the room), one might open the door to confounding variables. Using random assignment diminishes the chance that participants in the two groups differ in any meaningful way, or, in other words, it controls for participant-relevant variables.
Random assignment controls for participant-relevant confounding variables. Students sometimes confuse random assignment and random sampling. While both involve randomization, sampling is the process of choosing the research participants from the population, and it happens before assignment. Assignment is the process of dividing participants into groups (for example, experimental and control), and it cannot be done until after you have identified the sample.
Note that when we talk about differences between groups, we are referring to the group average. A single very aggressive subject will not throw off the results of the entire group. The idea behind random assignment is that, in general, the groups will be equivalent.
If one wanted to ensure that the experimental and control groups were equivalent on some criterion (for example, sex, IQ scores, age), one could use group matching. If one wanted to group match for sex, one would first divide the sample into males and females and then randomly assign half of each group to each condition. Group matching would not result in the same number of males and females within each group. Rather, half of the males and half of the females would be in each of the groups.
Situation-relevant confounding variables can also affect an experiment. For the participants to be equivalent is not enough. The situations into which the different groups are put must also be equivalent except for the differences produced by the independent variable. If the experimental group watches violent television in a large lecture hall while the control group watches other programs in a small classroom, their situations are not equivalent. Therefore, any differences found between the groups may possibly be due not to the independent variable, as hypothesized, but rather to the confounding variables. Other situation-relevant variables include the time of day, the weather, and the presence of other people in the room. Making the environments into which the two groups are placed as similar as possible controls for situation-relevant confounding variables.
Experimenter bias is a special kind of situation-relevant confounding variable. Experimenter bias is the unconscious tendency for researchers to treat members of the experimental and control groups differently to increase the chance of confirming their hypothesis. Note that experimenter bias is not a conscious act. If researchers purposely distort their data, it is called fraud, not experimenter bias. Experimenter bias can be eliminated by using a double-blind procedure. A double blind occurs when neither the participants nor the researcher are able to affect the outcome of the research. A double blind can be accomplished in a number of ways. The most common way is for the researcher to have someone blind to the participants’ condition interact with the participants. A single blind occurs when only the participants do not know to which group they have been assigned; this strategy minimizes the effect of demand characteristics as well as certain kinds of response or participant bias. Demand characteristics are cues about the purpose of the study. Participants use such cues to try to respond appropriately. Response or subject bias is the tendency for subjects to behave in certain ways (for example, circle the midpoint on a scale or pick the right-hand option more than the left-hand one). One kind of response bias, the tendency to try to give answers that reflect well upon them, is called social desirability.
TIP
Equivalent environments control for situation-relevant confounding variables.
Experiments typically involve at least one experimental group and a control group. The experimental group is the one that gets the treatment operationalized in the independent variable. The control group gets none of the independent variable. It serves as a basis for comparison. Without a control group, knowing whether changes in the experimental group are due to the experimental treatment or simply to any treatment at all is impossible. In fact, merely selecting a group of people on whom to experiment has been determined to affect the performance of that group, regardless of what is done to those individuals. This finding is known as the Hawthorne effect.
TIP
Double blinds eliminate both experimenter and subject bias.
Continuing with the television example, the experimental group would be the participants who view violent television while the control group would view some other type of television, perhaps a comedy. If I were really designing an experiment, I would have to be much more specific in operationally defining my independent variable. I would need to identify exactly what program(s) each group would watch and for how long. Many experiments involve much more complicated designs. In our example, additional groups would view other types of films or groups would view differing amounts of violent content.
One important method of control is known as the placebo method. Whenever participants in the experimental group are supposed to ingest a drug, participants in the control group are given an inert but otherwise identical substance. This technique allows researchers to separate the physiological effects of the drug from the psychological effects of people thinking they took a drug (called the placebo effect).
Students sometimes believe that a control group is the only possible method of control. Remember that although it is an extremely important and obviously named type of control, using control groups is but one of many such methods.
Sometimes using participants as their own control group is possible, a procedure known as counterbalancing. For instance, if I wanted to see how frustration affected performance on an IQ test, I could have my participants engage in a task unlikely to cause frustration, test their IQ, and then give them a frustrating task and test their IQs again. However, this procedure creates the possibility of order effects. Participants may do better on the second IQ test simply by virtue of having taken the first IQ test. This problem can be eliminated by using counterbalancing. I can counterbalance by having half the participants do the frustrating task first and half the participants do the not-frustrating task first and then switching.
Correlational Method
TIP
Correlation does not imply causation.
A correlation expresses a relationship between two variables without ascribing cause. Correlations can be either positive or negative. A positive correlation between two things means that the presence of one thing predicts the presence of the other. A negative correlation means that the presence of one thing predicts the absence of the other. See the statistics section for more information about correlations.
Sometimes psychologists elect not to use the experimental method. Sometimes testing a hypothesis with an experiment is impossible. Suppose, for example, I want to test the hypothesis that boys are more likely to call out in class than girls. Clearly, I cannot randomly assign subjects to conditions. Boys are boys, and girls are girls. The assignment of the independent variable, in this case, has been predetermined. As a result, I will never be able to isolate the cause of the calling out behavior. It could be a biological difference or one of many social influences that act differently upon the sexes from birth onward. If I seek to control all other aspects of the research process, as I would in an experiment, I will have conducted an ex post facto study.
An even more popular research design is the survey method. The survey method, as common sense suggests, involves asking people to fill out surveys. To contrast the survey method with the experimental method, return to the question about whether there is a relationship between watching violence on television and aggressive behavior. The original hypothesis, that “watching violent television programs makes people more aggressive,” cannot be tested using the survey method, because only an experiment can reveal a cause-effect relationship. However, one could use the survey method to investigate whether there is a relationship between the two variables, watching violence on television and aggressive behavior. In the survey method, neither of the variables is manipulated. Therefore, while there are two variables, there is no independent or dependent variable.
Students often confuse the use of surveys to measure the dependent variable in an experiment with the survey method. While surveys can be used as part of the experimental method, the survey method, as described, is a kind of correlational research in which the researcher does not manipulate the independent variable.
Using the survey method means that one can no longer control for participant-relevant confounding variables. Some people watch a lot of violent television, and others do not. In all likelihood, these two groups of people would differ in a number of other ways as well. The survey method does not enable the researcher to determine which of these differences cause a difference in violent behavior.
Although controlling for situation-relevant confounding variables using the survey method is possible (by bringing all the participants to one place at one time to fill out the survey), it is rarely done. One of the advantages of the survey method is that conducting research by mailing surveys for people to fill out at their convenience is easy. However, if people fill out the surveys in different places, at different times of day, by taking different amounts of time, and so on, the research will be plagued by confounding variables. Thus, again, determining what causes a difference in violent behavior becomes impossible. In addition, obtaining a random sample when one sends out a survey is difficult because relatively few people will actually send it back (low response rate), and these people are unlikely to make up a representative sample.
Students often confuse naturalistic observation with field experiments. Both involve doing research out in the world. However, in naturalistic observation, the researchers do not impact the behavior of the participants at all. In contrast, in field experiments, as in all experiments, the researcher has manipulated the independent variable and attempted to eliminate as many confounding variables as possible.
Naturalistic Observation
Sometimes researchers opt to observe their participants in their natural habitats without interacting with them at all. Such unobtrusive observation is called naturalistic observation. The goal of naturalistic observation is to get a realistic and rich picture of the participants’ behavior. To that end, control is sacrificed.
Case Studies
One final research method we will mention is the case study method. The case study method is used to get a full, detailed picture of one participant or a small group of participants. For instance, clinical psychologists often use case studies to present information about a person suffering from a particular disorder. While case studies allow researchers to get the richest possible picture of what they are studying, the focus on a single individual or small group means that the findings cannot be generalized to a larger population.
STATISTICS
Descriptive Statistics
Descriptive statistics, as the name suggests, simply describe a set of data. For instance, if you were interested in researching what kinds of pets your schoolmates have, you might summarize that data by creating a frequency distribution that would tell you how many students had dogs, cats, zebras, and so on. Graphing your findings is often helpful. Frequency distributions can be easily turned into line graphs called frequency polygons or bar graphs known as histograms. The y-axis (vertical) always represents frequency, while whatever you are graphing, in this case, pets, is graphed along the x-axis (horizontal).
You are probably already familiar with at least one group of statistical measures called measures of central tendency. Measures of central tendency attempt to mark the center of a distribution. Three common measures of central tendency are the mean, median, and mode. The mean is what we usually refer to as the average of all the scores in a distribution. To compute the mean, you simply add up all the scores in the distribution and divide by the number of scores. The median is the central score in the distribution. To find the median of a distribution, simply write the scores down in ascending (or descending) order and then, if there are an odd number of scores, find the middle one. If the distribution contains an even number of scores, the median is the average of the middle two scores. The mode is the score that appears most frequently. A distribution may, however, have more than one mode. A distribution is bimodal, for instance, if two scores appear equally frequently and more frequently than any other score.
The mean is the most commonly used measure of central tendency, but its accuracy can be distorted by extreme scores or outliers. Imagine that 19 of your 20 friends drive cars valued at $12,000 but your other friend has a Maserati valued at $120,000. The mean value of your cars is $17,400. However, since that value is in excess of everyone’s car except one person’s, you would probably agree that it is not the best measure of central tendency in this case. When a distribution includes outliers, the median is often used as a better measure of central tendency.
Unless a distribution is symmetrical, it is skewed. Outliers skew distributions. When a distribution includes an extreme score (or group of scores) that is very high, as in the car example above, the distribution is said to be positively skewed. When the skew is caused by a particularly low score (or group of scores), the distribution is negatively skewed. A positively skewed distribution contains more low scores than high scores; the skew is produced by some aberrantly high score(s). Conversely, a negatively skewed distribution contains more high scores than low scores. In a positively skewed distribution, the mean is higher than the median because the outlier(s) have a much more dramatic effect on the mean than on the median. Of course, the opposite is true in a negatively skewed distribution (see Fig. 2.1).
Measures of variability are another type of descriptive statistical measures. Again, you may be familiar with some of these measures, such as the range, variance, and standard deviation. Measures of variability attempt to depict the diversity of the distribution. The range is the distance between the highest and lowest score in a distribution. The variance and standard deviation are closely related; standard deviation is simply the square root of the variance. Both measures essentially relate the average distance of any score in the distribution from the mean. The higher the variance and standard deviation, the more spread out the distribution.
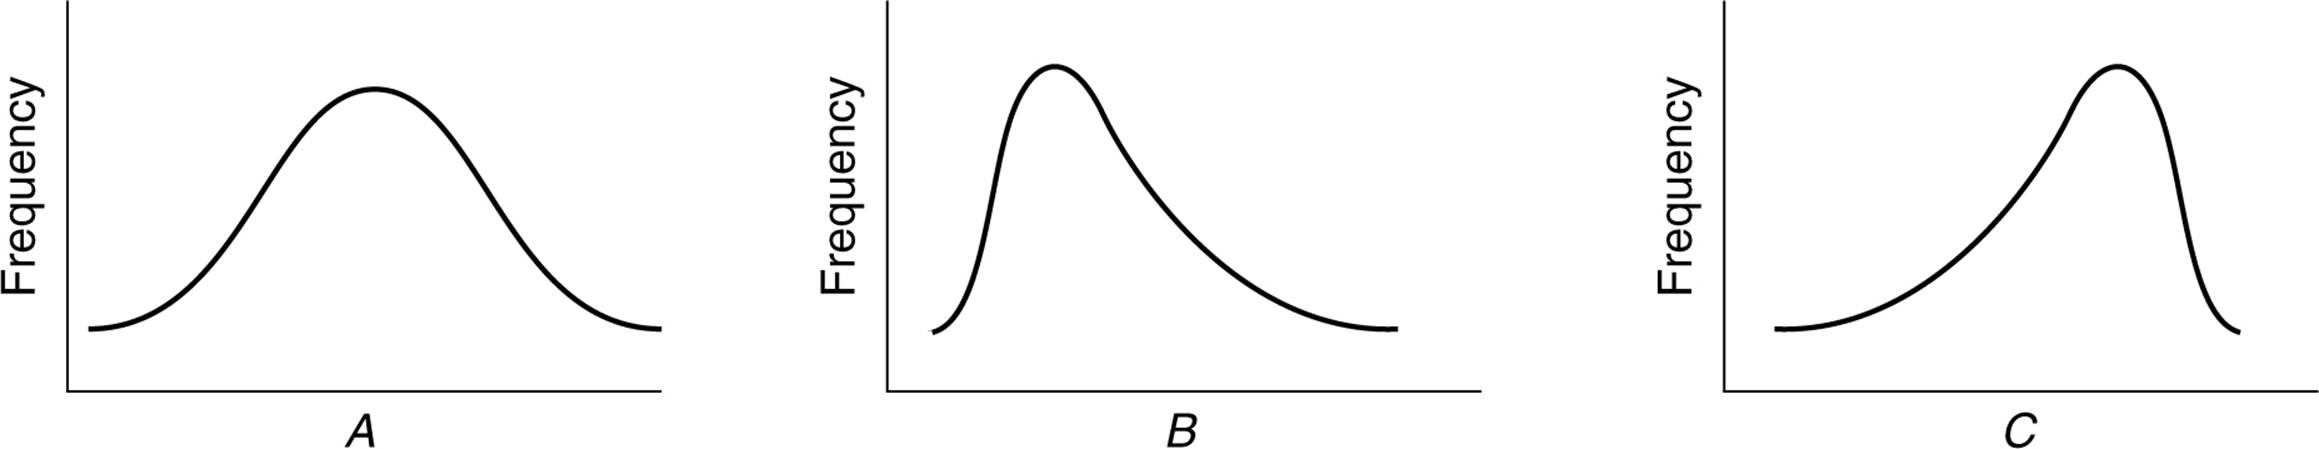
Figure 2.1. A, symmetrical distribution; B, positively skewed distribution; C, negatively skewed distribution F.
Sometimes, being able to compare scores from different distributions is important. In order to do so, you can convert scores from the different distributions into measures called z scores. Z scores measure the distance of a score from the mean in units of standard deviation. Scores below the mean have negative z scores, while scores above the mean have positive z scores. For instance, if Clarence scored a 72 on a test with a mean of 80 and a standard deviation of 8, Clarence’s z score would be –1. If Maria scored an 84 on that same test, her z score would be +0.5.
Often in psychology you will see reference to the normal curve. The normal curve is a theoretical bell-shaped curve for which the area under the curve lying between any two z scores has been predetermined. Approximately 68 percent of scores in a normal distribution fall within one standard deviation of the mean, approximately 95 percent of scores fall within two standard deviations of the mean, and almost 99 percent of scores fall within three standard deviations of the mean. Knowing that the normal curve is symmetrical, and knowing the three numbers given above will allow you to calculate the approximate percentage of scores falling between any given z scores. For instance, approximately 47.5 percent (95/2) of scores fall between the z scores of 0 and +2 (see Fig. 2.2).
While z scores measure the distance of a score away from the mean, percentiles indicate the distance of a score from 0. Someone who scores in the 90th percentile on a test has scored better than 90 percent of the people who took the test. Similarly, someone who scores at the 38th percentile scored better than only 38 percent of the people who took the test. A clear relationship exists between percentiles and z scores when dealing with the normal curve. Someone who scores at the 50th percentile has a z score of 0, and someone who scores at the 98th percentile has an approximate z score of +2.
Correlations
A correlation measures the relationship between two variables. As explained earlier, correlations can be either positive or negative. If two things are positively correlated, the presence of one thing predicts the presence of the other. In contrast, a negative correlation means that the presence of one thing predicts the absence of the other. When no relationship exists between two things, no correlation exists. As an example, one would suspect that a positive correlation exists between studying and earning good grades. Conversely, one would suspect that a negative correlation might occur between cutting classes and earning good grades. Finally, it is likely that there is no correlation between the number of stuffed animals one owns and earning good grades.
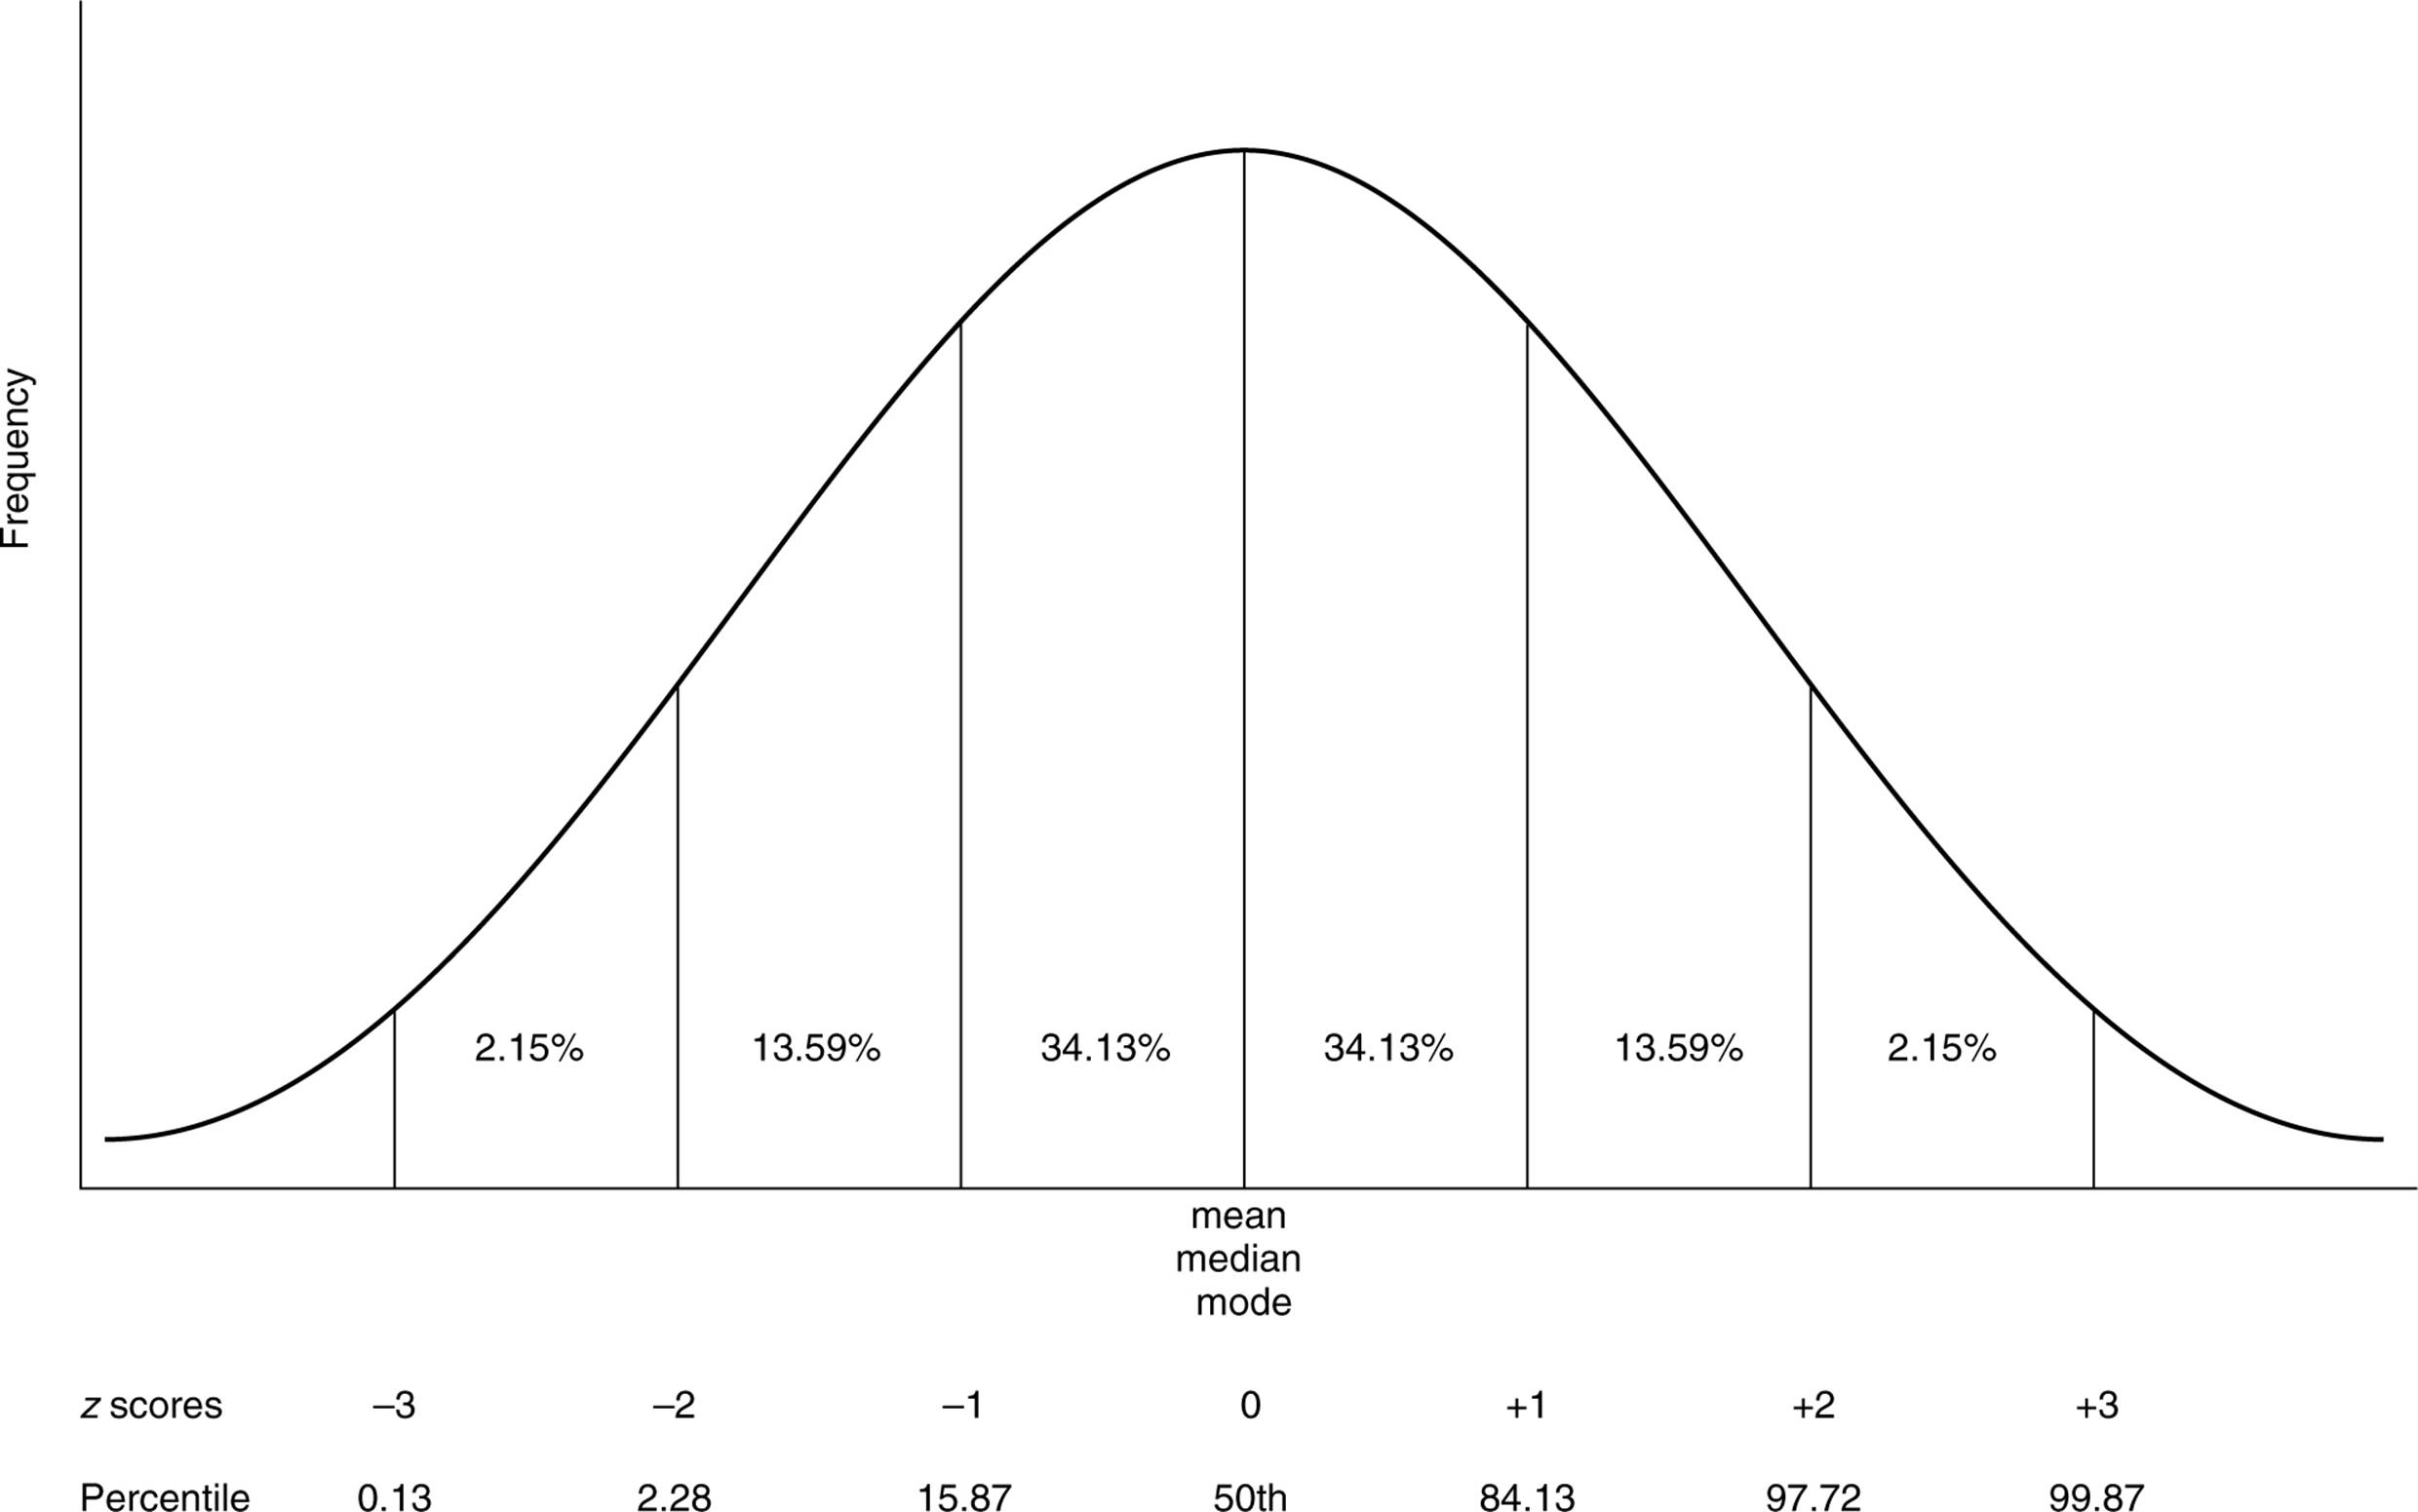
Figure 2.2. The normal distribution.
Correlations may be either strong or weak. The strength of a correlation can be computed by a statistic called the correlation coefficient. Correlation coefficients range from –1 and +1 where –1 is a perfect, negative correlation and +1 is a perfect, positive correlation. Both –1 and +1 denote equally strong correlations. The number 0 denotes the weakest possible correlation—no correlation—which means that knowing something about one variable tells you nothing about the other.
TIP
Students often believe strong correlations correspond to positive numbers. Do not forget that –.92 is exactly as strong a correlation as +.92.
A correlation may be graphed using a scatter plot. A scatter plot graphs pairs of values, one on the y-axis and one on the x-axis. For instance, the number of hours a group of people study per week could be plotted on the x-axis while their GPAs could be plotted on the y-axis. The result would be a series of points called a scatter plot. The closer the points come to falling on a straight line, the stronger the correlation. The line of best fit, or regression line, is the line drawn through the scatter plot that minimizes the distance of all the points from the line. When the line slopes upward, from left to right, it indicates a positive correlation. A downward slope evidences a negative correlation. The scatter plot depicting the data set given in Table 2.1 is graphed in Figure 2.3.
|
Table 2.1. The Relationship Between Hours Studied and GPA |
||
|
Name |
Hours Studied |
GPA |
|
Teresa |
15 |
3.8 |
|
Raoul |
17 |
3.8 |
|
Todd |
4 |
1.3 |
|
Lucy |
11 |
3.1 |
|
Aaron |
8 |
2.4 |
|
Pam |
12 |
3.3 |
|
Laticia |
14 |
3.9 |
|
Greg |
9 |
2.5 |
|
Megan |
5 |
0.6 |
TIP
As discussed previously, a correlation, no matter how strong, does not indicate a causal relationship.
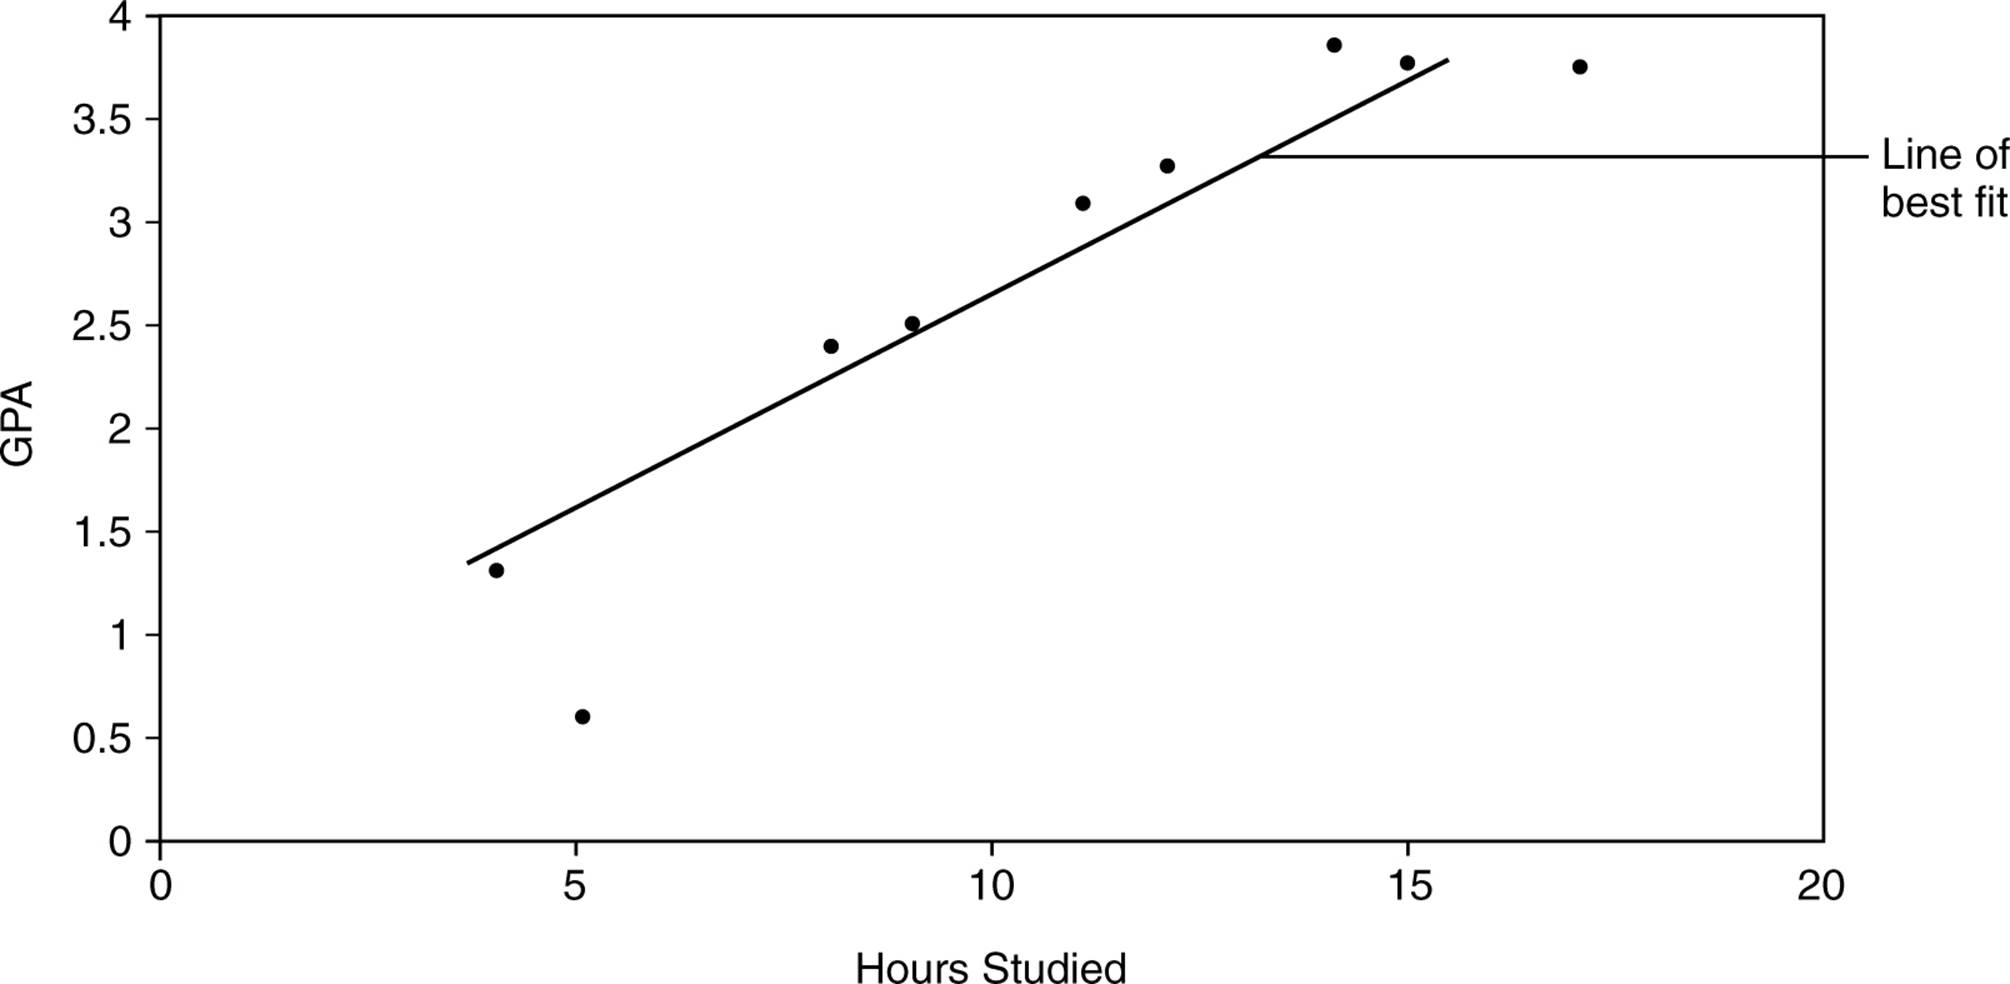
Figure 2.3. Scatter plot showing the correlation between hours studied and GPA.
Inferential Statistics
Whereas descriptive statistics provide a way to summarize information about the sample studied, the purpose of inferential statistics is to determine whether or not findings can be applied to the larger population from which the sample was selected. Remember that one of the primary goals in selecting a sample is that the sample represent the population from which it was picked. If a sample does not represent the larger population, one cannot infer anything about the larger population from the sample. Guaranteeing that a sample is representative of a population is impossible. The extent to which the sample differs from the population is known as sampling error.
Say that you ran an experiment testing the effects of sugar consumption on short-term memory. You randomly assigned your 50 subjects to either a control group that was given a sugarfree lollipop or to the experimental group that was given a seemingly identical lollipop that contained sugar. You then tested the participants’ ability to recall 15 one-syllable nouns. If the experimental group remembered an average of 7 words and the control group remembered an average of 6.9 words, would you be comfortable concluding that sugar does, in fact, enhance short-term memory? Your gut reaction is probably to say that the 0.1 difference in the example is too small to allow us to draw such a conclusion. What if the experimental group consisted of just one person who recalled all 15 words while the control group contained one person who remembered only 5 words? You would probably be similarly reluctant to draw any conclusions even given this enormous difference in the number of words recalled due to the tiny sample size.
In both cases, you would be correct to be skeptical. The differences between the groups are likely due to sampling error and chance. The purpose of inferential statistics is to help psychologists decide when their findings can be applied to the larger population. Many different inferential statistical tests exist such as t-tests, chi square tests, and ANOVAs. They all take into account both the magnitude of the difference found and the size of the sample. However, what is most important for you to know is that all these tests yield a p value. The p value gives the probability that the difference between the groups is due to chance. The smaller the p value, the more significant the results. Scientists have decided that a p value of .05 is the cutoff for statistically significant results. A p value of .05 means that a 5 percent chance exists that the results occurred by chance. A p value can never equal 0 because we can never be 100 percent certain that results did not happen due to chance. As a result, scientists often try to replicate their results, thus gathering more evidence that their initial findings were not due to chance.
A p value can also be computed for any correlation coefficient. The stronger the correlation and the larger the sample, the more likely the relationship will be statistically significant.
APA ETHICAL GUIDELINES
Ethical considerations are a major component in research design. You should know and understand the ethical guidelines established by the APA (American Psychological Association) for human and animal research and be prepared to apply the concepts to specific research designs. Any type of academic research must first propose the study to the ethics board or institutional review board (IRB) at the institution. The IRB reviews research proposals for ethical violations and/or procedural errors. This board ultimately gives researchers permission to go ahead with the research or requires them to revise their procedures.
Animal Research
Groups advocating the ethical treatment of animals are focusing more and more attention on how animals are treated in laboratory experiments. The APA developed strict guidelines about what animals and how animals can be used in psychological research. Ethical psychological studies using animals must meet the following requirements:
■They must have a clear scientific purpose.
■The research must answer a specific, important scientific question.
■Animals chosen must be best-suited to answer the question at hand.
■They must care for and house animals in a humane way.
■They must acquire animal subjects legally. Animals must be purchased from accredited companies. If wild animals must be used, they need to be trapped in a humane manner.
■They must design experimental procedures that employ the least amount of suffering feasible.
Human Research
Research involving human subjects must meet the following standards:
■No coercion—Participation should be voluntary.
■Informed consent—Participants must know that they are involved in research and give their consent. If the participants are deceived in any way about the nature of the study, the deception must not be so extreme as to invalidate the informed consent. The research the participants thought they were consenting to must be similar enough to the actual study to give the informed consent meaning. Also, researchers must be very careful about the trauma deception may cause (see Risk, below).
■Anonymity or confidentiality—Participants’ privacy must be protected. Their identities and actions must not be revealed by the researcher. Participants have anonymity when the researchers do not collect any data that enable them to match a person’s responses with his or her name. In some cases, such as interview studies, a researcher cannot promise anonymity but instead guarantees confidentiality, that the researcher will not identify the source of any of the data.
■Risk—Participants cannot be placed at significant mental or physical risk. Typically, it is considered permissible for participants to experience temporary discomfort or stress but activities that might cause someone long-term mental or physical harm must be avoided. This clause requires interpretation by the review board. Some institutions might allow a level of risk other boards might not allow. This consideration was highlighted by Stanley Milgram’s obedience studies in the 1970s in which participants thought they were causing significant harm or death to other participants (see the “Social Psychology” chapter).
■Debriefing—After the study, participants should be told the purpose of the study and provided with ways to contact the researchers about the results. When research involves deception, it is particularly important to conduct a thorough debriefing.
PRACTICE QUESTIONS
Directions: Each of the questions or incomplete statements below is followed by five suggested answers or completions. Select the one that is best in each case.
1.Psychologists generally prefer the experimental method to other research methods because
(A)experiments are more likely to support psychologists’ hypotheses.
(B)experiments can show cause-effect relationships.
(C)it is easier to obtain a random sample for an experiment.
(D)double-blind designs are unnecessary in an experiment.
(E)experiments are more likely to result in statistically significant findings.
2.Theoretically, random assignment should eliminate
(A)sampling error.
(B)the need to use statistics.
(C)concerns over validity.
(D)many confounding variables.
(E)the need for a representative sample.
3.Charlotte and Tamar are lab partners assigned to research who is friendlier, girls or boys. After conversing with their first 10 participants, they find that their friendliness ratings often differ. With which of the following should they be most concerned?
(A)reliability
(B)confounding variables
(C)ethics
(D)validity
(E)assignment
4.Which of the following hypotheses would be most difficult to test experimentally?
(A)People exposed to the color red will be more aggressive than those exposed to the color blue.
(B)Exercise improves mood.
(C)Exposure to violent television increases aggression.
(D)Studying leads to better grades.
(E)Divorce makes children more independent.
5.Professor Ma wants to design a project studying emotional response to date rape. He advertises for participants in the school newspaper, informs them about the nature of the study, gets their consent, conducts an interview, and debriefs them about the results when the experiment is over. If you were on the IRB, which ethical consideration would you most likely have the most concern about in Professor Ma’s study?
(A)coercion
(B)deception
(C)confounding variables
(D)confidentiality
(E)clear scientific purpose
6.Some psychologists consider Stanley Milgram’s obedience studies to be unethical because of which ethical consideration?
(A)improper sampling procedure
(B)risk of long-term harm
(C)clear scientific purpose
(D)debriefing
(E)anonymity
7.One of the principal differences between the ethical guidelines for human and animal research is:
(A)Human participants can be deceived for experimental purposes and animals cannot.
(B)Animals can be placed at much greater physical risk than human participants can.
(C)Human participants must be chosen much more carefully than animal subjects.
(D)If humans might physically suffer because of the study, the suffering must be minimal, in contrast to animal studies where any amount of suffering is ethical if it helps to further a clear scientific purpose.
(E)Environmental conditions for human studies must be monitored much more closely than they are in an animal study.
8.Lily scored 145 on an IQ test with a mean of 100 and a standard deviation of 15. What is her z score?
(A)–3
(B)–1.5
(C)+0.67
(D)1.5
(E)+3
9.What is the median of the following distribution: 6, 2, 9, 4, 7, 3?
(A)4
(B)5
(C)5.5
(D)6
(E)6.5
10.Emma scores a perfect 100 on a test that everyone else fails. If we were to graph this distribution, it would be
(A)symmetrical.
(B)normal.
(C)positively skewed.
(D)negatively skewed.
(E)a straight line.
11.José hypothesizes that a new drug he has just invented will enhance mice’s memories. He feeds the drug to the experimental group and gives the control group a placebo. He then times the mice as they learn to run through a maze. In order to know whether his hypothesis has been supported, Jose would need to use
(A)scatter plots.
(B)descriptive statistics.
(C)histograms.
(D)inferential statistics.
(E)means-end analysis.
12.Which of the following is an example of random sampling?
I.Picking out of a hat to assign each of three classes to an experimental condition.
II.Having a computer generate a random list of 100 high school students.
III.Approaching any 50 students during sixth-period lunch.
(A)I only
(B)II only
(C)III only
(D)I and II
(E)I, II, and III
13.Vincenzo conducts an experiment to see whether fear makes mice run through mazes faster. He first selected a sample of 60 mice and then divided them into a control group and an experimental group. Which cannot be a confounding variable?
(A)How fast the mice are at the start.
(B)When the mice run the maze.
(C)The population from which he selected his subjects.
(D)How frightened the mice are before the experiment.
(E)Where the mice run the maze.
14.Olivia, a nursery school student, hypothesizes that boys have fights with the finger paints more than girls do. She tests her hypothesis by casually watching the finger-painting table for three days of nursery school. What method is she using?
(A)field experiment
(B)informal survey
(C)case study
(D)naturalistic observation
(E)ethnography
15.Talia collects survey data that indicate that students who spend more time preparing for the AP test tend to score better than other students. Jen can now conclude that
(A)studying improves exam grades.
(B)a relationship exists between studying and exam grades.
(C)a significant correlation exists between studying and exam grades.
(D)anyone who does not study will do poorly on the exam.
(E)better students tend to study more.