1,296 ACT Practice Questions, 3rd Edition (2013)
Science Practice Section 2
SCIENCE REASONING TEST
35 Minutes—40 Questions
DIRECTIONS: There are seven passages in the following section. Each passage is followed by several questions. After reading a passage, choose the best answer to each question and blacken the corresponding oval on your answer document. You may refer to the passages as often as necessary.
You are NOT permitted to use a calculator on this test.
Passage I
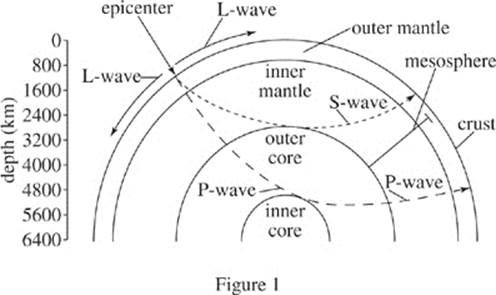
The magnitude of seismic energy released from an earthquake is often described using the logarithmic and unit-less Richter scale. Originating at the epicenter, seismic energy travels through the earth via waves such as L-waves, S-waves, and P-waves. Earthquakes with a Richter scale magnitude of 5.0 or greater can typically be detected throughout the world. Figure 1 depicts the layers of the earth and typical travel patterns of seismic waves. Table 1 lists characteristics of those seismic waves. Figure 2 shows the number of earthquakes (by magnitude) detected at a particular seismic activity monitoring station in the past 30 years, as well as the percentage probability of future earthquakes (by magnitude) in that same region in the next 30 years.
|
Table 1 |
||
|
Seismic wave |
Depth range (km) |
Crust velocity (m/s) |
|
L-wave |
0−10 |
2.0−4.5 |
|
S-wave |
0−2921 |
3.0−4.0 |
|
P-wave |
0−5180 |
5.0−7.0 |
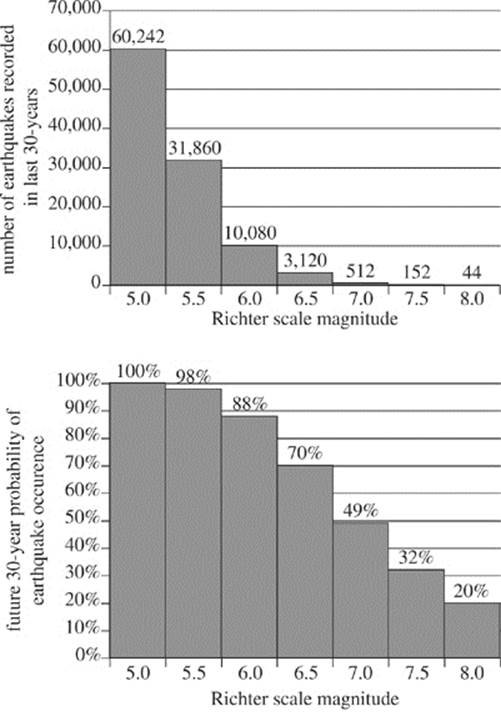
Figure 2
1. Figure 1 defines the mesosphere as a region of the Earth that overlaps which of the following atmospheric layers?
I. Outer core
II. Inner mantle
III. Outer mantle
A. II only
B. I and II only
C. II and III only
D. I, II, and III
2. A series of seismic waves was observed from an observation station. The average crust velocity of these waves was 3 m/s, and their maximum depth occurred in the inner mantle. Based on Figure 1 and Table 1, the seismic waves observed were most likely:
F. L-waves.
G. S-waves.
H. P-waves.
J. K-waves.
3. Given the data in Figure 2, the future probability of an earthquake occurrence decreases by more than half when comparing which of the following 2 Richter scale magnitudes?
A. 5.0 and 6.0
B. 6.0 and 6.5
C. 6.5 and 7.5
D. 7.5 and 8.0
4. According to Figure 2, the probability of a future earthquake occurrence is lowest for which of the following ranges of Richter scale magnitude?
F. 5.5 to 6.0
G. 6.0 to 6.5
H. 6.5 to 7.0
J. 7.0 to 7.5
5. Based on Figure 2, the ratio of Richter scale 5.5 earthquakes to Richter scale 5.0 earthquakes in the last 30 years can be expressed approximately by which of the following fractions?
A. ![]()
B. ![]()
C. ![]()
D. ![]()
Passage II
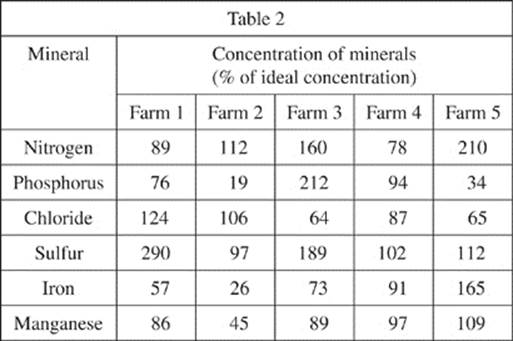
In agriculture, soils can be classified based on mineral content (the amount of various metals present in the soil), and organic content (the percent of soil volume occupied by material made by living organisms). Ideal concentrations of various minerals are given in parts per million (ppm) in Table 1. If the levels of different minerals of a soil are all similar, relative to the optimal levels, the soil is said to be well defined. If the levels of different minerals in a soil vary widely relative to the optimal levels, the soil is said to be poorly defined.
|
Table 1 |
|
|
Mineral |
Ideal concentration (ppm) |
|
Nitrogen |
22 |
|
Phosphorus |
14 |
|
Potassium |
129 |
|
Chloride |
12 |
|
Sulfur |
88 |
|
Iron |
6.9 |
|
Manganese |
2.7 |
Study 1
Soil was taken from 5 different farms to a laboratory. The soils were desiccated (all water was removed), and a 1 L sample of each soil was prepared. In order to make sure that no minerals were trapped within the organic matter of a soil, the organic matter of each soil was burned by heating the soil to 500°C for 20 minutes. The ash of the organic matter was removed and the remaining soil analyzed for the concentration of various minerals. The results are shown, as percent of ideal concentration, in Table 2.
Study 2
To determine the percentage of the mass of each soil composed of organic matter, the above procedure was repeated, with the soil weighed before being heated to 500°C and after having the ash removed. The number of live cells (bacteria, fungi, etc.) in a cubic millimeter of each soil was determined by microscopic analysis. The results are presented in Table 3.
|
Table 3 |
||
|
Farm |
% organic matter |
# living cells per mm3 |
|
1 |
7.1 |
2,964 |
|
2 |
8.9 |
3,920 |
|
3 |
4.8 |
1,642 |
|
4 |
6.6 |
2,672 |
|
5 |
18.9 |
9,467 |
6. Soils with more living cells per mm3 generally consume more oxygen than soils with fewer living cells. Based on this information, the soil of which farm would be expected to consume the most oxygen?
F. Farm 1
G. Farm 2
H. Farm 3
J. Farm 5
7. If, in Study 2, before and after heating a soil sample to 500°C for 20 minutes and removing the ash, the mass of the sample was approximately the same, which of the following is the most reasonable conclusion?
A. There was little or no water in the soil.
B. There was a large quantity of water in the soil.
C. There was little or no organic matter in the soil.
D. There was little or no mineral content in the soil.
8. In Study 2, before heating the sample to 500°C, it was necessary for the scientists to desiccate the soil in order to ensure that:
F. the water was not mistaken for a mineral.
G. the water was not consumed by the living cells.
H. it was possible to count live cells by making sure the soil didn’t stick together.
J. the mass of the water was not mistaken for organic matter.
9. Based on Study 2, if the scientists took a soil sample from another farm, and the number of living cells per mm3 was determined to be 2,100, the % organic matter in that soil would most likely be:
A. less than 4.8.
B. between 4.8 and 6.6.
C. between 6.6 and 7.1.
D. greater than 7.1.
10. Beans grow fastest in soils with high nitrogen and iron levels. If all other levels were equal, then based on the results of Study 1, which of the farms would be expected to produce the fastest growing beans?
F. Farm 5
G. Farm 4
H. Farm 3
J. Farm 2
11. The soil of which of the farms would likely be considered the most well defined, based on the information in Study 1?
A. Farm 1
B. Farm 2
C. Farm 3
D. Farm 4
Passage III
Rock candy was made by putting a mixture of 180°°F water and an amount of sugar (S1) into an apparatus shown in Figure 1, inserting a string through the top, and allowing the mixture to stand and cool. The internal container was a jar made of glass, and the external container was made of plastic.
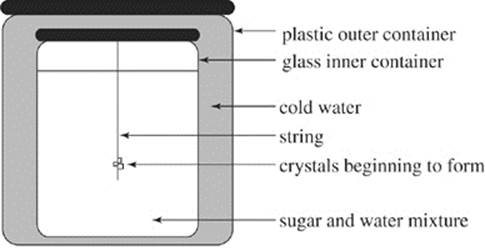
Figure 1
Figure 2 shows how the temperature of S1 and the temperature of the cold water in the outer jar varied with time as the mixture was allowed to stand.
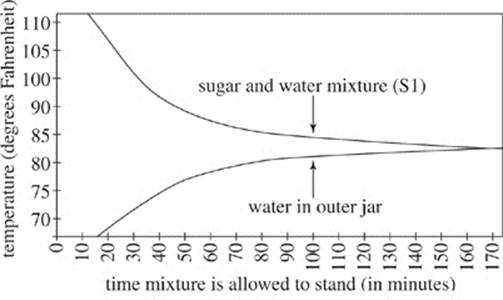
Figure 2
According to the Second Law of Thermodynamics, as the temperature of S1 decreases, the orderliness of the atoms in the solution must increase. This is why crystals form on the string, creating rock candy. Because of the Second Law of Thermodynamics, temperature of the sugar and water mixture can be monitored to measure orderliness of the atoms in the mixture. Two other sugar and water mixtures (S2 and S3) were monitored under standing conditions the same as those used for S1.
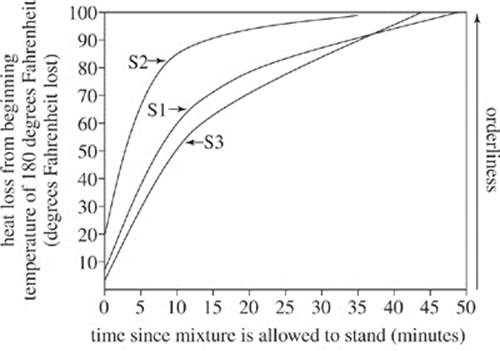
Figure 3
12. According to Figure 3, for S3, the heat lost from the beginning temperature of 180°F after being allowed to stand for 30 minutes is closest to which of the following?
F. 10 degrees Fahrenheit
G. 50 degrees Fahrenheit
H. 80 degrees Fahrenheit
J. 100 degrees Fahrenheit
13. According to Figures 2 and 3, as the temperature of the water in the outer jar increased, the heat loss from the beginning temperature of 180°F for S1:
A. decreased only.
B. increased only.
C. decreased, and then increased.
D. increased, and then decreased.
14. An additional sugar and water mixture (S4) was monitored under conditions identical to those used to gather the data in Figure 3. The heat lost after being allowed to stand 0 minutes was 15°F. How does the initial orderliness of the atoms in S4 compare with the orderliness of the atoms in mixtures S1, S2, and S3?
F. The orderliness of S4 was greater than the orderliness of S1, S2, and S3.
G. The orderliness of S4 was less than the orderliness of S1, S2, and S3.
H. The orderliness of S4 was greater than the orderliness of S2 and S3, but less than the orderliness of S1.
J. The orderliness of S4 was greater than the orderliness of S1 and S3, but less than the orderliness of S2.
15. Based on Figure 1, which of the following best explains the trends shown in Figure 2? In sum, as the time the mixture was allowed to stand increased, the heat was conducted by the:
A. glass jar from the sugar and water mixture to the water outside the jar.
B. glass jar from the water outside the jar to the sugar and water mixture.
C. plastic container from the string to the water outside the jar.
D. plastic container from the string to the sugar and water mixture.
16. Rock candy begins to form when the temperature of the sugar and water mixture has lost 100°F from its beginning temperature. Based on Figure 3, which mixture, if any, would begin to form rock candy first?
F. S1
G. S2
H. S3
J. All mixtures would begin to form rock candy at the same time.
Passage IV
The Citric cycle is an essential process used to transform carbohydrates, lipids, and proteins into energy in aerobic organisms. If yeast is unable to produce succinate, it cannot survive. The Citric cycle steps leading to the creation of succinate in yeast are shown in Figure 1. Each step in this cycle is catalyzed by an enzyme, which is essential to overcome the energy barrier between reactant and product. In the first step, Enzyme 1 is the enzyme, citrate is the reactant, and isocitrate is the product.
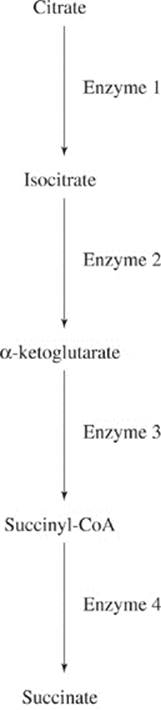
Figure 1
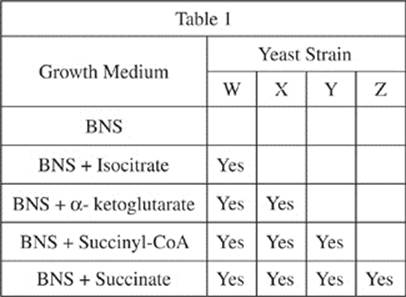
Experiment
A scientist grew four strains of yeast on several different growth media. Each strain was unable to produce succinate because it lacked one of the enzymes required for the reaction pathway shown in Figure 1. Table 1 shows the results of the scientist’s experiment: “Yes” indicates that the strain was able to grow in the basic nutrition solution (BNS) + the particular chemical. An undamaged strain of yeast would be able to grow in the basic nutrition solution without any additional chemical. If a strain was able to grow in a given growth medium, then it was able to produce succinate from the additional chemical added to the basic nutrition solution.
If certain genes are damaged, the essential enzymes cannot be produced, which means that the reactions that the enzyme catalyzes cannot go. Table 2 lists the genes responsible for the enzymes in the steps of the Citric cycle leading to succinate production in yeast. If an enzyme cannot be produced, then the product of the reaction that enzyme catalyzes cannot be synthesized and the reactant in that reaction will become highly concentrated. If a gene is damaged, then it is notated with a superscript negative sign, as in Cat3–; if a gene is not damaged it is notated with a superscript positive sign, as in Cat3+.
|
Table 2 |
|
|
Gene |
Enzyme |
|
Cat1 |
Enzyme 1 |
|
Cat2 |
Enzyme 2 |
|
Cat3 |
Enzyme 3 |
|
Cat4 |
Enzyme 4 |
17. Based on the information presented, the highest concentration of isocitrate would most likely be found in which of the following yeasts?
A. Yeast that cannot produce Enzyme 1
B. Yeast that cannot produce Enzyme 2
C. Yeast that cannot produce Enzyme 3
D. Yeast that cannot produce Enzyme 4
18. According to the information in the passage and Table 2, a strain of yeast that is Cat1+ Cat2– Cat3– Cat4+ CANNOT produce:
F. Enzyme 1 and Enzyme 4.
G. Enzyme 3 and Enzyme 4.
H. Enzyme 2 and Enzyme 3.
J. Enzyme 1 and Enzyme 2.
19. Which of the following statements best describes the relationships between citrate, isocitrate, and α-ketoglutarate as shown in Figure 1?
A. Isocitrate is a product of a reaction of α-ketoglutarate, and α-ketoglutarate is a product of a reaction of citrate.
B. α-ketoglutarate is a product of a reaction of isocitrate, and isocitrate is a product of a reaction of citrate.
C. α-ketoglutarate is a product of a reaction of citrate, and citrate is a product of a reaction of isocitrate.
D. Citrate is a product of a reaction of isocitrate, and isocitrate is a product of a reaction of α-ketoglutarate.
20. Strain X yeast was most likely unable to synthesize:
F. isocitrate from citrate.
G. α-ketoglutarate from isocitrate.
H. succinyl-CoA from α-ketoglutarate.
J. succinate from succinyl-CoA.
21. One of the growth media shown in Table 1 was a control that the scientist used to demonstrate that all four strains of yeast had genetic damage that prevented the reactions shown in Figure 1, the reactions which are responsible for the synthesis of succinate. Which growth media was used as a control?
A. BNS
B. BNS + succinate
C. BNS + isocitrate
D. BNS + succinyl-CoA
22. For each of the four strains of yeast, W–Z, shown in Table 1, if a given strain was able to grow in BNS + succinyl-CoA, then it was also able to grow in:
F. BNS.
G. BNS + isocitrate.
H. BNS + α-ketoglutarate.
J. BNS + succinate.
Passage V
Many viruses are known to persist more prevalently during certain times of the year. A study of four relatively unknown viruses was conducted to examine their annual rate of prevalence and mortality in a host population. A large survey was conducted of local populations for the presence of antigen markers indicative of viral exposures to the four virus types. Measurements were acquired monthly beginning in January of 2000 and concluding two years later. All monthly measurements were averaged for comparison.
Figure 1 shows the incidence (cases per 1,000 individuals studied) of viral infections attributed to each viral type over the duration of the study. Figure 2 shows the number of deaths (per 1,000 individuals studied) attributed to virus A and D infections.
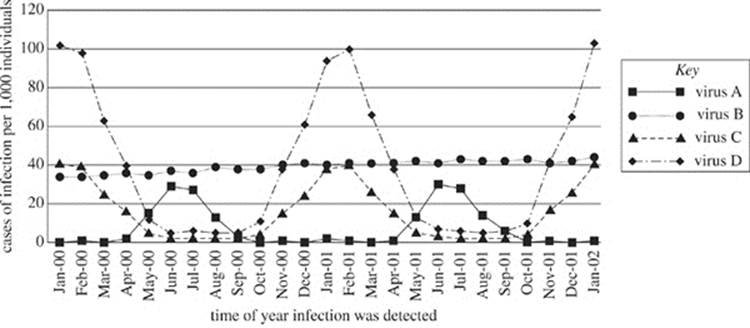
Figure 1
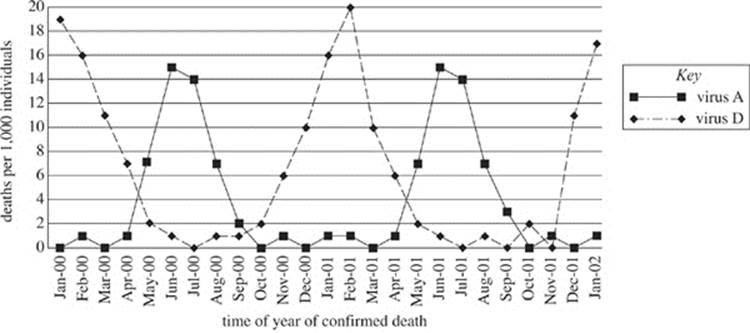
Figure 2
23. According to Figure 1, the incidence of virus A is greatest during which season of the year?
A. Spring (Mar–May)
B. Summer (Jun–Aug)
C. Fall (Sep–Nov)
D. Winter (Dec–Feb)
24. According to Figure 1, during April 2001, which virus was least prevalent in the studied population?
F. Virus A
G. Virus B
H. Virus C
J. Virus D
25. In a previous study, a virologist claimed that the incidence of virus B has always exceeded the incidence of virus C. As shown in Figure 1, the data for which of the following months is inconsistent with the virologist’s claims?
A. January 2000
B. February 2001
C. August 2001
D. December 2001
26. According to Figure 1, the incidence of at least 3 of the viruses is most alike during which of the following months?
F. April 2000
G. September 2000
H. November 2001
J. January 2002
27. During both years of the survey, in one month every year, 7 out of 1,000 individuals died as a result of infection with virus A and 2 out of 1,000 individuals died as a result of infection with virus D. According to Figure 2, these data most likely were obtained during which of the following months?
A. January
B. March
C. May
D. October
Passage VI
The pH at which a protein is uncharged is called its isoelectric point (pI). As the surrounding pH decreases, proteins gain an increasing positive charge. As the surrounding pH increases, proteins gain an increasingly negative charge. In gel electrophoresis, a mixture of proteins can be separated based on their relative charge. The proteins are first dissolved in a solvent and then placed at the starting point of an agarose gel. A current is applied to the gel and the proteins migrate different distances according to their charge (see Figure 1).
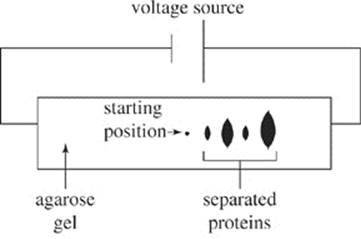
Figure 1
The following experiments were done to determine how varying the pH of a solvent affects the separation of proteins with gel electrophoresis. Table 1 shows the isoelectric points of the proteins and the pH values of the solvents used. The pH scale is logarithmic. Solutions with a pH less than 7.0 are acidic, while those with a pH more than 7.0 are basic.
|
Table 1 |
|
|
Protein |
pI |
|
A |
8.2 |
|
Solvent |
pH |
|
1 |
8.9 |
Experiment 1
A special paper 150 mm long is treated with an agarose gel. Electrodes were attached on each end and wired to a 100-volt source. A 150 µg mixture of proteins A–D was added to Solvent 1 to make a 200 µL solution. The solution was placed at the starting point of the gel and allowed to separate for 60 minutes. The density of the separated proteins was plotted as a percentage over their distance traveled. The procedure was repeated for Solvents 2 and 3 and the results presented in Figure 2.
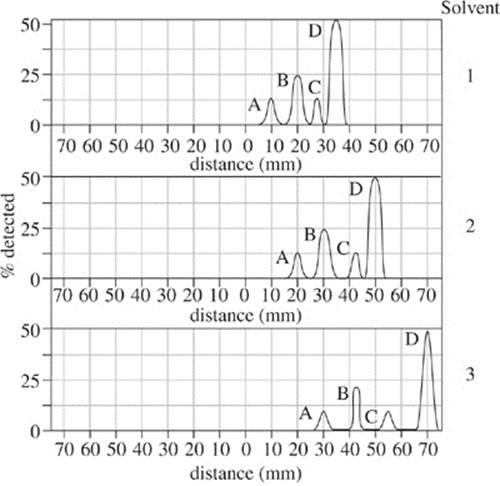
Figure 2
Experiment 2
The procedures of Experiment 1 were repeated after reversing the electrode attachments on the voltage source. Results are shown in Figure 3.
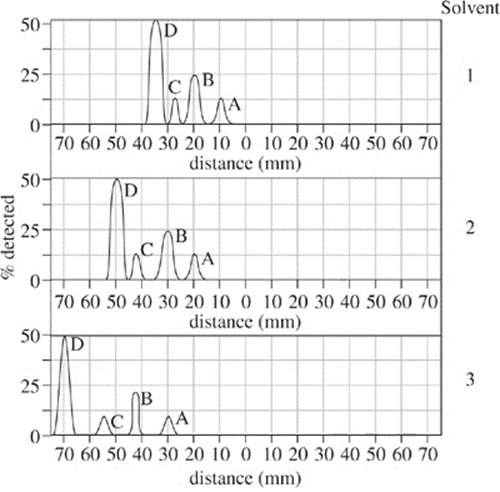
Figure 3
28. In Experiment 2, when Solvent 2 was used, the majority of Protein D migrated a distance from the starting point closest to:
F. 15 mm.
G. 35 mm.
H. 50 mm.
J. 65 mm.
29. Suppose that Experiment 1 were repeated using a solvent with a pH of 8.4. The migration distance of Protein A would most likely peak at:
A. less than 10 mm.
B. between 10 mm and 20 mm.
C. between 20 mm and 30 mm.
D. greater than 30 mm.
30. Protein L has an isoelectric point (pI) of 6.6. The results of Experiments 1 and 2 would be most similar to the plots shown in Figures 1 and 2 if, in each trial, Protein L were added to the protein mixture after removing:
F. Protein A.
G. Protein B.
H. Protein C.
J. Protein D.
31. The resolution of gel electrophoresis decreases as the overall distance between the peaks on the density plot decreases. Based on the results of Experiments 1 and 2, which of the following sets of conditions had the lowest resolution for the separation?
|
Experiment 1 |
Experiment 2 |
|
|
A. |
Solvent 1 |
Solvent 1 |
|
B. |
Solvent 3 |
Solvent 3 |
|
C. |
Solvent 2 |
Solvent 3 |
|
D. |
Solvent 3 |
Solvent 1 |
32. Suppose that Experiment 1 will be repeated using Solvent 2, but Protein Y (pI = 7.1) is added to the overall mixture. Which of the following best predicts the order of migration distances of the 5 proteins, from shortest to longest?
F. D, C, Y, B, A
G. D, Y, C, B, A
H. A, B, Y, C, D
J. A, Y, B, C, D
33. In Experiment 2, for Solvent 2, at the migration distance where Protein B returned to its 0% migration detection, the percent of Protein A that migrated using Solvent 3 was closest to:
A. 0%.
B. 25%.
C. 50%.
D. 75%.
Passage VII
Students studying gravity and motion were given the following information:
• Gravity is an attractive force between two bodies that is directly related to their mass and indirectly related to the square of the distance between their centers.
• Acceleration due to gravity is the acceleration of an object that results from the force of gravity.
• Weight is the force on an object that results from gravity, and is not the same as mass.
• Drag is a force directly related to the velocity of a moving object and which results from air resistance and acts to slow an object down.
• When the drag on a free falling object is equivalent to the weight of that object, the object maintains a constant velocity called terminal velocity.
The students’ teacher then described the following experiment:
The experimenter dropped a ball from a known height and recorded the time it took to hit the ground. In a second location, a second ball was dropped from the same height and the experimenter observed that it took a longer time to fall to the ground.
Providing no additional information, the teacher asked her three students to provide an explanation of the experimental conditions that would account for the different times it took the two balls to fall.
Student 1
Both trials were conducted in air with the same atmospheric properties. The balls had the same mass and weight, but the second ball had a larger radius and surface area. Therefore, the second ball was subjected to more drag and reached a lower terminal velocity than the first. This resulted in an increased fall time.
Student 2
Each ball had identical dimensions, but the first ball was made of a denser material giving it both greater mass and weight. Each ball was dropped through air with the same atmospheric properties. Since the second ball was subjected to less gravitational force and weighed less, it reached a lower terminal velocity compared to the first. Therefore, the second ball took more time to hit the ground.
Student 3
Both balls had the same dimensions and mass. The first ball was dropped above the Earth, while the second ball was dropped above the Moon. The first ball reached terminal velocity in the Earth’s atmosphere. The second ball was not subjected to any atmosphere or air resistance. However, there was substantially less gravitational force on the second ball and subsequently it weighed less than the first ball. The overall net result was that the second ball fell more slowly and took longer to hit the ground.
34. Based on Student 1’s explanation, the velocity of the first ball as it landed most likely equaled:
F. the product of acceleration of gravity and the time it took to fall.
G. the product of one-half the acceleration of gravity and the time it took to fall squared.
H. the velocity of the ball directly before it landed.
J. zero.
35. The teacher added another question to the students’ assignment: Suppose the experimenter repeated the experiment by dropping two balls at the same time from the same height in a single vacuum, where no air resistance was present. The balls have different dimensions but identical weights, and they hit the ground at the same time. This new result is consistent with the explanations of which student(s)?
A. Student 1 only
B. Student 2 only
C. Students 1 and 2 only
D. Students 1, 2, and 3
36. According to Student 1, which of the following graphs demonstrates the velocity of the two balls as time increases?
F. 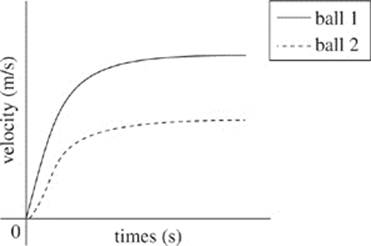
G. 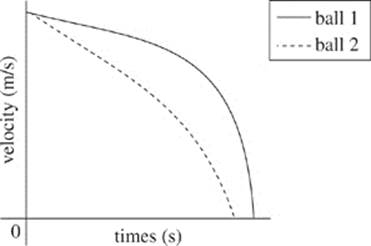
H. 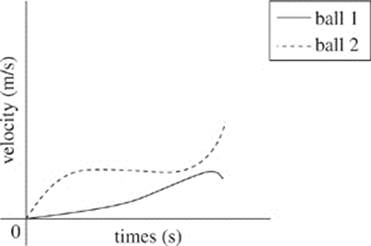
J. 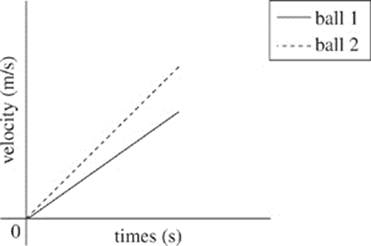
37. According to Student 1, did the surface area of the second ball have an effect on its terminal velocity?
A. Yes; as the surface area of a ball decreases, its terminal velocity decreases only.
B. Yes; as the surface area of a ball increases, its terminal velocity decreases only.
C. No; as the surface area of a ball increases, its terminal velocity decreases, then increases.
D. No; as the surface area of a ball increases, its terminal velocity is not affected.
38. Assuming that Student 3’s explanation is correct, once the second ball starts falling, does it reach terminal velocity?
F. Yes, because the weight of the ball was constant and drag force increased.
G. Yes, because the weight of the ball decreased and no drag force was present.
H. No, because the weight of the ball decreased and drag force was constant.
J. No, because the weight of the ball was constant and no drag force was present.
39. The 3 explanations of the motion of the balls are similar to each other in that all 3 explanations suggest that:
A. differences in the gravitational force are responsible for the change in falling times.
B. increases in velocity result from gravity.
C. drag plays only a small part in determining how long it takes an object to fall.
D. a lead ball would have fallen faster.
40. Based on the explanations of the 3 students, what did all 3 students assume about the first ball?
F. The velocity did not change.
G. The velocity increased only.
H. The velocity decreased only.
J. The velocity increased for a time, and then reached terminal velocity.
Science Practice
Section 2
Answers and Explanations
SCIENCE PRACTICE 2 ANSWERS
1. C
2. G
3. C
4. J
5. B
6. J
7. C
8. J
9. B
10. F
11. D
12. H
13. B
14. J
15. A
16. G
17. B
18. H
19. B
20. G
21. A
22. J
23. B
24. F
25. A
26. G
27. C
28. H
29. A
30. H
31. A
32. H
33. A
34. H
35. D
36. F
37. B
38. J
39. B
40. J
SCIENCE PRACTICE 2 EXPLANATIONS
1. C Look at Figure 1: The shallow boundary of the mesosphere lies somewhere in the outer mantle. The deep boundary lies at the interface between inner mantle and outer core, but the outer core is not included. This eliminates I and choices (B) and (D). The mesosphere includes only parts of the inner and outer mantle.
2. G A K-wave does not appear in Figure 1, and velocity data is not included in the passage, so choice (J) can’t work. Given that the waves have an average velocity of 3 m/s, they could either be L-waves or S-waves according to Table 1, and choice (H) should be eliminated. Between L-waves and S-waves, only S-waves can travel to a depth that spans the inner mantle as depicted in Figure 1, so eliminate choice (F).
3. C The bottom chart of Figure 2 refers to future probability. The percentage probability of a 6.5 magnitude earthquake is 70%, and that of a 7.5 magnitude earthquake is 32%. This is the only comparison among the answer choices that represents a decrease of more than one half.
4. J The likelihood of an earthquake of any particular magnitude refers to future probability as depicted in the bottom chart of Figure 2. This chart illustrates that as Richter scale magnitude increases, the probability of occurrence decreases. Therefore, an earthquake between Richter scale 7.0 and 7.5 has the lowest probability of occurrence.
5. B According to Figure 2, there were 31,860 Richter scale 5.5 earthquakes and 60,242 Richter scale 5.0 earthquakes in the past 30 years. Therefore, the ratio is 31,860/60,242, which is approximately 1/2.
6. J You need to determine which farm’s soil has the greatest number of living cells per mm3. To do that, look at Table 3. Farm 5 has the greatest number of living cells per mm3, so it must also consume the most oxygen. If you selected choice (F), be careful—you may have switched the information given in the question.
7. C The soil has all the water removed before it is heated to 500°C, so neither choice (A) nor (B) is correct. The reason the scientists heat the soil to 500°C for 20 minutes is to burn off all the organic matter. In other words, the minerals remain, and the organic matter disappears. Therefore, if there is little or no organic matter, there will be little or no change in mass of the soil.
8. J The mass of organic matter was determined by heating the sample to 500°C, removing the ash, and calculating the difference in mass before and after the heating. If any water had been present, it would have evaporated, and its mass would have been included in calculating the mass of organic matter. Including water in the initial weight would have made the estimation for the weight of the organic matter artificially high, which is correctly explained by choice (G).
9. B In Table 3, notice that as % organic matter increases, number of living cells per mm3 also increases. With 2,100 living cells per mm3, the hypothetical sample would fall somewhere between Farms 3 and 4. Therefore, the % organic matter should also fall between farms 3 and 4, or between 4.8 and 6.6%.
10. F Looking at the levels of nitrogen and iron in Table 2, we find that the amounts in the soil of Farm 5 (210 and 165, respectively) are the highest.
11. D At the end of the first paragraph in the passage, we find that a well-defined soil has similar levels of minerals, relative to the minerals’ ideal levels. In other words, you are looking for similar percentages in Table 2. The soil of Farm 4, with all values within 24 percent of each other, is the most well defined.
12. H Choice (H), 80 degrees Fahrenheit, is the only correct choice. To solve this question, draw a line from 30 minutes on the x-axis to the S3 curve, then a line from that point on the S3 curve to the y-axis. If you look where S3 is at 30 minutes and just estimate that point on the y-axis, you can see it is between 70°F and 90°F. Now look at the answers: 10°F is practically at the bottom of the axis, so it is much too low; 100°F is the very top of the y-axis, so much too high; 50°F is roughly in the middle, but not quite as high as it should be; 80°F is just about right.
13. B Figures 2 and 3 have an x-axis in common. Since this axis for both shows an increase in time mixture is allowed to stand, the y-axes are easy to compare. In Figure 2, the temperature of the water in the outer jar increases as the time allowed to stand increases. In Figure 3, the heat loss of S1 increases as the time allowed to stand increases. Therefore, as the temperature of water in the outer jar increases, the heat loss of S1 will also increase.
14. J According to the arrow on the right side of the graph, the Orderliness increases as the Heat loss increases. To compare the orderliness of the four mixtures, therefore, all you need to do is compare the heat loss of the four mixtures at the given point. Choice (J) correctly compares the temperatures of the four mixtures at 0 minutes. Because the mark at 15°F is higher than that of S1 or S3, the solution must be more orderly than S1 and S3, but because the mark is lower than S2, it must be less orderly than S2.
15. A Since you have no data about the behavior of heat in the string, you can eliminate choices (C) and (D). Look at the relationships given to you in choices (A) and (B), and note how those relationships correspond to those in Figure 2. In this figure, the sugar and water mixture decreases in temperature and the water outside the jar increases in temperature until the temperatures of the two things are equal. It must be the case, therefore, that the Mixture is losing heat and the Water Outside the Jar is gaining heat—in other words, heat is being conducted by some material from the Mixture to the Water Outside the Jar, choice (A).
16. G Choice (G) is correct because S2 reaches 100°F lost from the beginning temperature of 180°F at around 35 minutes standing, before S1 or S3. To solve this question, look at which line gets to 80°F earliest, which would indicate that the mixture has cooled from 180°F to 100°F.
17. B Note this from the passage: If an enzyme cannot be produced, then the product of the reaction that the enzyme catalyzes cannot be synthesized and the reactant in that reaction will become highly concentrated. In other words, if a particular chemical cannot produce the appropriate enzyme, that chemical then becomes highly concentrated. Look at Figure 1 to see which enzyme catalyses the reaction of which isocitrate is the reactant: Enzyme 2. Therefore, since yeast that cannot produce Enzyme 2 will have the highest concentration of isocitrate, choice (B) is the correct answer.
18. H The passage tells you that a gene notated with a superscript positive sign is not damaged and that a gene notated with a superscript negative sign is damaged. The passage tells you that if one of the four genes in Table 2 is damaged, then the enzyme it is responsible for cannot be produced. Therefore Cat1+ Cat2- Cat3- Cat4+ means that Enzyme 1 and Enzyme 4 can be produced and Enzyme 2 and Enzyme 3 cannot be produced, so the correct answer is choice (H).
19. B The passage tells you that in the first reaction, citrate is the reactant and isocitrate is the product. Based on this, you know that the reactant is what the arrow points away from and the product is what the arrow points to. Now, take a look at the relationship shown in Figure 1 between the three chemicals in the question (citrate, isocitrate, and α-ketoglutarate). You can see that α-ketoglutarate is a product of a reaction involving isocitrate, and isocitrate is a product of a reaction involving citrate, choice (B).
20. G Based on Table 1, you know yeast strain X grows in growth media where α-ketoglutarate, succinyl-CoA, and succinate are added, but cannot grow when citrate or isocitrate are added. This means that the succinate synthesis reaction pathway can happen only if α-ketoglutarate or any reactant after that in the pathway is added, so there is something which prevents the reaction pathway from proceeding from isocitrate to α-ketoglutarate. Therefore, choice (G) is the correct answer.
21. A A control is anything in a given experiment that is left alone. Note in Table 1 that BNS appears in all instances, once by itself and then with a number of chemicals added to it. It can be reasonably inferred, then, that the basic nutrition solution (BNS) alone is the control.
22. J To answer this question, figure out which strains of yeast have a Yes in the row where succinyl-CoA is the added chemical: strains W, X, and Y. Now, all you need to do is look at which other basic nutrition solution + additional chemical all three strains grew in. The only other medium that all three grow in as well is BNS + succinate, so choice (J) is the answer.
23. B Examine Figure 1: the incidence of virus A cycles annually with the greatest incidence around June and July of each year. Therefore, the incidence of virus A is greatest during the summer season.
24. F From Figure 1, the rate of incidence is least where the number of cases is least for the population. During April 2001, virus B and virus D exhibit the greatest number of cases. Therefore, answer choices (G) and (J) may be eliminated. Between viruses A and C, virus C exhibits the greater amount, which eliminates answer choice (H).
25. A Examine the data for viruses B and C closely in Figure 1. Virus B, unlike the other viruses, gradually increases in prevalence over the time of the survey. Virus C, however, cycles seasonally. During the first two months of the survey, the incidence of virus C exceeds that of virus B. Following February 2000, the incidence of virus B is consistently greater than that of virus C. Consequently, only answer choice (A) provides data that contradicts the virologist’s statement.
26. G Examine each of the months given as answers. During April 2000 and November 2001, the incidences of virus B and virus D are similar; however the incidences of virus A and C differ considerably. In contrast, during September 2000, three of the lines appear to meet at about 5 cases per 1,000 individuals surveyed with only one incidence value differing considerably. Answer choice (J) is similar to choices (F) and (H), in that only two lines appear to intersect. Therefore, answer choice (G) exhibits the most similar incidences of viral infection.
27. C Look at Figure 2: The number of deaths attributed to virus A is approximately 7 per 1,000 individuals during May and August. Looking at the number of deaths attributed to virus D during May and September, the number is approximately 2 per 1,000 individuals, which is consistent with the values given in the context of the question. Of the answer choices, only May is present as a choice. Therefore, the answer should be choice (C).
28. H The results of Experiment 2 are shown in Figure 3. Looking at the middle row for Solvent 2, the peak for Protein D is found at a distance of approximately 50 mm from the starting position.
29. A The data in Table 1 combined with the results shown in Figure 2 demonstrate that as the solvent pH decreases, the migration distance of Protein A decreases. For Solvent 1 (pH 8.9), Protein A migrated about 10 mm. A solvent with a pH of 8.4 is less than that of Solvent 1. Therefore, Protein A would be expected to migrate less than it did with Solvent 1.
30. H The isoelectric point of Protein L is closest to that of Protein C. Protein C appears between Proteins B and D in Table 1, Figure 1, and Figure 2. Since 6.6 is between the isoelectric points of Proteins B and D, the results would be most similar if Protein L replaced Protein C in the mixture.
31. A The more crowded the peaks appear, the lower the resolution. Therefore, the trials should display the most crowded plots. In each experiment, Solvent 2 produces intermediate resolution plots, so choice (C) can be eliminated. Solvent 1 always results in peaks that are close together, and Solvent 3 always results in peaks that are far apart in both experiments. Since you’re looking for the set of solvents with the lowest resolution, choice (A), which gives Solvent 1 in both experiments, is the best choice.
32. H The isoelectric point of Protein Y is between that of Proteins B and C. Given the data in Table 1 and Figure 2, the peak for Protein Y is expected to fall between that of B and C. This eliminates choices (G) and (J). Protein B always migrates less than Protein C in Figure 2, eliminating choice (F).
33. A In Figure 3, Protein B returns to 0% detection at approximately 35 mm for Solvent 2. Looking down at Solvent 3, a distance of 35 mm corresponds to 0% detection for Protein A.
34. H The explanation of Student 1 implies that both balls reach terminal velocity. Therefore, before the first ball lands, it is falling at a constant velocity, and its velocity a split second before landing would be the same as it lands, which would be choice (H). Choices (F) and (G) are based on formulas for velocity and displacement of projectiles which assume drag is negligible (no air resistance), which contradicts Student 1’s explanation. If the velocity were zero when it landed, the ball never would have collided with the earth, choice (J).
35. D By placing the two balls in a vacuum, it eliminates the effect of drag. This suggests that air resistance had an effect on the results, supporting Student 1. This eliminates choice (B). The new experiment also uses balls with identical weights, suggesting that weight can affect the results (even though this is really only true when air resistance is present), supporting Student 2. This eliminates choice (A). This experiment also placed both balls in the same location with the same force of gravity. This suggests that gravitational force can play a role and supports the views of Student 3. Only choice (D) indicates all students can potentially explain the new result.
36. F Choice (F) is better than choices (G), (H), and (J) because it matches Student 1’s description of the two balls by showing a slow increase in velocity that tapers off into a constant velocity, with the second ball having a lower terminal velocity than the first. Choice (G) shows velocities decreasing to zero. Choice (H) shows a very unusual trend, and while the velocity of the second ball is lower than that of the first, it does not match the description of Student 1. Choice (J) does not account for terminal velocity, and the velocity of the second ball is higher than that of the first, suggesting it would land first.
37. B Student 1 states a different surface area accounts for the difference in fall times, implying some effect and eliminating choices (C) and (D). Specifically, the student argues that the second ball has a greater surface area, which results in a lower terminal velocity, eliminating choice (A).
38. J Student 3 states that the second ball falls on the Moon where there is no atmosphere or air resistance. According to the introduction of the passage, drag force results from air resistance. Therefore, there is no drag force on the Moon, and choices (F) and (H) are eliminated. Weight is the force on an object that results from gravity and is constant, eliminating choice (G). Terminal velocity occurs only when there is a drag force equal and opposite to the weight of a free-falling object.
39. B Choices (A) and (C) are not supported by the claims of Student 1. Choice (D) is not supported by the experimental data. Choice (B) is correct because all 3 students assume that it is gravity that is increasing speed, but differences in the magnitude of gravity, or differences in drag, are the cause of the difference in falling times.
40. J Choice (F) would suggest that the ball does not move at all. All three students acknowledge some form of acceleration. Choice (G) does not take into consideration the concept of terminal velocity, and choice (H) suggests that the ball’s velocity would reach a negative number, as it starts at zero. Choice (J) acknowledges terminal velocity, and still explains that for all of the time that the ball has not reached terminal velocity, it is increasing.