1,296 ACT Practice Questions, 3rd Edition (2013)
ACT Practice Test 2
4. SCIENCE REASONING TEST
35 Minutes—40 Questions
DIRECTIONS: There are seven passages in the following section. Each passage is followed by several questions. After reading a passage, choose the best answer to each question and blacken the corresponding oval on your answer document. You may refer to the passages as often as necessary.
You are NOT permitted to use a calculator on this test.
Passage I
In recent years, the technology of magnetic levitation (“maglev”) has been investigated to provide an alternative rapid transportation option. Using repulsion of magnetic fields, maglev trains can be pushed forward at speeds of up to 300 miles per hour. One specific type of magnetic levitation currently being investigated is electrodynamic suspension (EDS).
In EDS, magnetic rods are located at the bottom of the maglev train and within the track underneath the train. An electric current can induce a magnetic field in the magnets of the track. If this magnetic field can be induced to repel constantly the magnet in the maglev train, then the train will maintain a distance above the track known as an “air gap” and move forward. Theoretically, the maglev train in EDS should travel at least 4 inches above the track, so there would be virtually no energy lost to friction. If the system does lose energy, it will be in the form of thermal energy.
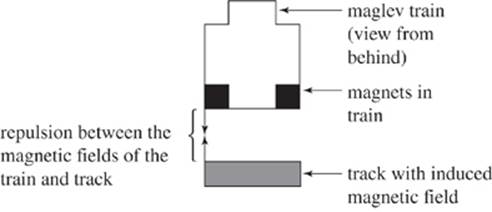
Figure 1
Under controlled conditions, scientists conducted tests on an experimental maglev track oriented in an east-to-west direction.
Study 1
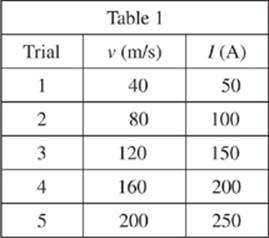
A maglev train with magnetic rods of fixed length was moved along the experimental track from east to west at various velocities v. The current I in the track required to induce these velocities was measured in amperes (A).
Study 2
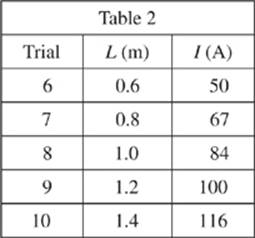
The maglev train was run in five trials with varying lengths, L, of the magnetic rods, and run at a constant velocity of 40 m/s. The current I in the track required to induce this velocity given the different lengths of the rods was recorded.
Study 3
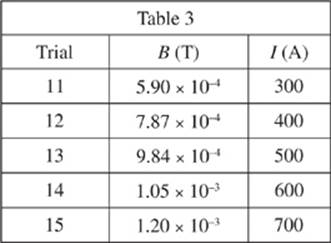
The magnetic field, B, measured in tesla (T), was varied in the maglev track. The current running through the maglev track was then measured in five new trials. Throughout these trials, the lengths of the magnetic rods and the maglev train velocities were kept constant.
Study 4
The maglev train with magnetic rods of fixed length was moved along the experimental track from west to east at various velocities, and the current in the track required to induce these velocities was measured. The magnetic field was kept constant for each of these trials.

1. In Study 1, I would most likely have equaled 500 A if v had been:
A. 40 m/s.
B. 125 m/s.
C. 200 m/s.
D. 400 m/s.
2. In Study 2, as the length of the magnetic rods in the maglev train increased, the amount of the current required to induce the train’s velocity:
F. increased only.
G. decreased only.
H. remained constant.
J. varied, but with no consistent trend.
3. In Study 3, I would most likely have equaled 570 A if B had equaled which of the following?
A. 6.00 × 10⁻⁴ T
B. 8.00 × 10⁻⁴ T
C. 1.00 × 10⁻³ T
D. 1.50 × 10⁻³ T
4. During each trial, an electrical current moves through the magnetic track because a nonzero voltage was produced in the track. During which of the following trials in Study 3 was the voltage greatest?
F. Trial 11
G. Trial 12
H. Trial 13
J. Trial 14
5. In which of the studies, if any, did the electrical current flow in the opposite direction as compared with the other studies?
A. Study 1 only
B. Study 4 only
C. Studies 1, 2, and 3 only
D. None of these studies
6. The results of Study 3 are best represented by which of the following graphs?
F. 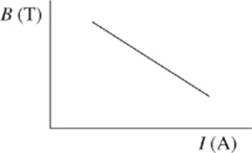
G. 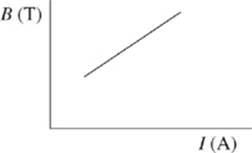
H. 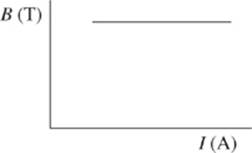
J. 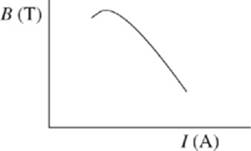
Passage II
Bats of the family Vespertilionidae (Vesper bats) are commonly found in North America. A guide for identifying Vesper bats found in Utah is presented in Table 1.
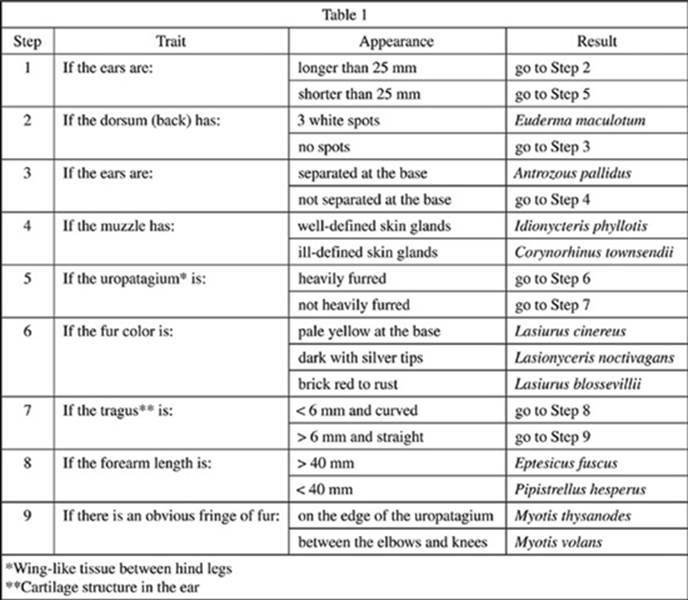
Students observed Vesper bats in a Utah nature reserve and recorded descriptions of them in Table 2.
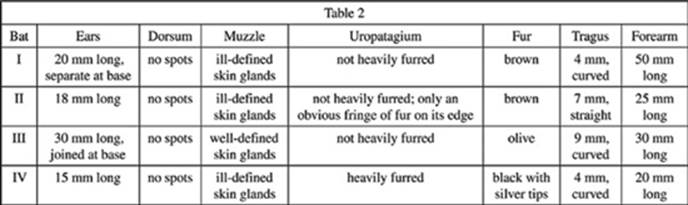
7. Based on the given information, which of the following characteristics distinguishes Bat IV from a Pipistrellus hesperus?
A. 4 mm and curved tragus
B. 15 mm long ears
C. 20 mm long forearm
D. Heavily furred uropatagium
8. Based on Table 1, Bats I and II share the same results through step:
F. 1.
G. 5.
H. 7.
J. 9.
9. Which of the following best describes the family Vespertilionidae?
A. Mammals
B. Protists
C. Lampreys
D. Birds
10. According to Table 1, Lasiurus cinereus and Lasiurus blossevillii could have all of the following traits in common EXCEPT:
F. ears not separated at the base.
G. 35 mm long ears.
H. a heavily furred uropatagium.
J. 20 mm long ears.
11. Based on Table 1, which of the following is likely to be most genetically similar to Bat II?
A. Lasiurus blossevillii
B. Idionycteris phyllotis
C. Lasionyceris noctivagans
D. Myotis volans
Passage III
A heater was placed in a room with a measured initial temperature of 0°C. The heater was set to heat the room to 25°C, and a mercury thermometer recorded the change of the air temperature in the room over time. This process was then repeated with the heater set to heat the room to 37°C and 50°C (see Figure 1).
Next, a cooling device was placed in a tank filled with 50°C saltwater. For three separate tests, the cooler was set to cool the water to 25°C, 10°C, and 0°C, respectively, while a mercury thermometer recorded the temperature of the saltwater over time (see Figure 2).
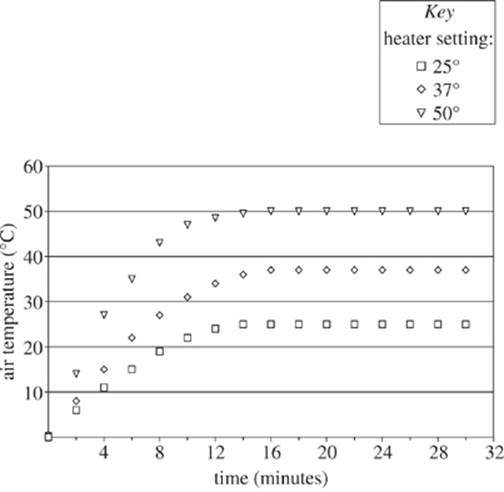
Figure 1
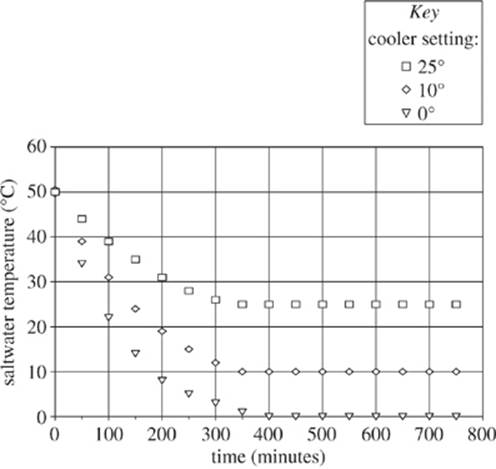
Figure 2
(Note: Assume that the temperature of the air was uniform throughout the room and that the temperature of the saltwater was uniform throughout the tank in all tests. Assume that at all times the heater and cooling device operated at full capacity.)
12. Based on the information presented in Figure 2, what was the most likely temperature of the saltwater in the 0°C setting at 220 minutes?
F . 52°C
G. 29°C
H. 17°C
J. 7°C
13. In the time interval from 8 minutes to 10 minutes, approximately how fast, in °C/min, was the temperature of the air changing when the heater was set to 37°C?
A. 0.5°C/min
B. 2°C/min
C. 27°C/min
D. 31°C/min
14. When the cooling device was set to 0°C, for which of the following time periods represented in Figure 2 was the temperature of the water changing most rapidly?
F. 0−100 min
G. 100−200 min
H. 200−300 min
J. 300−400 min
15. According to Figure 2, when the cooling device was set to 25°C, at which of the following times was the average kinetic energy of the thermometer’s mercury atoms the greatest?
A. 150 min
B. 350 min
C. 550 min
D. 750 min
16. Based on Figure 2, if another test were performed with the cooling device set to −10°C, approximately how long would it take for the saltwater to reach −10°C?
F. Greater than 400 min
G. Between 100 and 350 min
H. Between 10 and 50 min
J. Less than 10 min
Passage IV
Pepsin is an enzyme in humans that catalyzes the digestion of proteins, like the milk protein casein, into smaller subunits called peptides. Pepsin is active only in acidic solutions.
The researchers prepared a solution of casein, a solution of anserine (a small peptide), a solution of pepsin, and various buffer solutions (solutions maintaining a constant pH). The following experiments were conducted using these solutions.
Experiment 1
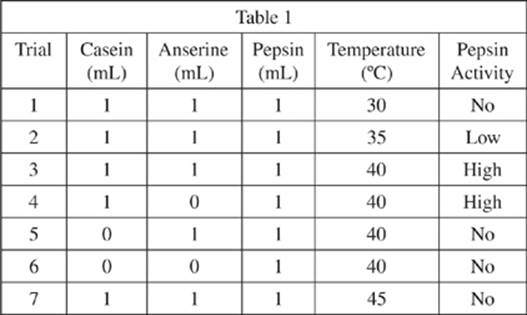
Seven solutions were prepared in test tubes using a 5 mL solution buffered to pH 3.0. Different amounts of casein, anserine, and pepsin solutions were added to each tube, and then diluted to 10 mL with the buffer solution, so that the final pH in each test tube would be 3.0. Each tube was incubated at a constant temperature for 15 minutes, and then was monitored to determine whether there was any activity by pepsin (see Table 1).
Experiment 2
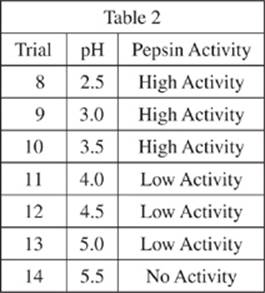
Seven solutions were prepared in test tubes according to the same procedure as in Trial 3 of Experiment 1, and each test tube was diluted with different buffer solutions of varying pH (see Table 2).
17. Pepsin is most likely to be found in which of the following organs?
A. Kidney
B. Heart
C. Stomach
D. Spinal cord
18. Suppose another trial had been performed in Experiment 2, and the results showed a high level of pepsin activity. Which of the following would be the most likely pH of the buffer solution used in this new trial?
F . 2.0
G. 4.0
H. 6.0
J . 8.0
19. Which of the following is the most likely reason that Trials 3 and 4 show high levels of pepsin activity while Trial 5 shows no pepsin activity?
A. Pepsin activity is dependent on both casein and anserine.
B. Pepsin activity is blocked by anserine.
C. Pepsin is able to digest casein, but not anserine.
D. Pepsin is able to digest anserine, but not casein.
20. According to the results from Experiment 1, which of the following trials are most likely to contain undigested casein?
F. Trials 1, 3, 4, and 7 only
G. Trials 1, 5, 6, and 7 only
H. Trials 1 and 7 only
J. Trials 5, 6, and 7 only
21. The experimental conditions for Trial 3 are most similar to those for which of the following trials?
A. Trial 9
B. Trial 11
C. Trial 13
D. Trial 14
22. According to the results from Experiments 1 and 2, which of the following best explains the relationship between pepsin activity, pH, and temperature?
F. Pepsin digests proteins at a fast rate when the pH is greater than 4.0 and the temperature is about 40°C.
G. Pepsin digests proteins at a fast rate when the pH is less than 4.0 and the temperature is about 40°C.
H. Pepsin digests proteins at a fast rate when the pH is greater than 3.0 and the temperature is about 30°C.
J. Pepsin digests proteins at a fast rate when the pH is less than 3.0 and the temperature is about 30°C.
Passage V
Chemical researchers studied the viscosity (a fluid’s resistance to flow) for several liquids. Highly viscous fluids take more time to flow through a vessel than do low viscous fluids. They measured the viscosity in centipoise (cP) (.01 grams per centimeter per second). Some solutions were treated with chemical additives before the fluids were heated. The results are shown in Figures 1−3.
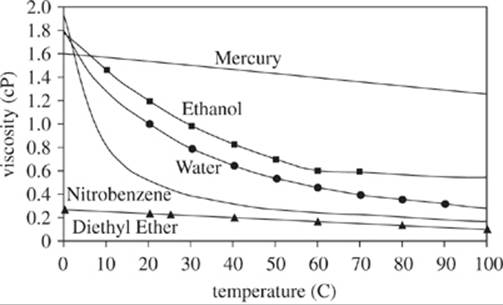
Figure 1
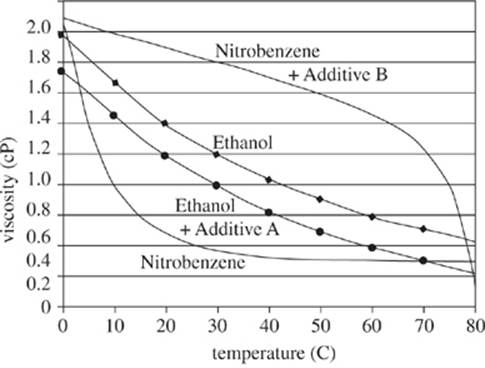
Figure 2
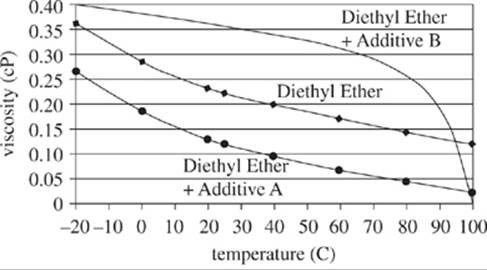
Figure 3
23. For which of the 3 figures did at least one sample fluid have a viscosity greater than 1.0 cP at a temperature of 0°C?
A. Figure 1 only
B. Figure 3 only
C. Figures 1 and 2 only
D. Figures 1, 2, and 3
24. According to Figure 2, for the sample that contained nitrobenzene without Additive B, the greatest decrease in fluid viscosity occurred over which of the following intervals of temperature change?
F. From 0°C to 10°C
G. From 10°C to 20°C
H. From 30°C to 40°C
J. From 40°C to 50°C
25. According to Figure 1, after water was heated to reach a temperature of 70°C, the viscosity was closest to which of the following?
A. 1.0 cP
B. 0.7 cP
C. 0.4 cP
D. 0.2 cP
26. Based on the information given, which of the following best describes and explains the experimental results presented in Figure 2? As the temperature increased, the time required for the sample fluids to flow out of their containers:
F. decreased, because heating the fluids increased each fluid’s viscosity.
G. decreased, because heating the fluids decreased each fluid’s viscosity.
H. increased, because heating the fluids increased each fluid’s viscosity.
J. increased, because heating the fluids decreased each fluid’s viscosity.
27. A researcher hypothesized that a solution of nitrobenzene treated with Additive A would have a lower viscosity at 60°C than would untreated diethyl ether at that same temperature. Do the results in the figures confirm this hypothesis?
A. Yes; according to Figure 2, at 60°C, nitrobenzene had a higher viscosity than did nitrobenzene treated with Additive B.
B. Yes; according to Figure 3, at 60°C, diethyl ether had a higher viscosity than did diethyl ether treated with Additive A.
C. No; according to Figure 2, at 60°C, nitrobenzene had a higher viscosity than did nitrobenzene treated with Additive B.
D. No; according to Figures 1−3, samples of nitrobenzene treated with Additive A were not tested for viscosity.
Passage VI
Earthquakes disrupt the infrastructure of buildings and dwellings by displacing the ground beneath them as a result of surface waves. The origin of an earthquake is known as the epicenter. Surface waves propagate from the epicenter outward and are directly affected by the density of the ground through which they propagate. As seen in Figure 1, the strength of the wave may be characterized into three distinct types: strong, moderate, and weak.
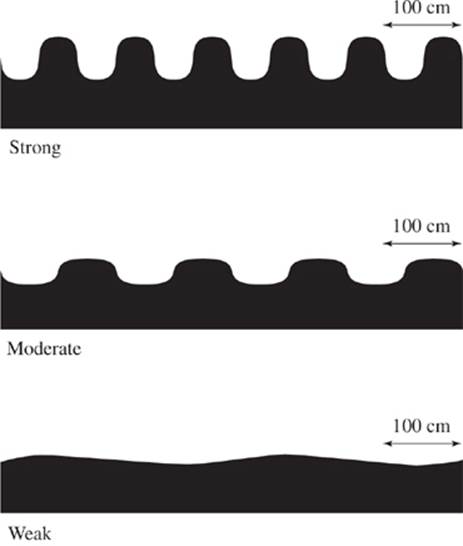
Figure 1
In order to study the effect of ground density on wave propagation, a seismologist has assembled a circular small-scale model with varying densities. Ground density and propagation duration were controlled in the experiment. In each study, earth and clay were laid down in a circular pattern with increasing density. Seismometers were positioned to detect the type of waves propagating at specific locations. A large speaker was placed 2 m below the surface of the epicenter to mimic an earthquake and each study was conducted over a period of 2 min with a fixed frequency of 10 Hz.
Study 1
The sound source was adjusted to 60 dB to mimic the impact of a magnitude 5 earthquake. The resulting waveform plot (exhibits wave type as a result of varying densities and distances from the epicenter) is shown in Figure 2.
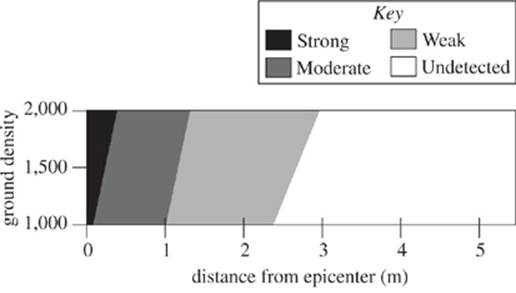
Figure 2
Study 2
Study 1 was repeated with the sound source adjusted to 80 dB to mimic the impact of a magnitude 7 earthquake. The resulting waveform plot is shown in Figure 3.
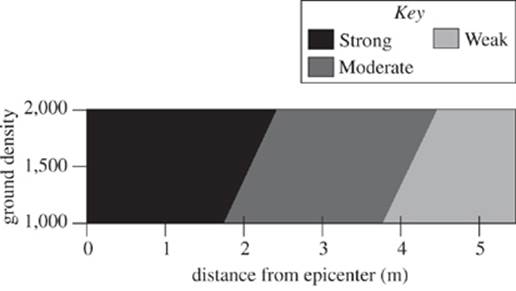
Figure 3
Study 3
The study was repeated with the sound source adjusted to 100 dB to mimic the impact of a magnitude 9 earthquake. The resulting waveform plot is shown in Figure 4.
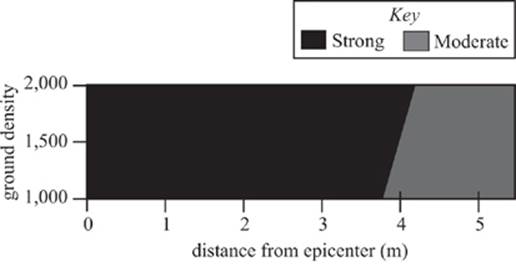
Figure 4
28. According to the results of Study 2, as the distance from the epicenter increases, the type of wave observed:
F. remained strong.
G. changed from strong to moderate.
H. changed from moderate to strong.
J. remained moderate.
29. According to the results of Studies 2 and 3, which of the following statements comparing the maximum distance from the epicenter for strong wave propagation and maximum distance for moderate wave propagation is true?
A. At all ground densities studied, the maximum distance from the epicenter at which strong waves may propagate was greater than the corresponding maximum distance from the epicenter at which moderate waves propagated.
B. At all ground densities studied, the maximum distance from the epicenter at which strong waves may propagate was less than the corresponding maximum distance from the epicenter at which moderate waves propagated.
C. For some of the ground densities studied, the maximum distance from the epicenter at which strong waves may propagate was greater than the corresponding maximum distance from the epicenter at which moderate waves propagated.
D. For some of the ground densities studied, the maximum distance from the epicenter at which strong waves may propagate was less than the corresponding maximum distance from the epicenter at which moderate waves propagated.
30. Which of the following factors in the seismologist’s studies was NOT directly controlled?
F. Sound intensity (in dB)
G. Ground density
H. Propagation duration
J. Wave type
31. Consider the relative wavelengths of a moderate wave and a weak wave, as shown in Figure 1. Which, if either, is less than 100 cm?
A. The wavelength of a moderate wave only.
B. The wavelength of a weak wave only.
C. Both the wavelength of the moderate wave and the wavelength of the weak wave.
D. Neither the wavelength of the moderate wave nor the wavelength of the weak wave.
32. Suppose Study 1 were repeated using a sound intensity of 70 dB. The resulting waveform plot would include which of the wave types referred to in the passage?
F. Strong only
G. Strong and weak waves only
H. Strong and moderate waves only
J. Strong, moderate, and weak waves
33. A study was conducted using a sound intensity between 75 dB and 85 dB. The minimum ground density where strong waves began propagating ranged from 1,000 kg/m3 to 2,000 kg/m3. Based on the information presented, the distance from the epicenter was most likely:
A. less than 2.5 m.
B. between 2.5 and 3.5 m.
C. between 3.5 and 4.5 m.
D. greater than 4.5 m.
Passage VII
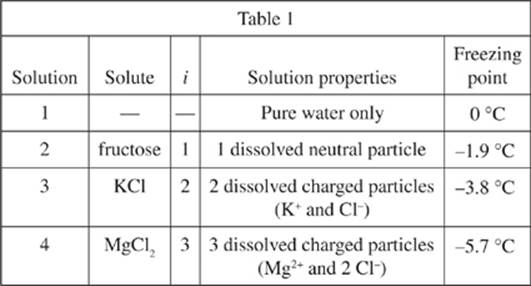
A solution results from dissolving a solute into a solvent. The van ’t Hoff factor (i) is the number of moles (1 mole = 6.02 × 10²³ entities such as molecules, ions, or atoms) of particles produced in solution for every 1 mole of solute dissolved.
The temperature at which a solution changes state from liquid to solid is the freezing point. Two scientists observed that the freezing point of H2O decreased after adding KCl to it. To explore this further, they conducted an experiment and each scientist provided separate explanations of the results.
Experiment
One mole each of fructose, KCl, and MgCl2 were separately dissolved in 1 kg of pure water. The concentration of each solution was thus 1.0 mole/kg. In addition, 1 kg of pure water only was placed in a fourth container. The containers were placed in a cooling device. The temperature was gradually decreased and the freezing point of each solution was recorded. The results are shown in Table 1.
Scientist 1
For a solvent to freeze, its molecules must arrange in an orderly fashion relative to each other. When a solute is added, the dissolved solute molecules are attracted to the solvent molecules by the intermolecular force of charge. The attraction of the solute particles to the solvent particles interferes with the orderly arrangement of solvent molecules, and the net effect is that the freezing point is lowered. This decrease in freezing point is related only to the charge of the solute particles and occurs with solutes that form charged particles in solution.
Scientist 2
The freezing point of a solvent is the temperature at which the liquid and solid states of that solvent have equivalent energetic potentials. Below the freezing point, the solvent has a lower energetic potential in the solid state. When a solute is dissolved in a solvent, the energetic potential of the liquid phase is decreased more than the energetic potential of the solid phase. Because of the different energetic potentials, it takes a larger drop in temperature for the liquid to freeze. Thus, the size of the decrease in freezing point is in direct proportion with the van ’t Hoff factor. This decrease in freezing point is related only to the concentration of particles, not to the identity or properties of each individual particle.
34. Based on the results in Table 1, how did the concentration of dissolved particles in Solution 4 compare with the concentration of dissolved particles in Solution 2? Solution 4 contained:
F. fewer particles in solution than did Solution 2, resulting in a lower freezing point.
G. more particles in solution than did Solution 2, resulting in a lower freezing point.
H. fewer particles in solution than did Solution 2, resulting in a higher freezing point.
J. more particles in solution than did Solution 2, resulting in a higher freezing point.
35. The freezing point of benzene is lowered with the addition of the solute naphthalene (C10H8), which has no charge. According to the information in the passage, this observation disagrees with the explanation provided by:
A. Scientist 1, who argued that only charged particles can have an effect on the freezing point of a solution.
B. Scientist 1, who argued that any solute is capable of increasing the stability of the liquid phase of a solvent.
C. Scientist 2, who argued that only charged particles can have an effect on the freezing point of a solution.
D. Scientist 2, who argued that any solute is capable of increasing the stability of the liquid phase of a solvent.
36. With which of the following statements about solutes would both scientists agree? Adding to a liquid a substance that has:
F. a positive or negative charge will decrease the liquid’s freezing point.
G. a positive or negative charge will increase the liquid’s freezing point.
H. no charge will decrease the liquid’s freezing point.
J. no charge will increase the liquid’s freezing point.
37. Suppose an experiment showed that adding the positively-charged solute NaClO4 to the solvent H2O but holding the concentration of the solution constant, the freezing point was significantly lower than an equally concentrated uncharged solution of NaClO4 in pure H2O. This finding would support the explanation(s) of which of the scientists, if either?
A. Scientist 1 only
B. Scientist 2 only
C. Both Scientists 1 and 2
D. Neither Scientist
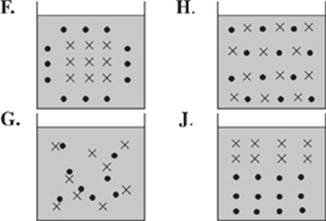
38. Of the following diagrams, which best illustrates how Scientist 1 would describe the results after a charged solute (•) has been added to H2O (×)?
39. Do the scientists offer different explanations for the impact of a solute’s physical properties, such as solute charge, on the decrease in freezing point of a solution?
A. Yes, Scientist 1 states that solute physical properties have an impact but Scientist 2 states they do not.
B. Yes, Scientist 2 states that solute physical properties have an impact but Scientist 1 states they do not.
C. No, both scientists state that solute physical properties have an impact on solution freezing point.
D. No, neither Scientist discusses the impact of solute physical properties on solution freezing point.
40. Assume the following for the addition of a substance to a pure liquid: k is a constant, ![]() T is the decrease in freezing point, and i is the van ’t Hoff factor. Which of the following equations is most consistent with Scientist 2’s explanation?
T is the decrease in freezing point, and i is the van ’t Hoff factor. Which of the following equations is most consistent with Scientist 2’s explanation?
F. ![]() T = k/i
T = k/i
G. ![]() T = ki2
T = ki2
H. ![]() T = k/i2
T = k/i2
J. ![]() T = ki
T = ki
END OF TEST 4
STOP! DO NOT RETURN TO ANY OTHER TEST.