McGraw-Hill Education ACT 2017 (2016)
Part III. STRATEGIES AND REVIEW
Chapter 6. ACT SCIENCE TEST: STRATEGIES AND CONCEPT REVIEW
The ACT Science Test measures the interpretation, analysis, evaluation, reasoning, and problem-solving skills that apply to the study of the natural sciences. The questions require you to recognize and understand the basic concepts related to the information contained within the passages, critically examine the hypotheses developed, and generalize from given information to draw conclusions or make predictions. The ACT Science Test includes seven passages, each followed by four to seven multiple-choice questions, for a total of 40 questions. You will have 35 minutes to complete the ACT Science Test. The content areas found in the passages are Biology, Chemistry, Physics, and Earth Sciences. You do not need to have advanced knowledge of these content areas; you only need to be able to interpret the data as it is presented and understand the scientific method and experimental design. All of the information you need to answer the questions is in the passages. Usually, if you’ve completed two years of science coursework in high school, you will have all of the background knowledge necessary to understand the passages and answer the questions correctly.
You may have to do some math on the ACT Science Test. You are not, however, allowed to use a calculator. Only basic arithmetic computation will be necessary to answer these questions. You can do math scratch work right on your test booklet.
The ACT Science Test has passages in three basic formats:
1. Data Representation These passages are mostly charts and graphs. The questions ask you to read information from them or spot trends within the data presented.
2. Research Summaries These passages explain the set-up of an experiment or a series of experiments and the results that were obtained.
3. Conflicting Viewpoints These passages are like the Reading Test passages. There are usually two scientists or two students who disagree on a specific scientific point, and each presents an argument defending his or her position while possibly attacking the other, conflicting position.
![]() GENERAL STRATEGIES AND TECHNIQUES
GENERAL STRATEGIES AND TECHNIQUES
Use the following strategies and techniques to answer the questions on the ACT Science Test more easily.
Prioritize
Given the time limit, you might end up working through only four or five of the seven passages. Choose the passages in the format you like most. If you are having a hard time making sense of the passage that you start with, move on to some less confusing material. The best way to know which passages to do first on test day is to practice ahead of time so that you can recognize the passages that are likely to give you the most points for the time that you put in.
Remember that you will likely see three Data Representation passages, three Research Summary passages, and one Conflicting Viewpoints passage. If charts, graphs, tables, and so on create stress for you, look for the Conflicting Viewpoints passage and start with those questions. If you establish a pattern of success, that is, start out by answering questions correctly and building your confidence, then the remaining passages won’t seem so overwhelming.
Think First
Once you have chosen a passage to attack, take a moment or two to understand the main idea or ideas presented before you dig into the questions. Unlike those on the Reading Test, these questions are not likely to add anything to your understanding of the passages. Reading them first will be likely to confuse you. Common sense will help to keep you from being fooled by some of the distractors that are “way off.” For instance, if the passage is describing an experiment done with live mammals in a laboratory, and the question asks about temperatures that are likely to result in a certain behavior, you could certainly rule out an answer choice that says, “400° Fahrenheit.”
Exam Tip
The ACT Science Test is not strictly a science test! It is a critical thinking test, so do not worry if you think you are “not good at science.”
Consider the following example:
Radon gas can seep from the ground into an existing home through many different pathways, such as cracks in the basement floor, drains, sump pumps, or loose-fitting pipes.
Table 1 shows the radon levels in pCi/L for each of three zones, with areas in Zone 1 indicating a High Radon Potential, areas in Zone 2 indicating a Moderate Radon Potential, and areas in Zone 3 indicating a Low Radon Potential.
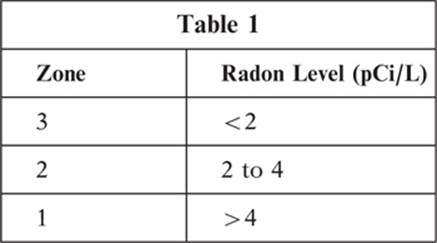
1. Studies have shown that existing homes in the same zone can have different radon levels. Are these findings consistent with information presented in the passage?
A. No, because radon levels cannot be measured in existing homes.
B. No, because radon seeps into all homes in the same way.
C. Yes, because the occurrence of radon is very rare.
D. Yes, because radon levels can vary within the same zone.
The correct answer is D. The introductory paragraph and the table both suggest that radon levels can be different—homes with basement cracks might be more likely to have a radon problem than those homes without basement cracks, for example. Logic will tell you that you can eliminate answer choices A and B. Because answer choice C is not supported by details in the passage, it can also be eliminated.
Be “Trendy”
Many of the Science questions reward test-takers who can spot trends in the data presented. When charts or graphs are given, take a moment to figure out which variables are being charted and note any apparent relationships between them. A direct relationship is when one variable increases as the other increases. An inverse relationship is when one variable decreases as another increases. Sometimes drawing arrows next to the data helps to show a pattern of increase or decrease.
Consider the following example:
The molar heat of fusion (ΔHfus) is the amount of heat necessary to melt (or freeze) 1.00 mole of a substance at a constant pressure.
The following table lists molar heats of fusion, boiling points, and melting points for several elements.
1. According to the table, as the energy required to melt 1.00 mole of the given elements increases, the melting points:
A. increase only.
B. decrease only.
C. increase then decrease.
D. neither increase nor decrease.
The correct answer is C. The passage states that, “The molar heat of fusion (AHfus) is the amount of heat necessary to melt (or freeze) 1.00 mole of a substance at a constant pressure.” According to the table, as the molar heat of fusion increases, the melting point increases from calcium, to silver, to iron, then decreases for nickel. By noticing a trend in the data, the question becomes easier to answer correctly.
Don’t Let Them Scare You with Complex Vocabulary
There will certainly be language on the Science Test that is new to you. Don’t be worried by words that you have never seen before. The ACT usually defines terms that are absolutely essential to your understanding. You can answer questions about some terms without even knowing exactly what they mean as long as you focus on the overall idea of the passage. Never spend time trying to figure out how to pronounce any of the unfamiliar terms that you run across. This is simply a waste of time and energy.
Consider the following example:
The order Lepidoptera includes butterflies and moths. Table 1 is a key for identifying some Lepidoptera in North America.
1. Table 1 is used to identify animals that belong to which of the following groups?
A. Birds
B. Reptiles
C. Insects
D. Mammals
The correct answer is C. You are given that “The order Lepidoptera includes butterflies and moths. Table 1 is a key for identifying some Lepidoptera in North America.” Because butterflies and moths are not birds, reptiles, or mammals, they must be insects. Even though you might never have seen the word Lepidoptera before, you can still correctly answer the question because the term is defined for you.
The rest of this chapter will provide an overview of the Scientific Method, a brief review of basic scientific concepts, an introduction to the types of questions you will see on the ACT Science Test, and sample questions with explanations.
![]() THE SCIENTIFIC METHOD
THE SCIENTIFIC METHOD
The Scientific Method is the process by which scientists attempt to construct an accurate representation of the world. This process is fundamental to scientific investigation and acquisition of new knowledge based upon actual physical evidence and careful observation. The Scientific Method is a means of building a supportable, documented understanding of our world.
The Scientific Method includes four essential elements:
1. Observation
2. Hypothesis
3. Prediction
4. Experiment
During the observation phase, the experimenter directly observes and measures the phenomenon that is being studied. Careful notes should be taken and all pertinent data should be recorded so that the phenomenon (the thing observed) can be accurately described.
The experimenter then generates a hypothesis to explain the phenomenon. He or she speculates as to the reason for the phenomenon based on the observations made and recorded.
Next, the experimenter makes predictions to test the hypothesis. These predictions are tested with scientific experiments designed to either prove or disprove the hypothesis. The Scientific Method requires that any hypothesis either be ruled out or modified if the predictions are clearly and consistently incompatible with experimental results.
If the experiments prove the hypothesis, it may come to be regarded as a theory or law of nature. However, it is possible that new information and discoveries could contradict any hypothesis at any stage of experimentation.
Exam Tip
The passages included on the ACT Science Test have been written with the Scientific Method in mind. You can often use common sense along with a basic understanding of the process to answer many of the questions.
Experimental Design
When scientists design experiments to test their hypotheses, they have to be careful to avoid “confounding of variables.” This means that they have to isolate, as much as possible, one variable at a time so that they can reveal the relationships between the variables, if any. An independent variable (manipulated by the experimenter) is under the control of the scientist. As the scientist changes the independent variable, it is hoped that the dependent variable(observed by the experimenter) will change as a result, and that a relationship can be established. A control is an element of the experiment that is not subjected to the same changes in the independent variable as the experimentalelements are. For instance, if we want to find out how the consumption of sugar impacts the fatigue level of ACT takers, we would need at least a few ACT takers who do not consume any sugar so that we can measure the “baseline” or “natural” fatigue level of ACT takers for comparison to the group who consumes sugar. If there were no control group, we wouldn’t be able to say for sure that sugar has any impact on the fatigue level of ACT takers. If all of the test-takers consumed sugar, and if all of them were sleepy, we would face a confounding-of-variables situation because the sleepiness could be caused by any other factor that the group had in common, like the ACT itself!
Some of the ACT Science Passages refer to “studies” rather than experiments. An experiment is an artificial situation that is created by the researcher. A study is characterized by careful, documented observation. Nevertheless, studies can include some of the elements of experiments, such as control groups.
Exam Tip
Sugar does cause increased fatigue levels after the initial “sugar buzz” wears off. It is best to avoid it before your ACT exam.
![]() ACT SCIENCE TEST EXERCISES
ACT SCIENCE TEST EXERCISES
The next few pages contain exercises designed to help you apply the concepts generally tested on the ACT Science Test. Remember that this test does not require much knowledge of science. You can get a high score by applying logic and common sense to interpreting trends in the data and thinking about the questions being asked.
Exercise 1
You will tackle the ACT Science Test questions with more confidence if you have a basic understanding of the experimental process. The following set of questions will test your knowledge of the best steps to take in setting up an experiment using this process. Write your answers in the space provided.
Sally decides to enter her school’s science fair. She has always loved flowers and wants to incorporate them into her project. In the end, Sally decides to test the effectiveness of different types of plant food (fertilizer) on a certain type of rose bush. Her goal is to determine which fertilizer produces the tallest rose bushes with the greatest number of flowers.
1. Describe how Sally might set up her experiment. Discuss the actions Sally should take to get reliable data.
2. What are the independent and dependent variables in Sally’s experiment, and how should she deal with them?
3. What is the best way for Sally to organize, interpret, and present her data?
The results of Sally’s experiment are recorded on the graphs below.
Questions 4–7 refer to the following figures. Place an “X” next to the correct answer.
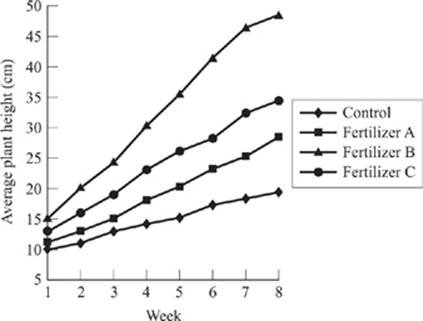
Figure 1
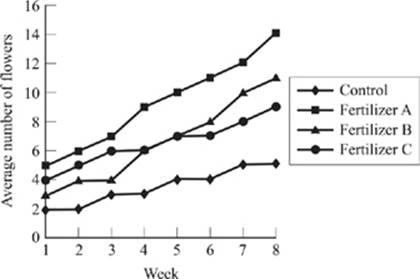
Figure 2
4. Based on Figure 1, which fertilizer affected plant height the most?
___ Fertilizer A
___ Fertilizer B
___ Fertilizer C
___ All were equally effective.
5. At 5 weeks, about how much taller, on average, were the plants receiving Fertilizer B compared to those not receiving any fertilizer?
___ 15 cm
___ 20 cm
___ 30 cm
___ 35 cm
6. Which of the following statements is supported by the data in both figures?
___ Fertilizer type has little effect on the number of flowers produced.
___ Fertilizer helped the plants to grow taller and produce more flowers.
___ The control group received more fertilizer than any other group.
___ Fertilizer A yielded the tallest plants with the most flowers.
7. During which 2 weeks did Fertilizer B and Fertilizer C yield the same average number of flowers?
___ Weeks 1 and 2
___ Weeks 3 and 4
___ Weeks 4 and 5
___ Weeks 7 and 8
Exercise 2
The ACT Science Test includes data represented in charts, tables, and graphs. Answer the questions below, identifying and explaining general trends in the data.
Questions 1–4 refer to the following table. Write your answers in the spaces provided.
1. How many butterflies were collected at Site 3 on Wednesday? ________
2. What is the greatest number of butterflies collected on any one given day? ________
3. At which site were the fewest butterflies collected on Friday? ________
4. Which site shows a constant increase in the number of butterflies collected daily throughout the week? ________
Questions 5–8 refer to the following graph. Place an “X” next to the correct answer.
5. During which of the following one-year spans were there fewer than 10 electrical impulse events in all?
___ 1923–1924
___ 1925–1926
___ 1926–1927
___ 1930–1931
6. Which of the following one-year spans showed the highest number of electrical impulse events overall?
___ 1922–1923
___ 1923–1924
___ 1924–1925
___ 1925–1926
7. How many electrical impulse events occurred from 1923 through 1925?
___ 6
___ 11
___ 18
___ 25
8. During which year were no electrical impulse events recorded?
___ 1922
___ 1925
___ 1927
___ 1928
Questions 9–12 refer to the following figure. Write your answers in the space provided.
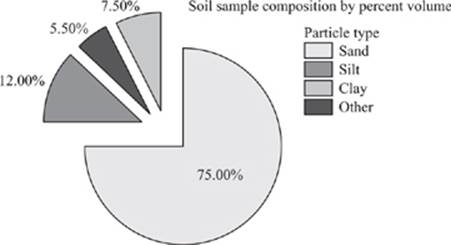
9. According to the figure, what percent of the soil sample’s volume is composed of sand? ________
10. According to the figure, sand and silt together comprise what percentage of the soil sample? ________
11. Which particle type’s volume comprises the least portion of the soil sample volume? ________
12. A certain plant will only grow in soil that is composed of at least 25% silt or clay or a combination of the two. Will this plant grow in the soil sampled? ________
![]() ANSWERS AND EXPLANATIONS
ANSWERS AND EXPLANATIONS
EXERCISE 1
1. Sally must design an experiment that will allow her to evaluate the effectiveness of several different fertilizers. In order to do this, she needs a group of plants for each of the different fertilizers to be used, and an additional control group. The control group should be grown in the absence of any fertilizer: this way Sally can compare the results from the other groups to the control group to measure the effectiveness of the fertilizers. For example, if the control group produces 3 flowers per plant and the Fertilizer A plant produces 6 flowers per plant, Sally will know that Fertilizer A benefited the plant. She should measure the number of flowers per plant and the height of each plant in each group at a set of specific time intervals. More measurements will typically lead to more accurate results.
2. There are several independent variables that must be controlled to conduct an accurate experiment. For example, Sally must account for differences in individual plants, distribution of fertilizer, distribution of water, and exposure to sunlight. In order to control plant type, the same species of plant should be used in each experiment. Having multiple plants per group and averaging data can control the differences in individual plants. Sally should use equal amounts of fertilizer, water, and light for each group. In addition, the plants need to receive the fertilizer, water, and light at the same time each day.
There are two dependent variables: the number of flowers and the height of the plant. These represent the data she is trying to collect.
3. Sally should first record her data in a table. Tables are ideal for organizing numerical data. In order to better interpret and present her findings to a wide audience, Sally would benefit from a set of graphs. Since the data is a representation of growth and flower number over time, line graphs would work best. With a line graph, Sally can see the progress of a particular fertilizer over time as well as compare its effectiveness to the other fertilizers and the control group.
4. To answer this question, you should look at Figure 1 and compare the plant heights in Week 1 to the plant heights in Week 8. You can see that the line representing the height of the plants that received Fertilizer B is very steep, which indicates the greatest amount of change. The plants that received Fertilizer B grew about 30 centimeters from Week 1 to Week 8.
5. According to Figure 1, the plants that received Fertilizer B had an average height of about 33 centimeters at 5 weeks, whereas the plants in the control group (those not receiving any fertilizer) had an average height of about 13 centimeters at 5 weeks. Therefore, the plants receiving Fertilizer B were, on average, about 20 centimeters taller than the plants receiving no fertilizer.
6. The data in both figures shows that plants receiving fertilizer grew taller on average and produced more flowers on average than did the plants in the control group. This supports the statement that the application of fertilizer yields taller plants with more flowers.
7. To answer this question, find the spot on Figure 2 at which the lines representing Fertilizers B and C intersect; this is the point at which the data is identical. Because the lines intersect at Week 4 and Week 5, those are the weeks during which the plants receiving Fertilizer B and C produced the same average number of flowers.
EXERCISE 2
1. To answer this question, find the column representing Site 3 and follow it down until it intersects with the row representing Wednesday. You will see that 58 butterflies were collected at Site 3 on Wednesday.
2. To answer this question, find the largest number in the table, disregarding the totals because the question asks about a single day. There were 60 butterflies collected on Friday at Site 3, which is more than any other day.
3. To answer this question, find the row representing Friday and then locate the smallest number in the row. Next, look at the heading of the column that corresponds to that small number. The table shows that 52 butterflies were collected at Site 1 on Friday, fewer than from any other site.
4. To answer this question, find the column that shows a continual increase from Monday through Friday in the number of butterflies collected. Only Site 3 fits this criterion. The other sites do not show a constant increase in the number of butterflies collected throughout the week.
5. To quickly answer this question you can look at the graph and note that from 1930 to 1931, there were no electrical impulse events. Because there will never be more than one correct answer, you can assume that each of the other choices includes 10 or more electrical impulse events. Look at the span indicated in each of the answer choices and count the total number of electrical impulse events:
1923–1924: there were a total of 12 electrical impulse events.
1925–1926: there were a total of 17 electrical impulse events.
1926–1927: there were a total of 10 electrical impulse events.
1930–1931: there were a total of 0 electrical impulse events.
6. Remember to note the number of electrical impulse events represented by each bar on the graph; you cannot simply count the number of bars to find the correct answer to this question. Look at the span indicated in each of the answer choices and count the total number of electrical impulse events:
1922–1923: there were a total of 3 electrical impulse events.
1923–1924: there were a total of 12 electrical impulse events.
1924–1925: there were a total of 6 electrical impulse events.
1925–1926: there were a total of 17 electrical impulse events.
Therefore, the span from 1925–1926 showed the highest overall number of electrical impulse events.
7. Remember to note the number of electrical impulse events represented by each bar on the graph; you cannot simply count the number of bars to find the correct answer to this question. From 1923–1924, there were a total of 12 electrical impulse events, and from 1924–1925, there were a total of 6 electrical impulse events. Thus, a total of 18 electrical impulse events occurred from 1923 through 1925.
8. According to the graph, between 1927 and 1928 (in other words, during 1927) no electrical impulse events were recorded. You need to look at the entire span of the year, not just at the hash mark that represents the beginning of each year.
9. To answer this question, find the representation of sand on the key. According to the pie chart, sand represents 75% of the soil sample.
10. To answer this question, find the representation of sand and silt on the key. According to the pie chart, sand represents 75% of the soil sample and silt represents 12% of the soil sample. Therefore, together they represent 75% + 12%, or 87% of the soil sample.
11. To answer this question, first find the smallest “slice of the pie.” The pie chart shows that 5.5% of the sample is made up of something other than sand, silt, or clay; therefore, you should now look for the next smallest “slice.” When you do this, you see that clay makes up only 7.5% of the soil, less than either silt or sand.
12. The plant will not grow in the soil sampled because, according to the pie chart, the total percentage of silt and clay is only 19.5% (12% + 7.5%).
![]() PRACTICE QUESTIONS
PRACTICE QUESTIONS
Following are simulated ACT Science passages and questions, along with explanations for all of the questions. Carefully read the directions, apply the information from this chapter, and attempt all of the questions. Preceding each of the passages is a description of the passage type.
DIRECTIONS: There are three passages in this Practice section. Each passage is followed by several questions. After reading a passage, choose the best answer to each question. Circle the letter of the answer you choose.
Data Representation
Data Representation passages present scientific information in tables, charts, graphs, and figures similar to those you might find in a scientific journal or other scientific publication. The questions associated with Data Representation passages will ask you to interpret and analyze the data shown in the tables, charts, graphs, and figures. The following is a Data Representation passage and several questions. The answers and explanations are at the end of this chapter.
PASSAGE I
Soybeans have been bred to exhibit a hereditary association of several characteristics: flower color, leaf shape, the color of the hypocotyls (the part of the seedling that is below the seed leaf), plant height, and pod length. Some of these characteristics, or traits, are considered qualitative, because the trait is influenced by only a few genes. Other traits are considered quantitative, because they show continuous variation, and are influenced by a number of genes. Alternative versions of a gene are called alleles. The dominant and recessive alleles for each soybean characteristic are displayed in Table 1. Dominant alleles are visible traits that mask all other traits, and they are more likely to be passed along from one generation to the next. Recessive alleles are hidden characteristics that are masked by dominant alleles. A soybean plant may carry a recessive gene, whose traits will show up only in later generations.
Figure 1 (next page) is an illustration of how some of the genetic traits may be passed from 1 generation of soybean plants to the next. Each parent passes only 1 trait on to successive generations. The plants are numbered consecutively within each generation.
Figure 1
1. Based on Figure 1, what is the relationship between
Plant 1 and Plant 2 in the second generation?
A. Plant 1 is dominant over Plant 2.
B. Plant 1 is recessive to Plant 2.
C. Plant 1 and Plant 2 are members of the same generation.
D. Plant 1 and Plant 2 both have green hypocotyls.
2. In row F2, green hypocotyls appear in the offspring for the first time. Which of the following is the most reasonable explanation for this?
F. None of the other offspring of generation F2 inherited the gene.
G. The members of generations P1 and F1 do not carry the gene.
H. The gene for green hypocotyls is recessive.
J. The gene for purple hypocotyls is recessive.
3. Based on Table 1, a soybean with purple flowers and round leaves will most likely:
A. pass those traits on to later generations.
B. not be able to pass on qualitative traits.
C. yield offspring with white flowers and narrow leaves only.
D. only be able to pass on quantitative traits.
4. According to the passage, plant height is most likely considered a quantitative trait because:
F. plant height is a recessive characteristic in soybean plants.
G. all soybean plants are short.
H. quantitative traits are dominant over qualitative traits.
J. plant height varies over the lifespan of the soybean plant.
Research Summaries
Research Summary passages provide descriptions of one or more related experiments or studies. The passages usually include a discussion of the design, methods, and results of the experiments or studies. The corresponding questions will ask you to comprehend, evaluate, and interpret the procedures and results. The following is a Research Summary passage and several questions. The answers and explanations are at the end of this chapter.
PASSAGE II
Water pressure influences the rate at which water flows. As water pressure increases, so does the rate of flow. Water pressure can be defined as the amount of force that the water exerts on the container it’s in. The more water that is in the container, the greater the water pressure will be. Students conducted the following experiment.
Experiment
Students used push pins to punch holes in an empty, plastic 2-liter bottle. The students created 4 holes, each 1-inch apart, from top to bottom. The pins were left in each hole as it was created. The bottle was filled to the top with water and placed on a table. An 8-inch by 9-inch pan with a piece of blotting paper was placed lengthwise in front of the bottle. A ruler was placed in the pan to measure the spot at which the water stream touched the paper. The students removed the pin nearest the top of the bottle and marked the spot where the water stream touched the paper. The pin was then replaced, the bottle was filled to the top, and the next pin was removed. The spot where the water stream touched the paper was measured. Rate of flow was indicated by the length of the water stream. This was repeated a total of 4 times, once for each pin. The results are recorded in Table 1.
5. Based on Table 1, water pressure is greatest:
A. at the top of the full container.
B. at the bottom of the full container.
C. when the water stream is 1.5 inches long.
D. when the water stream is 3.0 inches long.
6. Which of the following is an assumption that the students made prior to beginning the experiment?
F. Water pressure has no effect on the length of the water stream produced.
G. The rate of flow cannot be accurately determined using push pins and plastic bottles.
H. The rate of flow corresponds directly to the length of the water stream produced.
J. Water pressure and rate of flow are the two most important characteristics of water.
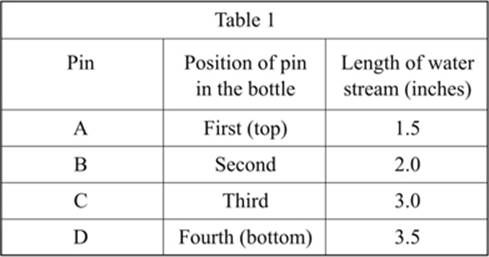
7. Which of the following graphs best represents the relationship between water presssure and rate of flow, according to the passage?
A. 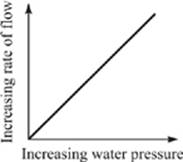
B. 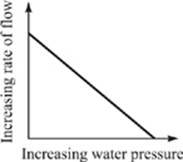
C. 
D. 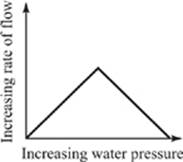
8. Based on the results of the experiment, removal of Pin C:
F. created a 3.5-inch water stream.
G. caused the bottle to empty more quickly than did removal of Pin D.
H. increased the total water pressure in the bottle.
J. created a 3-inch water stream.
9. Suppose that the students removed the pins in order, replaced each pin after measuring the water stream, but did not refill the bottle after removing and replacing each pin. According to the passage, the water stream lengths would most likely:
A. be identical to the first experiment.
B. increase for each pin removed.
C. decrease continually after removal of the first pin.
D. be equal for each pin removed.
Conflicting Viewpoints
Conflicting Viewpoints passages provide information on more than one alternative hypothesis or theory related to an observable event or phenomenon. The viewpoints presented are usually inconsistent with one another. Questions associated with Conflicting Viewpoints passages ask you to comprehend, evaluate, and compare differing hypotheses and theories. The following is a Conflicting Viewpoints passage and several questions. The answers and explanations are at the end of this chapter.
PASSAGE III
The idea that complex life exists on planets outside of our solar system has been debated for decades. Two scientists present their viewpoints regarding the possibility of life on planets other than Earth.
Scientist 1
Earth is the only model of planetary life about which we know. Therefore, a determination about what is universal about the formation of life is almost impossible to make. It is highly unlikely that planets with characteristics that enable them to support complex life are also located in zones of solar mass stars that are habitable for complex life. Even if such a planet existed, it is doubtful that a planet outside of our solar system could remain within secure orbits for any real length of time. Even then, if a planet were to be located in a place that could spawn or sustain complex life, that planet might not have the characteristics of Earth that make complex life possible. The factors that enable complex life to exist on Earth include planetary mass and the abundance of water, carbon, and oxygen. These factors are essential for the existence of complex life as we know it. In addition, if one takes into account planetary disasters, the possibility of complex life decreases. Therefore, there is little or no chance for complex life existing or having existed on other planets or worlds.
Scientist 2
Earth has select properties that allow it to sustain complex life. However, it is not impossible that there is another set of characteristics and properties that together are also able to support complex life. Although free oxygen is essential to complex life on Earth and has not been found elsewhere, complex life-forms outside our solar system may use another gas for respiration. In addition, complex or intelligent life may not appear simultaneously. One complex life-form might never discover or know about a life-form that existed before or after the extinction of the first life-form. Studies suggest that 95% of known stars in space appear to have systems very similar to ours. This is very encouraging to those who believe that other complex life currently exists or has existed on planets other than Earth.
10. If the arguments of Scientist 1 are correct, which of the following statements about complex life is most accurate, according to the information in the passage?
F. The possibility of development or existence of complex life is affected by many factors.
G. Complex life is dependent on the balance of oxygen, carbon dioxide, and neon gas.
H. Complex life will most certainly exist if a planet is located in the correct place and has the proper assortment of elements and traits.
J. It is unlikely that complex life-forms will ever exist on a planet other than Earth, because 95% of star systems are similar to our solar system.
11. Which of the following issues is raised by Scientist 1, but NOT by Scientist 2?
A. The presence of oxygen is required for complex life to exist on Earth.
B. Most of the known stars appear to have planetary systems similar to that of Earth.
C. Planetary disasters could account for the lack of complex life on other planets.
D. Complex life may not appear simultaneously on planets in different solar systems.
12. Studies have shown that a planet existed that was almost identical to Earth and was located in a place that was conducive to complex life. However, there are no signs that complex life existed. What explanation might Scientist 1 give, based on the information presented in the passage?
F. Ninety-five percent of the stars near this planet had planetary systems that contained complex life.
G. Planetary disasters might have eliminated or prevented complex life.
H. The planet had an overabundance of carbon, oxygen, and water.
J. The complex life-forms that would have inhabited this planet used another gas for respiration.
13. According to the passage, Scientist 2 would agree with which of the following statements, if true?
A. Planetary disasters are the primary reason for the existence of complex life on other planets.
B. Five percent of stars in the universe have systems identical to our own.
C. Free oxygen is not essential to the existence of complex life on other planets.
D. All complex life-forms will eventually discover one another.
14. Both Scientist 1 and Scientist 2 would agree with which of the following statements, if true?
F. Oxygen is necessary for the existence of complex life on Earth.
G. Planets outside of our solar system are not likely to maintain orbits secure enough for complex life.
H. Complex life-forms are likely to exist or have existed on other planets.
J. Complex life-forms are able to easily withstand planetary disasters.
15. Humans on Earth have yet to find another form of complex life on another planet. Scientist 2 would probably account for this by maintaining that:
A. complex life-forms probably do not exist because other planets do not have the same characteristics and properties as Earth.
B. complex life may have existed on other planets before the existence of humans on Earth.
C. complex life has not been found because we have yet to find stars with a system similar to ours.
D. complex life will only emerge when humans on Earth can survive without water and oxygen.
![]() ANSWERS AND EXPLANATIONS
ANSWERS AND EXPLANATIONS
1. The correct answer is C. Based on Figure 1, Plant 1 and Plant 2 in row F2 both have purple hypocotyls, so you cannot conclude that one is dominant over the other. Eliminate answer choices A, B, and D. Since row F2 signifies the second generation of plants, both Plant 1 and Plant 2 are members of the same generation, answer choice C.
2. The correct answer is H. The passage states that a “soybean plant may carry a recessive gene, whose traits will show up only in later generations.” The passage also indicates that green hypocotyls are a recessive allele. Both of these statements support answer choice H.
3. The correct answer is A. According to Table 1, both purple flowers and round leaves are dominant traits. Therefore, it is most likely that these will be passed on to later generations. The other answer choices are not supported by the passage.
4. The correct answer is J. According to the passage, a quantitative trait shows “continuous variation.” Therefore, it makes the most sense that plant height is considered a quantitative trait because plant height varies over the lifespan of the soybean plant. The other answer choices are not supported by the passage.
5. The correct answer is B. The passage states that as “water pressure increases, so does the rate of flow.” The passage also indicates that rate of flow corresponds to the length of the water stream. Since the rate of flow was greatest when Pin D was removed, you can conclude that the water pressure was greatest at the bottom of the full container.
6. The correct answer is H. In designing the experiment, the students must have assumed that they could accurately correspond the rate of flow to the length of the water stream. The other answer choices are not supported by information presented in the experiment.
7. The correct answer is A. The passage states that as “water pressure increases, so does the rate of flow.” This relationship is indicated by the graph in answer choice A.
8. The correct answer is J. Table 1 indicates that the length of the water stream produced when Pin C was removed is 3.0 inches. The other answer choices are not supported by the passage.
9. The correct answer is C. According to the passage, the “more water that is in the container, the greater the water pressure will be.” This suggests that, if the amount of water in the container is reduced, the water pressure will also be reduced. So, if the students do not replace the water in the container, it is likely that the lengths of the water streams will decrease continually after the first pin is removed.
10. The correct answer is F. Scientist 1 argues that a planet’s location, security of its orbit, potential for planetary disasters, and surface characteristics affect the probability of complex life existing there. This argument best supports answer choice F.
11. The correct answer is C. Scientist 1 argues that “if one takes into account planetary disasters, the possibility of complex life decreases.” The other answer choices are either discussed by both scientists or by Scientist 2 only.
12. The correct answer is G. Scientist 1 argues that it takes many precise factors together to allow complex life to form. In addition, Scientist 1 says, “if one takes into account planetary disasters, the possibility of complex life decreases.” The other answer choices are not supported by the passage.
13. The correct answer is C. Scientist 2 says that “it is not impossible that there is another set of characteristics and properties that together are also able to support complex life.” Scientist 2 goes on to say that “… complex life-forms outside of our solar system may use another gas for respiration.” These statements best support answer choice C.
14. The correct answer is F. According to the passage, both scientists agree that oxygen is necessary for the existence of complex life on Earth. The other answer choices are supported by either one or the other scientist, but not both, or they are not supported at all by the passage.
15. The correct answer is B. Scientist 2 states that “complex or intelligent life may not appear simultaneously. … One complex life-form might never discover or know about a life-form that existed before or after the extinction of the first life-form.” This statement best supports answer choice B.