Crash Course for the New GRE, 4th Edition (2011)
Part II. Ten Steps to Scoring Higher on the GRE
Step 9. Get Organized When Doing Arithmetic
Questions involving ratios or averages can seem daunting at first. The math involved in these problems, however, generally involves little more than basic arithmetic. The trick to these problems is understanding how to organize your information. Learning the triggers and set-ups for each of these problems can take a four-minute brain teaser and turn it into a 45-second cake walk.
Averages
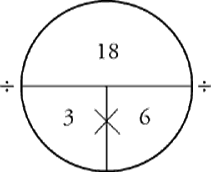
Imagine you are asked to find the average of three numbers, 3, 7, and 8. This is not a difficult problem. Simply add the three together to get the total. Divide by three, the number of things, to get the average. All average problems involve three basic pieces:
· Total: 18
· # of things: 3
· Average: 6
It is virtually assured that they will never give you a list of numbers and ask you for the average. That would be too easy. They will, however, always give you two out of these three pieces, and it is your job to find the third. That’s where the average pie comes in. The minute you see the word “average” on a problem, draw your pie on your scratch paper. It looks like this:
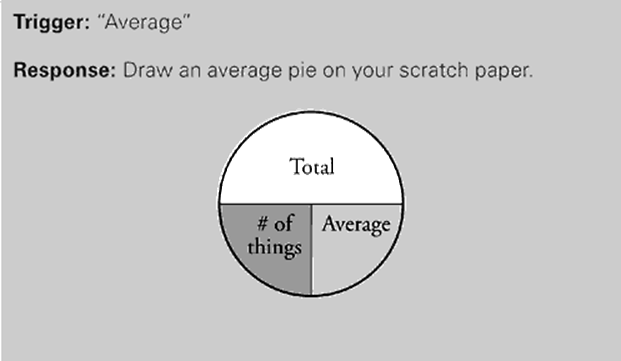
Here’s how you would fill it in.
ETS won’t necessarily give you a list of numbers and ask you to find the average. That would be too easy. They might give you the average and the total and ask you to find the number of things, or they might give you the number of things and the average and ask for the total. They will always give you two out of the three pieces of information. Just make your pie, fill in what you know, and it becomes easy to find the missing piece. Here’s how it works:
The line in the middle means divide. If you have the total and the number of things, just divide and you get the average (18 ÷ 3 = 6). If you have the total and the average, just divide and you get the number of things (18 ÷ 6 = 3). If you have the average and the number of things, simply multiply and you get the total (6 × 3 = 18). As you will see, the key to most average questions is finding the total.
The benefit of the Average Pie is that you simply have to plug the information from the question into the Average Pie and then complete the Pie. Doing so will automatically give you all the information you need to answer the question.
Let’s try this one:
Question 6 of 12
The average (arithmetic mean) of a set of 6 numbers is 28. If a certain number, y, is removed from the set, the average of the remaining numbers in the set is 24.
|
Quantity A |
Quantity B |
|
y |
48 |
![]() Quantity A is greater.
Quantity A is greater.
![]() Quantity B is greater.
Quantity B is greater.
![]() The two quantities are equal.
The two quantities are equal.
![]() The relationship cannot be determined from the information given.
The relationship cannot be determined from the information given.
The minute you see the word “average,” make your pie. If you see the word “average” a second time, make a second pie. Start with the first bite-sized piece, “The average of a set of 6 numbers is 28.” Draw your pie and fill it in. With the average and the number of things you can calculate the total, like this:
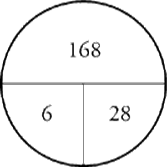
Take your next piece of the problem, “If a certain number, y, is removed from the set, the average of the remaining numbers in the set is 24.” There’s the word “average” again, so make another pie. Again, you have the number of things (5, because one number was removed from our set) and the average, 24, so you can calculate the total, like this:
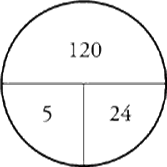
The total for all six numbers is 168. When you take a number out, the total for the remaining five is 120. The number you removed, therefore, must be 168 − 120 = 48. y = 48. The answer is (C).
Ratios
When working with fraction, decimals, and percentages, you are working with a part to a whole relationship. The fraction ![]() means 3 parts out of a total of 5, and 20% means 20 parts out of every 100. A ratio on, the other hand, is a part to a part relationship. Lemons and limes in a ratio of 1 to 4 means that you have one lemon for every four limes. If you make an average pie every time you see the word “average,” you should make a ratio box every time you see the word “ratio.” Let’s use an actual GRE problem:
means 3 parts out of a total of 5, and 20% means 20 parts out of every 100. A ratio on, the other hand, is a part to a part relationship. Lemons and limes in a ratio of 1 to 4 means that you have one lemon for every four limes. If you make an average pie every time you see the word “average,” you should make a ratio box every time you see the word “ratio.” Let’s use an actual GRE problem:
Question 3 of 20
In a club with 35 members, the ratio of men to women is 2 to 3 among the members. How many men belong to the club?
![]() 2
2
![]() 5
5
![]() 7
7
![]() 14
14
![]() 21
21
The problem says, “the ratio of men to woman …” As soon as you see that, make your box. It should look like this:
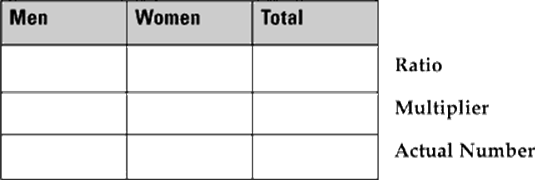
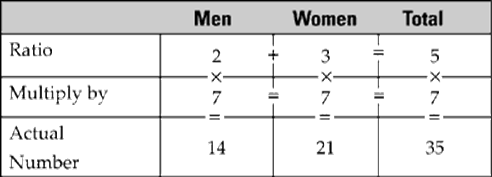
In the top line of the box, list the items that make up your ratio, in this case, men and women. The last column is always for the total. In the second row of the box, fill in your ratio of 2 to 3 under Men and Women, respectively. The total is five. This doesn’t mean that there are actually two men and three women in the club. This just means that for every five members of this club, two of them will be men and three of them will be women. The actual number of members, we’re told in the problem, is 35. This goes in the bottom right cell under Total. With this single number in the bottom row we can figure out the rest. To get from 5 to 35, you need to multiply by 7. The multiplier remains constant across the ratio, so fill a 7 in all three cells of the third row, next to the word “multiplier.” We now know that the actual number of men in the club is 14, just as the actual number of women is 21. Here’s what your completed ratio box looks like:
The fraction of the club that is male is ![]() . If you reduce this, you get
. If you reduce this, you get ![]() . The percentage of members who are female is
. The percentage of members who are female is ![]() or 60%.
or 60%.
Median/Mode/Range
Median means the number in the middle, like the median strip on a highway. In the set of numbers 2, 2, 4, 5, 9, the median is “4” because it’s the one in the middle. If the set had an even number of elements, let’s say: 2, 3, 4, 6, the median is the average of the two numbers in the middle or, in this case, 3.5. That’s it. There’s not much that’s interesting about the word “median.” There are only two ways they can trick you with a median question. One is to give you a set with an even number of elements. We’ve mastered that one. The other is to give you a set of numbers which are out of order. If you see the word “median,” therefore, find a bunch of numbers and put them in order.
“Mode” simply means the number that shows up the most. In the set 2, 2, 4, 5, 9, the mode is 2. That’s all there is to mode. If no number shows up more than another, then the set has no mode.
“Range” is even easier. It is the difference between the biggest number in a set and the smallest. In other words, find the smallest number and subtract it from the biggest number.
Let’s look at a problem:
Question 8 of 20
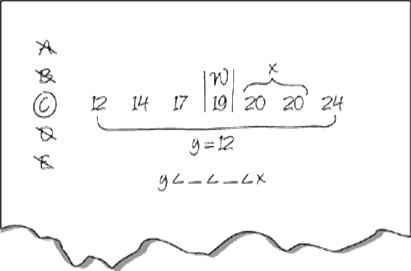
If in the set of numbers {20, 14, 19, 12, 17, 20, 24}, v equals the mean, w equals the median, x equals the mode, and y equals the range, which of the following is true?
![]() v < w < x < y
v < w < x < y
![]() v < x < w < y
v < x < w < y
![]() y < v < w < x
y < v < w < x
![]() y < v < x < w
y < v < x < w
![]() w < y < v < x
w < y < v < x
In this question we’re asked to find the mean, the median, the mode, and the range of a set of numbers. The minute you see the word “median,” you know what to do. Put the numbers in order: 12, 14, 17, 19, 20, 20, 24. Do this on your scratch paper, not in your head, and while you’re at it, list A, B, C, D, and E so that you have something to eliminate. The minute we put the numbers in order, three out of the four elements we are asked to find become clear. The range, 12, is equal to the smallest number, so y should be the element at the far left of our series. Cross off A, B, and E. The average will be somewhere in the middle. Without doing some calculations, it’s not clear if it is larger than the median (19) or smaller, so skip to the mode. The mode is 20 and larger than the median and certainly larger than the average. x should be the last element in our series. Cross off choice (D). The correct answer is (C). Always remember that the answer choices are part of the question. Often it is far easier to find and eliminate wrong answers than it is to find the right ones.
Rates and Proportions
Rates are really just proportions. Just like ratios and averages, the basic math is straight forward, but the difficult part is organizing the information. Actually, organizing the information is the whole trick. Set up all rates like a proportion and make sure you label the top and bottom of your proportion.
Let’s look at an actual problem:
Question 8 of 20
Stan drives at an average speed of 60 miles per hour from Town A to Town B, a distance of 150 miles. Ollie drives at an average speed of 50 miles per hour from Town C to Town B, a distance of 120 miles.
|
Quantity A |
Quantity B |
|
Amount of time Stan spends driving |
Amount of time Ollie spends driving |
![]() Quantity A is greater.
Quantity A is greater.
![]() Quantity B is greater.
Quantity B is greater.
![]() The two quantities are equal.
The two quantities are equal.
![]() The relationship cannot be determined from the information given.
The relationship cannot be determined from the information given.
In this problem we are comparing two separate rates and each rate consists of miles (distance) and hours (time). Start with Stan. Stan’s speed is 60 mph, which is to say that he drives 60 miles every one hour. We’re asked to find how many hours it will take him to travel 150 miles. Just set it up as a proportion, like this:
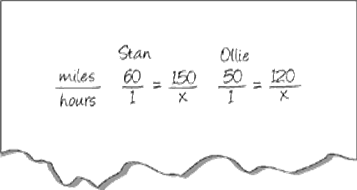
Now we can compare miles to miles and hours to hours. There is an x in the second space for hours because we don’t yet know how many hours it’s going to take Stan. The nice thing about this set-up is that you can always cross multiply to find the missing piece. If 60x = 150, then x = 2.5. This means that it took Stan 2.5 hours to drive 150 miles (at a rate of 60 miles per hour).
Now try Ollie. The set up is the same. Ollie drives 50 miles for every one hour. To find out how many hours he needs to drive 120 miles, just cross multiply. If 50x = 120, then x = 2.4. This means that it took Ollie 2.4 hours to drive 120 miles (at a rate of 50 miles per hour). Quantity A is Stan, so the correct answer is (A).
Arithmetic Summary
|
Trigger: When you see the word… |
Response: |
|
“Average” |
Draw an Average Pie. |
|
“Ratio” |
Draw a ratio box. |
|
“Median” |
Find a bunch of numbers, and put them in order. |
|
“Mode” |
Find the number that appears the most often. |
|
“Range” |
Subtract the smallest from the biggest. |
|
“Rate” |
Set up a proportion; label top and bottom. |