5 Steps to a 5: AP Biology - Mark Anestis 2021
STEP 4 Review the Knowledge You Need to Score High
CHAPTER 13 Laboratory Review
IN THIS CHAPTER
Summary: This chapter covers the 13 laboratory experiments that are included in the AP Biology curriculum.

Key Ideas
![]() Hands-on lab work and understanding the process of science are central parts of AP Biology. Translation—LEARN THESE WELL!
Hands-on lab work and understanding the process of science are central parts of AP Biology. Translation—LEARN THESE WELL!
![]() Read the summaries found here and review the work that you did on the labs during the year.
Read the summaries found here and review the work that you did on the labs during the year.
![]() If you missed one of these labs in class, or just do not feel comfortable with the material even after reading this chapter, ask your teacher to go over the lab with you.
If you missed one of these labs in class, or just do not feel comfortable with the material even after reading this chapter, ask your teacher to go over the lab with you.
Introduction
In this chapter we take a look at each of the 13 lab experiments that are included in the AP Biology curriculum. We summarize the major objectives from each experiment and the major skills and conclusions that you should remember. This chapter is important, so do not just brush it aside if lab experiments are not your cup of tea. Experimental (data) analysis will be heavily emphasized on the exam, in both the multiple-choice and the essay sections. Of course, the questions will not be an exact duplication of the experiment, but they will test your understanding of the objectives and main ideas that are discussed in this chapter. So, only 13 experiments separate us and the end of the review material for this exam.
All of the investigations in this chapter have multiple parts, including the opportunity for you to go crazy and create your own investigation. We have no idea what kind of mad-scientist experiment you might design, so we will instead focus on the more straightforward portions of these labs, including a summary of what the key ideas are from each investigation.
Investigation 1: Artificial Selection
This lab focuses on the role of differential reproduction in natural selection, meaning some organisms in a population reproduce more than others and leave more offspring. But instead of it being “natural” selection, it’s “artificial” because you get to choose which organisms are allowed to reproduce!
EVO
Evolution
Basic Setup
For natural selection to occur, first there needs to be variation in a population, right? Well, look closely at the Wisconsin Fast Plants that you’ll be working with. Do you see any trait that you could easily measure (e.g., leaf color, hairiness, height)? Are there any variations in this particular trait? It should not be something that is a clear-cut yes or no, but rather a trait that exhibits a range. Now you get to make selection decisions! You will choose the top (or bottom) 10 percent of your plants with this trait, and those lucky few are the ones allowed to reproduce. You will transfer pollen between this pool of “winners” and, once the seeds develop, plant and grow your second generation of plants. Once again, you will measure your chosen trait in this second population.
Results
In this experiment you are essentially choosing which genes are passed to the next generation. By artificially selecting, say, only the purplest of the plants, you are ensuring that the next generation will have inherited those “purpley” genes. You will hopefully observe an increase (or decrease, depending on your investigation) of your chosen trait in the second population of plants. This is called directional selection. Considering that one of the requirements of this class is your ability to graph and analyze data, it would probably be an excellent idea for you to create a bar graph to compare the quantity of your trait between these two generations. Are the means significantly different?
Don’t forget to keep this a controlled experiment! Did you measure the trait of your first-generation plants when they were nine days old? Remember to measure the second generation at the same age, using the same method.
Key Skills
✵ Graph your data.
✵ Explain how natural selection acts on phenotypes.
✵ Use data to show how a measurable trait is changing in your plant population.
Investigation 2: Mathematical Modeling: Hardy-Weinberg
This investigation lets you build upon what you learned from Investigation 1: the idea of natural selection and how it changes a population. If you truly wanted to see if a population was evolving, you would track the frequency of alleles and how they change from generation to generation. To do so, you first need to determine what your population’s alleles look like right now, before any funky evolutionary stuff happens. This information can then be used as a point of comparison to see if the allelic frequencies are indeed changing in your population. The Hardy-Weinberg equilibrium is used to describe a population that is in stasis, or not evolving. Your goal in this lab is to model how allele frequencies change in a generation of some imaginary population, and you will do this using a computer model.
EVO
Evolution
Basic Setup
On the AP Biology exam, will you have to open up a spreadsheet file and correctly enter a formula? No. Will you have to understand how to use the Hardy-Weinberg equilibrium and how to correctly analyze the data obtained? You bet! The idea to understand is how the fitness of an allele affects its frequency in a population. For example, there are two alleles for a given gene: A and a. If a population is in Hardy-Weinberg equilibrium (i.e., not evolving), and the frequency of both alleles is 0.5 (meaning one half of the alleles in this population’s gene pool is the dominant A form, whereas the other half is in the recessive a form), then it will remain that way for gazillions of generations. But how could you make that ratio change? That, my friend, is evolution, and that is the point of this lab. Using tools such as computer programs and spreadsheets, you can model how a hypothetical gene pool changes from generation to generation.
Results
Though the bulk of this lab was dedicated to creating your spreadsheet, the real investigation begins when you get to tweak your non-evolving population. The equations you have to know for this experiment are p + q = 1 and p2 + 2pq + q2 = 1. Chapter 11 lists the five conditions required for the existence of Hardy-Weinberg equilibrium:
1. No mutations
2. No gene flow
3. No genetic drift (large population size)
4. No natural selection (so that the traits are neutral; none gives an advantage or disadvantage)
5. Random mating
If any of these five conditions (Figure 13.1 does not hold true, then the population will experience microevolution, and the frequencies of the alleles will be subject to change.
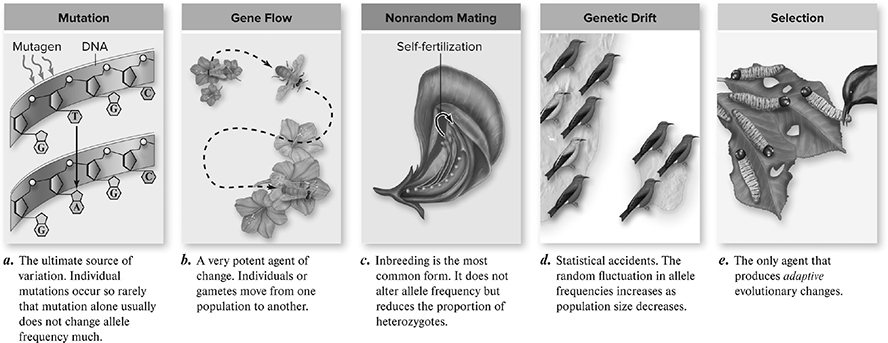
Figure 13.1 Five agents of evolutionary change. (Reproduced with permission from Raven P, Johnson G, Mason K, Losos J, Duncan T; Biology, 12th ed. New York: McGraw Hill; 2020)
Using your computer model, you can design an experiment to measure the effect of selection, heterozygote advantage, and genetic drift:
✵ Selection. Imagine that an individual homozygous recessive for a condition does not survive to reproduce. Because the aa offspring would not survive to reproduce, this will cause a shift in allele frequencies to include more A children and fewer a children.
✵ Heterozygote advantage. This is a situation in which being heterozygous for a condition provides some benefit (e.g., sickle cell allele in malarial regions). In this case, the allele will still decrease, but not as fast as in the selection example.
✵ Genetic drift. Imagine that 60 percent of your hypothetical population were killed in some horrific environmental disaster. This would leave the remaining 40 percent to continue breeding and passing on genes to the next generation. The random nature in which organisms are eliminated can lead to a shift in the allele frequency and the p and q will probably change depending on the genotype of those who are left behind.
There are two questions to ponder as you finish this experiment:
1. Why is it so difficult to eliminate a recessive allele? It is difficult because the allele remains in the population, hidden as part of the heterozygous condition, safe from selection, which can act only against genes that are expressed. So, although the q for a population may decline, it will not disappear completely because of the pq individuals.
2. Why does heterozygote advantage protect recessive genes from being eliminated? Those who are heterozygous for the condition are receiving some benefit. For example, those who have sickle trait are protected against malaria. This positive benefit for heterozygous individuals helps keep the recessive condition alive in the population.
Key Skills
✵ Use data from a changing population and analyze it using the Hardy-Weinberg equation.
✵ Explain how data from using this equation demonstrates genetic drift and the effects of selection.
Investigation 3: Comparing DNA Sequences to Understand Evolutionary Relationships with BLAST
Say you found a brand-new fossilized creature buried in your backyard, and you want to find its closest living relative. Or maybe you identified a single gene that causes disease in hedgehogs and you want to know if that same gene is found in humans. This lab focuses on the use of BLAST (Basic Local Alignment Search Tool) as a tool to answer such questions. In addition, it incorporates the use of cladograms. A cladogram is a visual representation of the evolutionary relatedness of a species. In this investigation, you will use BLAST to generate the information needed to construct a cladogram.
EVO
Evolution
Basic Setup
Given a genetic sequence, you are required to use the online BLAST software to compare it to other gene sequences already in their gigantic database. Results will show a ranking of the most closely related organisms (and what percentage of their base pairs actually match up). Just as in the previous lab, you won’t have a computer available to you during the AP exam, so no, you won’t have to actually know how to use BLAST while taking the test. You will, however, most likely need to analyze data obtained from a hypothetical BLAST query and, from those results, generate a cladogram depicting evolutionary relatedness.
Results
By determining the percent similarity of an unknown gene with those from other organisms, you should be able to then place your unknown creature within a cladogram to show evolutionary relatedness. For example, say you had a table showing the percent similarity of “gene X” in humans versus four other species (see Table 13.1).
Table 13.1 Percent similarity between gene X in humans and other species.
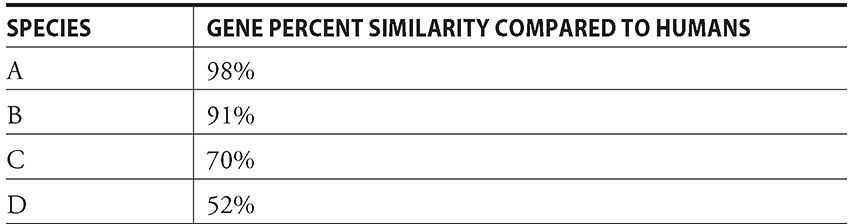
If you drew a cladogram showing the evolutionary relationship, it would look something like Figure 13.2.
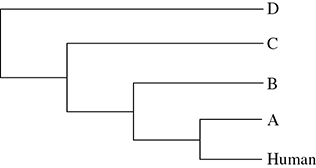
Figure 13.2 Cladogram for percent similarity between gene X in humans and other species. The closer two species reside on a clade, the closer they are genetically related.
Key Skills
✵ Explain the relationship between genetic sequences and evolutionary relatedness.
✵ Draw and/or analyze a cladogram that shows evolutionary relationships.
Investigation 4: Diffusion and Osmosis
This investigation draws on information covered in Chapter 6, Cell Structure and Function. If you feel uncomfortable with this material, take a few moments to flip back to Chapter 6 and scan through the information about diffusion, osmosis, and cell transport. In summary, osmosis occurs from an area of high water potential to an area of low water potential. In a given solution, the higher the solute concentration, the lower that solution’s water potential.
ENE
Energetics
Part 1: Surface Area and Cell Size
Basic Setup for Part 1
Besides turning your fingers blue, this lab will demonstrate the relationship between surface area and volume and how this ratio affects diffusion rates in a cell. Your cell model is a block of agar that contains an indicator dye that changes color when the pH drops. You’re given a chunk of this blue agar to carve into three different block sizes, each with differing surface area-to-volume ratios (SA:V). Each block is dropped into a solution, and as the liquid diffuses into the agar, the pH causes a change in agar color. This enables you to easily track the amount of time it takes for diffusion to be completed.
Results for Part 1
It’s all about a large surface area-to-volume ratio. The block with the biggest SA:V ratio wins the race. For example, say you have three sizes of agar blocks:
block 1 = 1 cm × 1 cm × 1 cm
block 2 = 2 cm × 2 cm × 2 cm
block 3 = 1 cm × 1 cm × 8 cm
You should be able to calculate both the volume (cm3) and the surface area (cm2) for each of these blocks. (Remember: Formulas will be provided for you on the AP exam!)
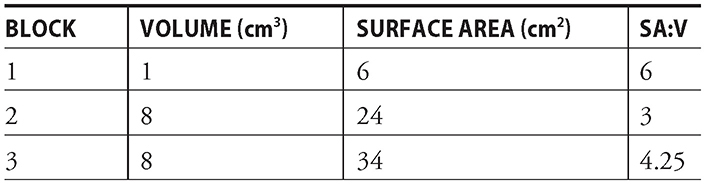
Notice that even though blocks 2 and 3 have the same volume, their surface areas are different. This results in diffusion taking longer in block 2 than it does in block 3.
Key Concept
✵ A high SA:V ratio is important for any cell that relies on a high diffusion rate. If you were a tiny bacterium, your health and well-being would be dependent on quickly getting good stuff in (glucose for cellular respiration!) and bad stuff out (metabolic waste). The linings of your small intestine and lungs have many folds in order to create the highest surface area possible in the smallest amount of space and thereby facilitate -diffusion of food monomers or oxygen molecules (Figure 13.3.
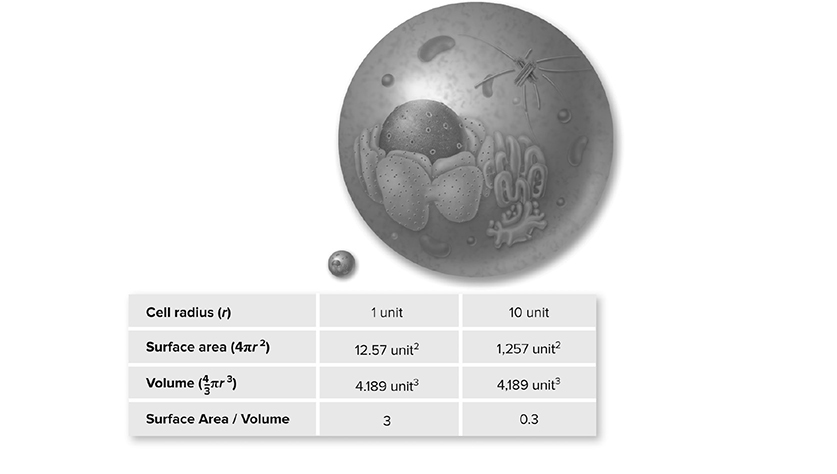
Figure 13.3 Surface area-to-volume ratio. As a cell gets larger, its volume increases at a faster rate than its surface area. If the cell radius increases by 10 times, the surface area increases by 100 times, but the volume increases by 1000 times. A cell’s surface area must be large enough to meet the metabolic needs of its volume. (Reproduced with permission from Raven P, Johnson G, Mason K, Losos J, Duncan T; Biology, 12th ed. New York: McGraw Hill; 2020)
Part 2: Modeling Diffusion and Osmosis
Basic Setup for Part 2
Now you get to create a model of a cell using dialysis tubing. Just like a real cell, the tubing is selectively permeable to water and some solutes. The point of this lab investigation is to use different solutions to model how water potential influences osmosis See Figure 13.4.
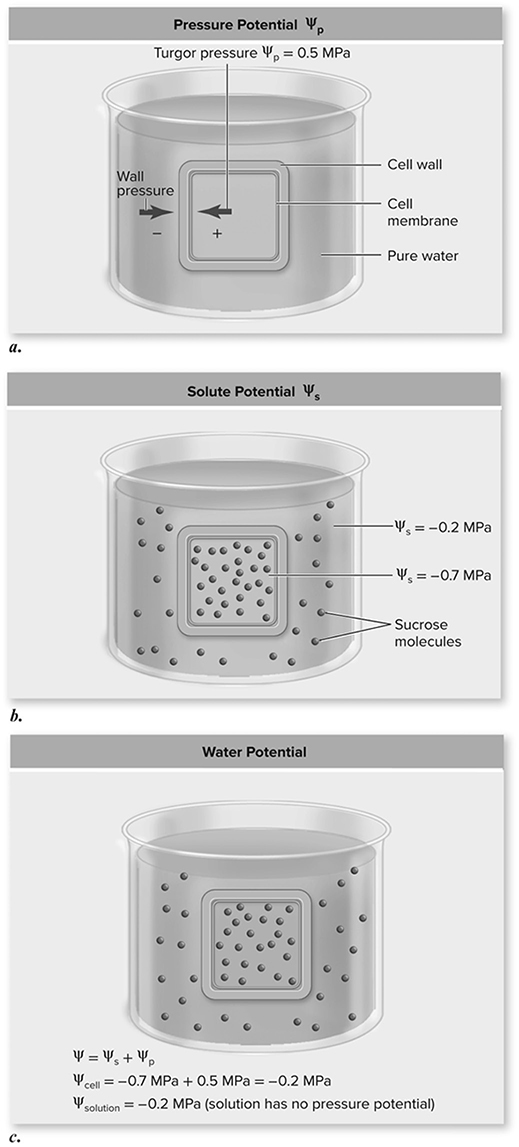
Figure 13.4 Determining water potential. a. Cell walls exert pressure in the opposite direction of cell turgor pressure. b. Using the given solute potentials, predict the direction of water movement based only on solute potential. c. Total water potential is the sum of ψs and ψp. Because the water potential inside the cell equals that of the solution, there is no net movement of water. (Reproduced with permission from Raven P, Johnson G, Mason K, Losos J, Duncan T; Biology, 12th ed. New York: McGraw Hill; 2020)
Results for Part 2
Say you filled your dialysis bag with a 1 Molar (1 M) sucrose solution, weighed it, and placed it in a beaker of 1 M NaCl solution. After 30 minutes, you weigh the bag again and—voilà!—it got lighter! That means it lost some water, right? Can you use water potential to show why that makes sense? Recall that you can calculate the solute potential for a solution with this equation:

The molarities are equal for both of these solutions, so the ionization constant is the deciding factor. NaCl ionizes and sucrose does not! So for NaCl, i = 2, whereas for sucrose i = 1. Therefore, the NaCl solution has a higher solute potential; or, in other words, it is a hypertonic solution compared to your dialysis tubing “cell.” Therefore, water will diffuse out of the bag into the surrounding NaCl solution.
Key Concepts
✵ Osmosis occurs from an area of high water potential to low water potential.
✵ A cell’s environment allows you to make predictions about molecular movement through cell membranes.
Part 3: Observing Osmosis in Living Cells
Basic Setup for Part 3
Here you get to work with pretty, color-coded (unlabeled) sucrose solutions ranging from 0.0 M up to 1.0 M, and use potato cores to figure out the relative concentrations of these solutions. To take it one step further, you can then calculate percent change in weight of your potato cores and determine the water potential of the potato tissue. Remember that the bigger the difference in water potential between a cell and the solution, the bigger the movement of water (either into or out of the cells).
Results for Part 3
Once you calculate the potatoes’ percent change in weight for each of the unknown solutions, you can arrange them from most negative to most positive. A supernegative percent change in weight indicates a significant loss of water; a highly hypertonic solution increases water loss from cells. The more negative the number, the higher the molarity of the solution! The same is true for superpositive percent change in weight. That means the potato cores gained a lot of water, which happens in a hypotonic solution. The greater the weight gain, the lower the molarity of the solution.
What if you wanted to determine the actual water potential (molarity) of the potato? It’s easy, once you remember that if the water potential of the solution equals that of the cells, there is no net change in weight. If you graph your percent changes in weight, you can estimate the potato’s water potential (see Figure 13.5).
The point where the line crosses the x-axis indicates the molarity when there would be no net change in weight. Therefore, 0.5 M is the approximate molarity (or, in this case, water potential) of your potato!
One final thought about your data: Although we often focus on quantitative (numerical) measurements in our labs, qualitative observations are still very important. When you removed your potato cores from the solution, did they feel different? Floppy and bendy? That would suggest that the cells lost water because they were in a hypertonic solution (the higher molarities). Was the potato core rigid, and would it snap if you bent it? That would suggest that it was in a hypotonic (low molarity) solution and water flowed into the cells, increasing their turgor pressure.
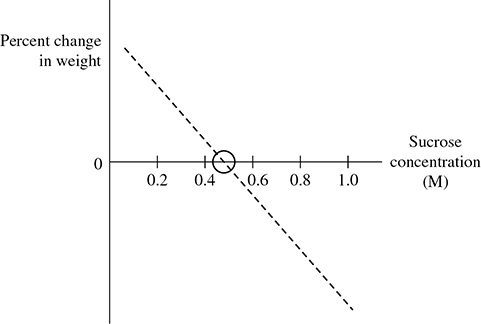
Figure 13.5 Potato core change in weight.
Key Concepts (for All Three Procedures)
✵ A high surface area-to-volume ratio increases diffusion rates.
✵ A cell that relies on diffusion would evolve to have a high SA:V ratio.
✵ Water diffuses from an area of high to low water potential.
Investigation 5: Photosynthesis
Photosynthesis (Figure 13.6 is a complex (and possibly confusing) metabolic process through which autotrophs generate glucose by first converting the sun’s light energy into the chemical form that all living cells use (ATP). If you wish to design a lab to track the rate of photosynthesis, how would you do it? Measure glucose production? Carbon dioxide use? Maybe focus on the light reaction’s reduction of the electron carrier NAD+ into its reduced form (NADH) as in the DPIP lab? Well, some of the best experiments are the simplest, so let’s watch little pieces of a leaf float in water as oxygen is produced as a by-product of photosynthesis.
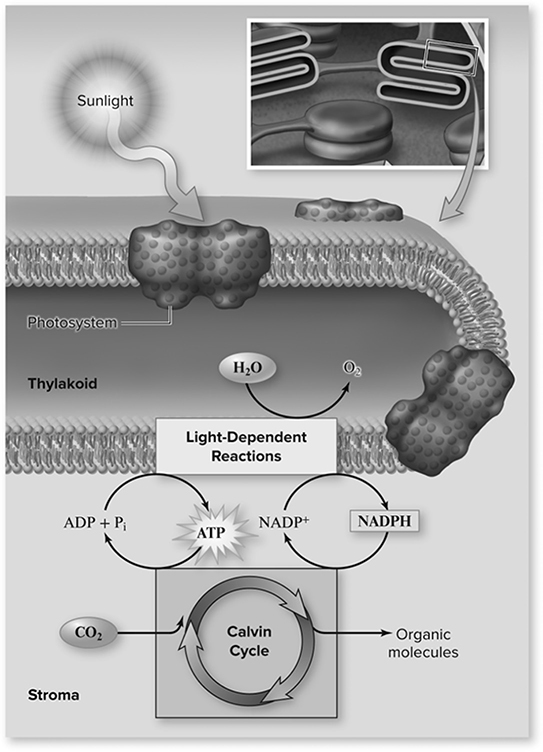
Figure 13.6 Overview of photosynthesis. Chlorophyll molecules are organized into photosystems. The light-dependent reactions begin when a chlorophyll molecule absorbs a photon of light. This light energy is used to generate ATP and NADPH. Electrons lost from chlorophyll are replaced by oxidizing water, producing O2 as a by-product. The ATP and NADPH are used to reduce CO2 via the Calvin cycle in the stroma, producing organic molecules. (Reproduced with permission from Raven P, Johnson G, Mason K, Losos J, Duncan T; Biology, 12th ed. New York: McGraw Hill; 2020)
ENE
Energetics
Basic Setup
This is a cool way to measure photosynthetic rates, based on the amount of oxygen produced. Little leaf disks are put in a large syringe with some slightly soapy water (this helps break surface tension). The little disks float on top of the water, which introduces the challenging part of the lab: getting them to sink. A vacuum must be created in the syringe to pull out the atmospheric gases from the spongy mesophyll layer in the leaf tissue. This takes a bit of trial and error, but once it is accomplished, the disks will slowly drift to the bottom of the syringe. The contents of the syringe are dumped into a cup filled with a sodium bicarbonate solution and put under light. As more photosynthesis occurs, more oxygen is produced:
If you look closely, you can see tiny bubbles forming on your leaf disks! Once enough oxygen is produced (and caught within the internal leaf space), the little disks will begin to rise to the top very slowly.
Here’s a question: If your leaf pieces are photosynthesizing, where are they getting the necessary carbon dioxide? When sodium bicarbonate ionizes in water, it provides an alternative source of carbon dioxide for the plant.
Results
The investigative part of the lab allows you to explore variables that you think might influence photosynthesis in your leaf disks. Do the levels of CO2 effect photosynthesis? How about amount of light? Regardless of your choice of variable, perform the same leaf disk analysis and compare the amount of time it takes for half of your disks to rise (ET50, or estimated time it takes 50 percent of the disks to float) in both your control and experimental groups.
Key Concepts
✵ A lot of photosynthesis means a lot of oxygen production.
✵ Light increases the rate of photosynthesis.
✵ Carbon dioxide was provided by dissolved sodium bicarbonate.
Investigation 6: Cellular Respiration
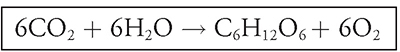
If you would like to see how different environmental conditions affect an organism’s respiration rate, this is the lab for you! In this investigation you will use a respirometer (or microrespirometer) to track the respiration rate of seeds. Based on the equation for cellular respiration, C6H12O6 + 6O2 → 6CO2 + 6H2O, how would you measure respiration rates?
ENE
Energetics
There are, in fact, three ways to measure respiration:
1. Oxygen consumption: how much O2 is actually consumed
2. Carbon dioxide production: how much CO2 is actually produced
3. Energy released during respiration: how much energy is released
Basic Setup
This experiment examines germinating peas by measuring the volume of gas that surrounds the peas at certain intervals in an effort to determine the rate of respiration. Two gases contribute to the volume around the pea: O2 and CO2. How can we use the amount of oxygen consumed during respiration as our measuring point if CO2 is present as well? Something needs to be done with the CO2 released during respiration. Otherwise we would not get a true representation of how much the volume is changing as a result of oxygen consumption. The CO2 would skew the numbers by making it appear as if less O2 were being consumed.
The CO2 problem can be handled by adding potassium hydroxide, which reacts with CO2 to produce K2CO3. This reaction allows us to limit the number of variables that could be affecting the volume around our beloved peas to
1. Change in the volume of oxygen
2. Change in the temperature (PV = nRT )
3. Change in the pressure of the surrounding atmosphere
Aerobic respiration (Figure 13.7 requires and uses oxygen. So, one would expect the volume of oxygen around the pea to decline as respiration occurs. The reactions of interest for this experiment occur in a tubelike device known as a respirometer. To calculate the change in volume that occurs with these peas, one first has to measure the initial volume around the peas. A control group must then be set up that consists of peas that are not currently germinating and will have a rate of respiration lower than that of germinating seeds. This will give the experimenter a baseline with which to compare the respiration rate of the germinating seeds. Since temperature and pressure are also able to affect the volume around the peas, it is important to set up another control group that can calculate the change in volume that is due to temperature and pressure as opposed to respiration. Any changes in this control group should be subtracted from the changes found in the germinating seeds to determine how much of the volume change is actually due to oxygen consumption and respiration.
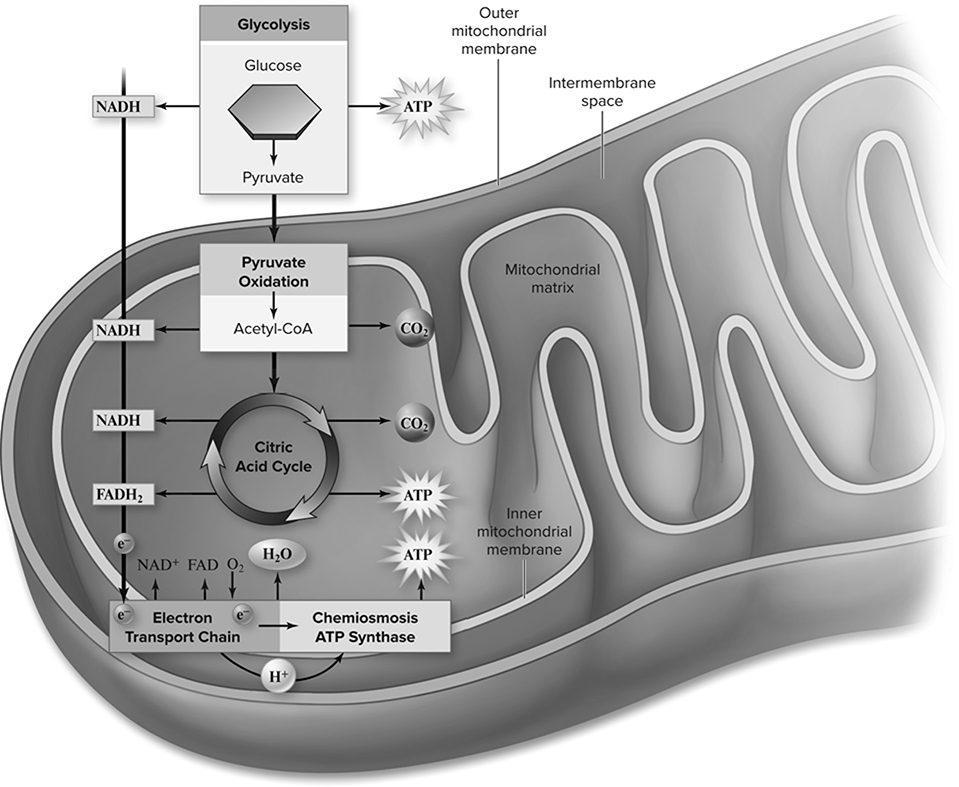
Figure 13.7 An overview of aerobic respiration. (Reproduced with permission from Raven P, Johnson G, Mason K, Losos J, Duncan T; Biology, 12th ed. New York: McGraw Hill; 2020)
Just a side thought: Can you imagine how awkward it could have been if one of Mendel’s lab partners had decided to run this experiment? I can see it now: Mendel walks into the lab and asks, “Has anyone seen my peas? After seven long years, I’ve nearly completed my research. Just need to tally up that last generation of peas. . . . Very exciting. . . . Hmm. . . . I thought my peas were sitting here on this desk by my respirometer.”
Results
1. Germinating seeds consume more oxygen than do nongerminating seeds. This makes sense, because they have more reactions going on.
2. Seeds germinating at a lower temperature consume less oxygen than do seeds germinating at a higher temperature.
3. You can determine how much oxygen is consumed by watching how much water is drawn into the pipettes as the experiment proceeds. (Refer to your classroom lab manual if you are confused by the pipette portion of this lab.) This water is drawn in as a result of the drop in pressure caused by the consumption of oxygen during respiration.
Key Concepts
✵ A respirometer measures respiration rates by tracking the amount of oxygen being used in cellular respiration.
✵ Warm conditions usually speed up cellular respiration; cold slows it down.
Investigation 7: Cell Division: Mitosis and Meiosis
This experiment draws on information found in Chapter 8, Cell Communication and Cell Cycle, and Chapter 9, Heredity.
IST
Information Storage and Transmission
Part 1: Onion Roots Treated with a Mitosis-Inducing Chemical
Basic Setup for Part 1
Your goal is to see if there is a greater number of cells undergoing mitosis in root cells treated with lectin, a chemical that induces mitosis. Either you or your teacher will prepare slides of these root cells, and you will then count the number of cells either in interphase or in mitosis. Since you need a point of comparison, you will do similar counts with root cells that have not been treated with this chemical (the control).
Results for Part 1
So, how are you supposed to estimate how much time cells on a slide in front of you spend in either mitosis or interphase? Say, for example, that you record your findings and get the following breakdown: For your control, of 300 cells examined, 268 are in interphase and 32 cells are in one of the stages of mitosis (prophase, metaphase, anaphase, or telophase). This would mean that the cell spent 89.3 percent of its time in interphase. At any moment in time, 89.3 percent of the cells are in interphase. Here’s how to get that number. Take the number of cells in interphase, 268, and divide that by the number of cells examined, 300. The result is 0.893. Move the decimal point two places to the right to get the percentage, 89.3 percent. By the same logic, these data also show that 10.7 percent are in mitosis. For comparison, let’s say the chemically treated slide had 210 cells in interphase and 40 in mitosis (for a total of 250 cells examined).
Now, once you count your mitotic versus interphase cells for both treated and untreated roots, you need to use chi-square analysis to check if the difference is significant:
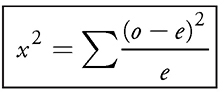
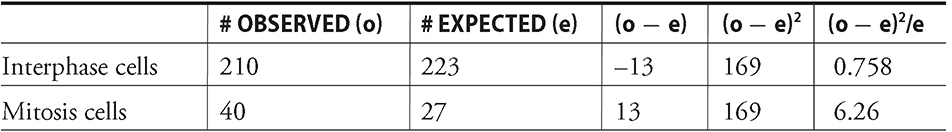
Do not panic! Even though that equation may seem intimidating, it’s really not that bad. First, determine how many of your treated cells would be in mitosis if the chemical didn’t have any effect. In other words, if 10.7 percent of your control cells were stuck in mitosis, you’d expect that same percentage in your treated group: (250 treated cells) × (0.107) = ~27 cells in mitosis. That leaves the remaining 223 cells in interphase (if you didn’t expect that mitosis-inducing chemical to do its job). So now you use chi-square analysis to compare what you actually saw in your chemically treated cells (40 in mitosis and 210 in interphase) to see if there are, in fact, significantly more cells stuck in mitosis. In other words, your null hypothesis is that the treatment did not make a difference. If you find that the chi-square value is greater than the critical value, you reject this null hypothesis in favor of the experimental hypothesis (the chemical likely did make a difference). See Table 13.2.
As you can see, your chi-square value is 0.758 + 6.26 = 7.02. To determine your critical value, you must choose a p value (usually 0.05) and the degrees of freedom. The degrees of freedom (df) equals the number of groups minus one. In this lab, there are two groups, interphase and mitosis; therefore, df = 2 — 1, or 1. Based on the chi-square table (which will be provided for you on the AP exam), your degrees of freedom equals 3.38. Since your calculated chi-square value (7.02) was bigger than 3.38, you can reject the null hypothesis that said the treatment made no difference. The chemical did increase the number of cells in mitosis.
Table 13.2 Chi-Square table for investigation 7.
Key Skill
✵ Analyze data using chi-square analysis. You can be sure that the AP exam will have at least one question asking you to do this. This lab is excellent practice for such a question.
Part 2: Meiosis and Crossover in Sordaria
Basic Setup and Results for Part 2
The title to this section makes Sordaria sound like some posh vacation spot in Europe. In reality it is a haploid ascomycete fungus. Anyway, the final portion of this experiment looks at the crossover that occurs during meiosis of this fungus and briefly discusses how recombination maps can be created using such data. Meiosis in Sordaria results in the formation of eight haploid ascospores, each of which can develop into a new haploid fungus. Crossover in Sordaria can be observed by making hybrids between wild-type and mutant strains. Wild-type Sordaria have black ascospores, and mutants have different colored ascospores (e.g., tan). When mycelia of these two strains come together and undergo meiosis, and if no crossover occurs, the asci that develop will contain four black and four tan ascospores in a 4:4 pattern. If crossover occurs, the ratio will change to either 2:2:2:2 or 2:4:2.
Chapter 9, Heredity, discusses gene maps constructed from crossover frequencies. You would construct the map here by first determining the percentage of asci that showed crossover. Referring to Figure 13.8, count the number of 2:2:2:2 and 2:4:2 asci and divide that sum into the total number of offspring. This result multiplied by 100 will give the crossover percentage. This number can then be used to determine how far away the gene is from the centromere. The crossover percentage is divided by 2 to determine this distance because a crossover involves only half the spores in each ascus.
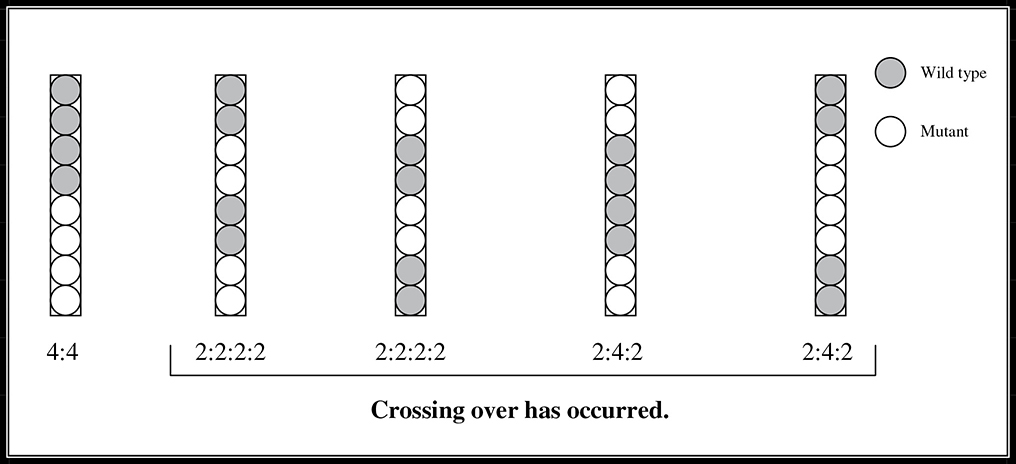
Figure 13.8 Crossover patterns in Sordaria.
Key Skill
✵ Explain how meiosis and crossing over leads to increased genetic diversity.
Investigation 8: Biotechnology: Bacterial Transformation
This experiment deals with material from Chapter 10, Molecular Genetics. This is the kind of experiment that can make you feel like a biotech junkie. Here, you use plasmids to move DNA from one cell to another cell—transformation. You get to play with restriction enzymes, E. coli (Escherichia coli—eww), and gel electrophoresis.
IST
Information Storage and Transmission
Full understanding of this experiment requires a basic knowledge of
1. What vectors are and how they are made
2. What gel electrophoresis is and how it works
3. What a restriction enzyme is and why it is so important to the field of biotechnology
You will find all this information waiting for you in Chapter 10, Molecular Genetics. We are not going to cave in and explain to you now what those things are. That is something you should do on your own.
OK, we’ll tell you now. . . . Escherichia coli (usually abbreviated E. coli) is a bacteria that is present in everyone’s intestinal tract. It grows in the laboratory as well and contains extrachromosomal DNA circles called plasmids. This experiment deals with the process of transformation: the uptake of foreign DNA from the surrounding environment. This is made possible by the presence of proteins on the surface of cells that snag pieces of DNA from around the cell; these DNA pieces are from closely related species.
The goal of this experiment is to take a bacterial strain that has ampicillin resistance, and transfer the gene for this resistance to a strain that dies when exposed to ampicillin. After attempting to transform the bacteria, the experimenter can check to see if it was successful by growing the potentially transformed bacteria on a plate containing ampicillin. If it grows as if all is well, the transformation has succeeded. If nothing grows, something has gone wrong.
Basic Setup
A colony of E. coli is added to each of two test tubes. In one tube a solution is added that contains such a plasmid (see Figure 13.9) that carries the ampicillin-resistance gene; the other tube receives no such plasmid. The waiting game follows, and after 15 minutes on ice, the two tubes are quickly heated in an effort to shock the cells into taking in the foreign DNA from the plasmid. The tubes are returned to ice and the colonies then spread out on an agar plate. They are sent to the incubator to sleep for the night and grow on the plate.
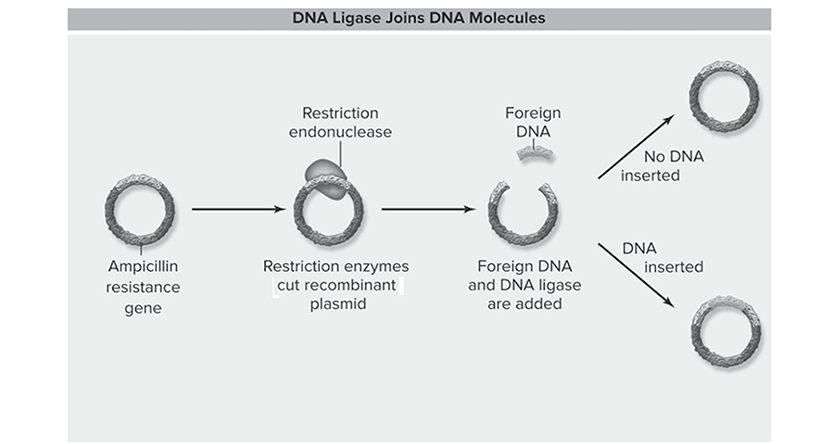
Figure 13.9 DNA Ligase at work. (Reproduced with permission from Raven P, Johnson G, Mason K, Losos J, Duncan T; Biology, 12th ed. New York: McGraw Hill; 2020)
Results
Four plates are created: two with ampicillin and two without. The bacteria from both test tubes should happily grow on the plates without ampicillin. The ampicillin-coated plate that is spread with bacteria from the nontransformed tube is bare—there is, indeed, no growth. The ampicillin-coated plate that is spread with bacteria from the attempted-transformation tube shows growth . . . it may not be the greatest growth ever seen, but it is growth. This means that some of the E. coli originally susceptible to ampicillin have picked up the resistance gene from the surrounding plasmid and are transformed.
Important point to take from this part of the experiment: “How in the world does transformation work?” Restriction enzymes are added, which cut the DNA at a particular sequence and open the DNA so that it can be inserted into another such region in the main E. coli chromosome, which is treated with the same restriction enzyme. If the opened DNA from the plasmid happens to find and attach to DNA of the E. coli that is added to the tube, hallelujah, transformation occurs. In order for this transformation to succeed, the E. coli must be competent, which means ready to accept the foreign DNA from the environment. This competence is ensured by treating the cells with calcium or magnesium. Don’t worry too much about how this competence business really works. Just know that bacteria must be competent for transformation to occur.
Key Concepts
✵ DNA works the same for all cells, both eukaryotic and prokaryotic.
✵ By adding a gene (changing an organism’s genotype), you can change how it looks (its phenotype).
✵ Environmental factors can affect gene expression! If lactose is present, E. coli’s lac operon will turn on.
Investigation 9: Biotechnology: Restriction Enzyme Analysis of DNA
The three activities in this lab all work together to analyze and compare DNA sequences. For example, after cutting DNA samples from two different people with the same restriction enzymes, you would see that the RFLP patterns produced by gel electrophoresis are different. Do you have no idea what that last sentence even means? Read on . . .
IST
Information Storage and Transmission
Activity 1: Restriction Enzymes
Restriction enzymes are special because they are very picky about their job—they cut DNA at very specific sequences, called restriction sites. Many restriction sites are a 4- to 10-nucleotide base pair (bp) palindrome, a sequence that reads the same from either direction. If a restriction enzyme cuts exactly in the center of the restriction site, it will create blunt ends; if it cuts the backbone in two places, the pieces will have single-stranded overhanging “sticky” ends with exposed hydrogen bonds. If you cut two different DNA sequences with the same restriction enzyme, and if sticky ends are created, you could use ligase to then glue two sequences together, even if the DNA was not originally from the same organism! That is called a recombinant DNA molecule, and it is the basis of many biotechnological wonders. For example, if you isolate the human insulin gene with a restriction enzyme, and use that same enzyme to cut open a bacterial plasmid, you could glue the human gene into the plasmid. That’s how therapeutic insulin is produced today (thank you, E. coli).
Activity 2: DNA Mapping Using Restriction Enzymes
Say you wanted to identify somebody based on his or her DNA. You hear about it all the time, but how is it actually done? Using those restriction enzymes we just talked about, you can cut up a sample of DNA and look at the sizes of the distinct little pieces you have created (this requires gel electrophoresis—more on that in a bit). Everyone has a unique pattern of different lengths of DNA fragments. Restriction mapping is a way to create an organism’s unique genetic “fingerprint.” These unique DNA fragments are called restriction fragment length polymorphisms (RFLPs). But how do you arrange these little pieces in such a way that you can compare the DNA of two or more people? Once again, read on . . .
Activity 3: Gel Electrophoresis
Another important biotechnological tool is gel electrophoresis (Figure 13.10. Gel electrophoresis is a lab technique used to separate DNA on the basis of size. When there is an electric current running from one end of the gel to the other, the fragments of DNA dumped into the wells at the head of the gel will migrate to the other side, with the smaller pieces moving the fastest. The more voltage there is running through the gel, the faster the DNA will migrate. The longer the voltage is run through the gel, the farther the DNA will migrate. The more DNA cut by the same restriction enzymes you put into each well, the thicker the bands will be on the gel. If you reverse the flow of the current on the gel, the DNA will migrate in the opposite direction. The DNA just wants to go toward the positive charge . . . optimists, we suppose.
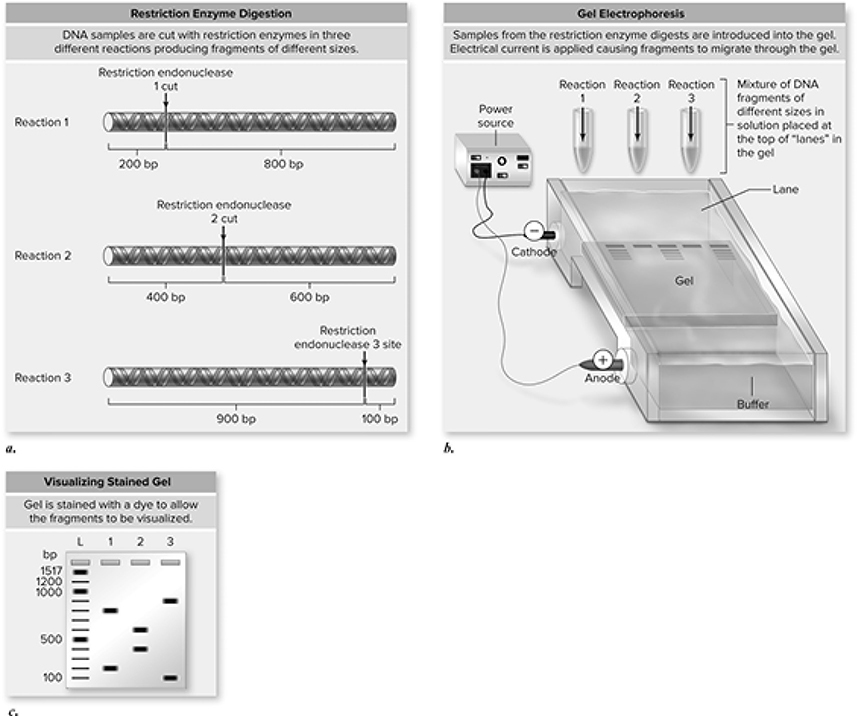
Figure 13.10 Gel electrophoresis separates DNA fragments based on size. a. Three restriction enzymes are used to cut DNA into specific pieces, depending on each enzyme’s recognition sequence. b. The fragments are loaded into a gel (agarose or polyacrylamide), and an electrical current is applied. The DNA fragments migrate through the gel based on size, with larger fragments moving more slowly. c. This results in a pattern of fragments separated based on size, with the smaller fragments migrating farther than larger ones. A series of fragments of known sizes produces a ladder so that sizes of fragments of unkown size can be estimated (bp = base-pairs; L = ladder; 1, 2, 3 = fragments from piece of DNA cut with restriction endonucleases 1, 2, and 3, respectively). (Reproduced with permission from Raven P, Johnson G, Mason K, Losos J, Duncan T; Biology, 12th ed. New York: McGraw Hill; 2020)
Important Facts About Electrophoresis
1. DNA migrates from negative to positive charges.
2. Smaller DNA travels faster than larger DNA.
3. The DNA migrates only when the current is running.
4. The more voltage that runs through the gel, the faster the DNA migrates.
5. The more time the current runs through the gel, the farther the DNA goes.
Key Concepts
✵ Understand how to use restriction enzymes and gel electrophoresis to create genetic profiles.
✵ The pattern made by RFLP using gel electrophoresis will look different for each individual.
Investigation 10: Energy Dynamics
You will create a simple model of an ecosystem, with a single producer (plant) and a single consumer (caterpillars). Producers are so important because they capture the sun’s energy and convert it into a form that can be used by us nonphotosynthetic organisms (consumers). The term gross productivity refers to the total amount of energy captured by producers. The net productivity is the amount of that energy that is actually stored by the plant (and thus is available for consumers to munch on).
IST: SYI
Systems Interactions
As you may recall, the second law of thermodynamics says that energy transfer is never 100 percent efficient. This lab demonstrates that fact by tracking energy as it travels through a food chain. Specifically, how much of a plant’s energy is actually used by the caterpillars who eat it? How much is applied to the caterpillar’s growth, and how much is burned up in cellular respiration? Also, be aware that this lab has the best procedure direction of the entire year: you get to mass the frass (more on that in a bit).
Basic Setup
You will determine the total weight of all your caterpillars at the beginning of the investigation and then, after they feed for three days, weigh them again. Their change in mass was fueled by the plants they ate. The question is what percentage of that plant’s energy was actually turned into caterpillar mass? If you determine the plant energy consumed by each larva, and also take into consideration the amount of their food that wasn’t actually used (caterpillar poop, also called “frass”), then you’re left with the amount of the producer’s energy that was used for the caterpillar’s metabolism. Furthermore, if you knew the amount of plant energy consumed by the larva, and subtracted from that both the energy lost in the poop and energy used for the caterpillar’s increase in mass, what you’re left with is the energy used in respiration. See Figure 13.11 for an example of this thought process.
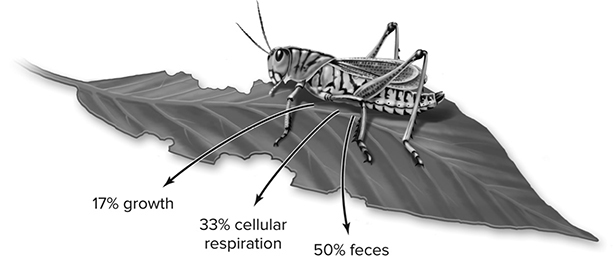
Figure 13.11 The fate of ingested chemical-bond energy: Why all the energy ingested by a heterotroph is not available to the next trophic level. A heterotroph such as this herbivorous insect assimilates only a fraction of the chemical-bond energy it ingests. In this example, 50% is not assimilated and is eliminated in feces; this eliminated chemical-bond energy cannot be used by the primary carnivores. A third (33%) of the ingested energy is used to fuel cellular respiration and thus is converted to heat, which cannot be used by the primary carnivores. Only 17% of the ingested energy is converted into insect biomass through growth and can serve as food for the next trophic level, but not even that percentage is certain to be used in that way because some of the insects die before they are eaten. (Reproduced with permission from Raven P, Johnson G, Mason K, Losos J, Duncan T; Biology, 12th ed. New York: McGraw Hill; 2020)
Results
You should find that, no, energy transfer isn’t perfect. All of that plant’s energy was not, in fact, transferred to and used by the caterpillars.
Key Concepts
✵ Understand how this lab relates to the idea of how living organisms use free energy.
✵ Biomass is the mass of living tissue minus any water weight.
Investigation 11: Transpiration
This experiment takes the concepts found in Chapter 6, Cell Structure and Function, and applies them to the material in Chapter 12, Ecology. You might want to review the material on plant anatomy and vascular tissue before you begin.
IST: SYI
Systems Interactions
Here is just a quick reminder of how water moves from the soil to the leaves and branches of a plant (Figure 13.12. Three minor players in the transport of water are capillary action, osmosis, and root pressure. Water is drawn into the xylem (the water superhighway for the plant) by osmosis. The osmotic driving force is created by the absorption of minerals from the soil, increasing the solute concentration within the xylem. Once in the xylem, root pressure aids in pushing the water a small way up the superhighway. The main driving force for the movement of water in a plant from root to shoot is transpiration. When water evaporates from the plant, it causes an upward tug on the remaining water in the xylem, pulling it toward the shoots. The cohesive nature of water molecules contributes to this transpiration-induced driving force of water through the xylem of the plants. Water molecules like to stick together, and when one of their kind is pulled in a certain direction, the rest seem to follow.
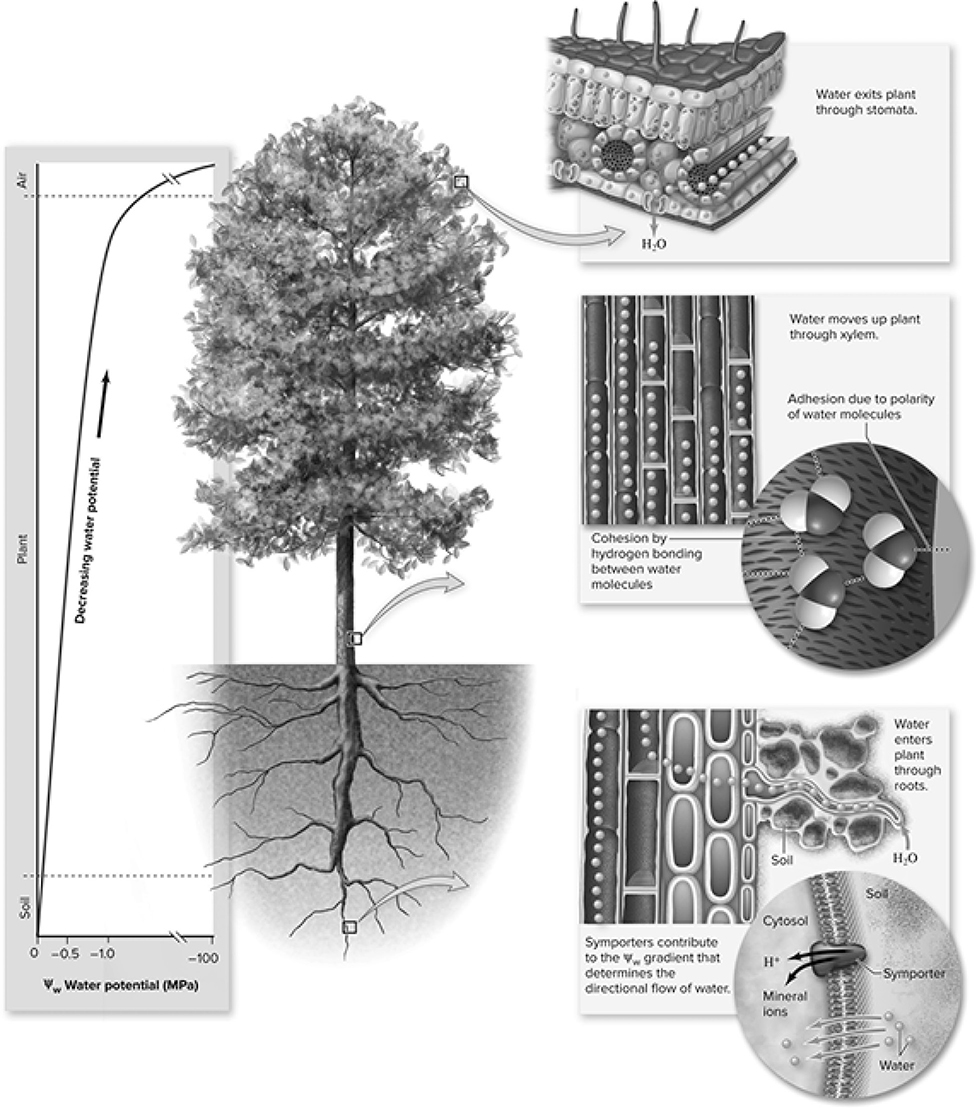
Figure 13.12 Water potential is higher in soil and roots than at the shoot tip. Water evaporating from the leaves through the stomata causes additional water to move upward in the xylem and also to enter the plant through the roots. Water potential drops substantially in the leaves due to transpiration. (Reproduced with permission from Raven P, Johnson G, Mason K, Losos J, Duncan T; Biology, 12th ed. New York: McGraw Hill; 2020)
This experiment examines various environmental factors that affect the rate of transpiration: air movement, humidity, light intensity, and temperature. The rate of transpiration increases with increased air movement, decreased humidity, increased light intensity, and increased temperature. It is not hard to remember that increased temperature leads to increased transpiration—think about how much more you sweat when it is hot. It also makes sense that decreased humidity would lead to an increase in the rate of transpiration. When it is less humid, there is less moisture in the air, and thus there is more of a driving force for water to leave the plant. Imagine that you are standing with a 40-watt bulb shining on your neck, and then a 100-watt bulb shining on your neck. The higher-wattage bulb will probably cause you to sweat more. The same thing with plants: the higher the intensity of the light, the more transpiration that occurs. Air movement is less obvious. If there is good airflow, then evaporated water on leaves is removed more quickly, increasing the driving force for more water to transpire from the plant.
Basic Setup
One easy and straightforward way to measure water loss is by measuring the entire plant’s mass every day for about a week. This “whole plant” method requires you to tightly seal a plastic sandwich bag around the root ball so the only water loss is through the leaves. Furthermore, if the poor plant is even thinking about flowering, you need to ensure that it does not do so (pull off any flowers or buds). Once you understand this basic setup, the real fun begins: inquiry! Think of some variables that may affect transpiration from your poor plants. Sun? Wind? It’s up to you. One plant will be your control, and every other plant will be assigned a single variable. Take the weights of your little guys as soon as they’re all ready to go; this will be your time zero weights. Then measure the weights again 24 hours later, for as many days as your teacher indicates. Remember that if a leaf falls off during this experiment, it has to stay with the plant for subsequent weighings. When your data collection is over, you need to determine the best way to compare results between treatments. Just looking at the total change in weight doesn’t really get you anywhere; it’s hard to compare if the initial plant weights were different to begin with. Calculating percent change would help. But what if you need to determine the total surface area (cm2) of your leaves? The idea of outlining each and every leaf on a piece of grid paper makes even the most dedicated AP Biology student weep, so here’s a suggestion: Calculate the surface area for only one lucky little leaf, and then weigh it. Now you have a conversion ratio (SA/g) you can use to determine the (approximate) surface area for all the leaves. All you need to do is determine how much all those leaves weigh. Easy!
Another method of measuring water loss is by using a device called a potometer. This tracks transpiration from only part of a plant that has been inserted into a water-filled tube with a pipette stuck on the other end. As water evaporates from the leaves, the water is pulled down the pipette, allowing you to track changes in volume.
Results
Ideally, any treatment that increased water loss through either more photosynthesis (e.g., light) or more evaporation from the leaf surfaces (e.g., wind) would decrease your plant’s weight. On the flip side, if you slow down transpiration by creating a humid environment (e.g., misting your plant) or slow down photosynthesis (e.g., stick the poor plant in the dark), you would expect water loss to be slowed.
Key Concepts
✵ The higher the leaf surface area, the greater the rate of transpiration.
✵ The more stomata, the more water loss.
✵ An increase in water potential of the environment would slow evaporation; a decrease in water potential would increase evaporation.
Investigation 12: Fruit Fly Behavior
This experiment draws on information found in Chapter 12, Ecology. This experiment is basically an exercise in messing with fruit flies’ heads. You get to stick them in a choice chamber and explore environmental factors that either attract or repel them.
IST: SYI
Systems Interactions
Basic Setup
First, get to know your flies. For example, males have a darker abdomen, whereas females’ abdomens are pale and rounder. Next, you get to create something called a choice chamber. In this experiment the chamber consists of two plastic bottles with their bottoms cut off and joined together with tape. Each end of the chamber will have one of the substances you decide to test. You can also use the chamber to investigate the flies’ response to other variables, such as light or gravity. No matter what you’re interested in, wrangle about 25 of those little creatures in there and let them get used to their new digs. Place a cotton ball with a few drops of water in the cap at one end (control) and a few drops of the substance you’re testing at the other end. The flies will exhibit positive chemotaxis if they move toward the substance you’re testing, negative chemotaxis if they move away from it.
Results
It is not important that you take away from this experiment that fruit flies enjoy the scent of one type of substance over another. What is important is that you recognize how to set up an experiment such as this one involving the choice chamber to measure chemotaxis in animals.
Key Skills
✵ Design a controlled experiment to determine environmental factors that either attract or repel your fruit flies.
✵ Analyze your data to identify the effect of environmental factors on your flies’ behavior.
Investigation 13: Enzyme Activity
This experiment draws on information from Chapter 5, Chemistry of Life. The experiment is designed to practice the calculation of the rate of enzyme-catalyzed reactions through the measurement of the products produced. In this particular experiment, the enzyme peroxidase is used to convert hydrogen peroxide to water and oxygen, and the products are measured to assist in the determination of the rate of reaction. If you do not feel comfortable with your knowledge of enzyme-substrate interactions, refer to Chapter 7, Cellular Energetics, before continuing this section.
IST: SYI
Systems Interactions
The Nitty-Gritty About Experiment 2
The reaction of interest in this experiment is as follows:
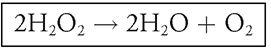
This reaction does indeed occur without the assistance of peroxidase, but it occurs at a slow rate. When our friend peroxidase is added to the mix, the reaction occurs at a much faster clip. Take a look at the enzymatic activity curve in Figure 13.13. Notice the constant rate of reaction in the first six minutes of the experiment.
Figure 13.13 Enzyme-activity curve. (Reproduced with permission from Raven P, Johnson G, Mason K, Losos J, Duncan T; Biology, 12th ed. New York: McGraw Hill; 2020)
However, after the sixth minute, the rate slows, as if the enzyme has become tired. This is because as the reaction proceeds, the number of substrate molecules remaining declines, which means that fewer enzyme-substrate interactions can occur. When calculating the rate of reaction, it is the constant linear portion of the curve that matters. That is the accepted rate value for the enzyme. Do not attempt to factor in the slowing portion of the curve.
Basic Setup
In this particular experiment, turnip peroxidase is added to a beaker that holds H2O2 and is allowed to react for a certain period of time. After the reaction stops, the amount of O2 produced is measured using the color indicator guaiacol. Guaiacol readily grabs and binds to oxygen, forming tetraguaiacol, a brown chemical. The greater the amount of oxygen produced, the darker brown your solution becomes. The relative amount of oxygen is determined by comparing the color of the tube to a turnip peroxidase color chart (a previously made series of dilutions of the oxygen-guaiacol reaction). Once you’re comfortable with the experimental setup, you will investigate at what pH peroxidase works its best.
Results
You’ll have six test tubes, each with a different pH buffer. Once the reaction has proceeded long enough to produce a nice color spectrum among all the different pH solutions, record the color for each tube. Once you use your lab manual’s turnip peroxidase color chart to help you quantify the relative amounts of oxygen produced, you can graph your data as color intensity versus pH. Peroxidase is found in many different forms with optimum pHs ranging from 4 to 11 depending on the source. Turnip peroxidase, for example, tends to work best at pH 5.
Key Concepts
✵ The reaction rate can be affected by four major factors: pH, temperature, substrate concentration, and enzyme concentration.
✵ The rate of reaction can be found by measuring either the appearance of product or the disappearance of reactant. Either measure can provide insight into the effectiveness of an enzyme’s presence.
✵ When calculating the rate of reaction, remember that the rate is actually the portion of the graph with a constant slope.
✵ To determine the ideal pH at which an enzyme functions, run the enzyme reaction at a series of different pH values and measure the various reaction rates.
![]() Review Questions
Review Questions
1. If a dialysis bag with a solute concentration of 0.6 M is placed into a beaker with a solute concentration of 0.4 M, in which direction will water flow?
A. Water will flow from the dialysis bag to the beaker.
B. Water will flow from the beaker into the dialysis bag.
C. Water will first flow out of the bag, and then back into the bag.
D. The solution is already in equilibrium, and water will not move at all.
2. What is the rate of reaction for the enzyme— substrate interaction shown in the graph below?
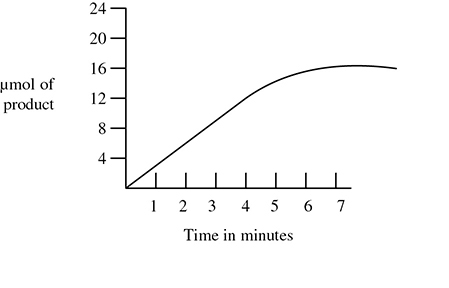
A. 6 μmol/min (micromoles per minute)
B. 5 μmol/min
C. 4 μmol/min
D. 3 μmol/min
3. In an experiment involving Sordaria, an ascomycete fungus, it was found that of 450 offspring produced, 58 yielded a 2:2:2:2 ratio and 32 a 2:4:2 ratio. Approximately how far apart is the gene from the centromere?
A. 10.0 map units
B. 15.0 map units
C. 20.0 map units
D. 25.0 map units
4. A plant would show the highest rate of transpiration under which of the following conditions?
A. High humidity
B. Low temperature
C. High light intensity
D. Low air movement
5. Which of the following will result in a quicker rate of DNA migration on an electrophoresis gel?
A. Increase in temperature of the gel
B. Increase in amount of DNA added to the well
C. Reversal of charge of gel, switching positive and negative sides
D. Increase in current flowing through the gel
6. A lab experiment is set up in which the participants are heterozygous individuals (Aa). After the F1 generation is produced, 40 percent of the participants are randomly removed from the experiment and the remaining 60 percent are left to continue breeding. This experiment would be used to show what phenomenon?
A. Natural selection
B. Genetic drift
C. Gene flow
D. Mutation
7. You are studying a population of pea plants with flower colors ranging from white to dark pink. You selected only those plants with the darkest pink flowers to use in cross-pollination. Once you plant the seeds and grow your new generation of pea plants, what would you expect to see?
A. The relative numbers of flower colors would remain unchanged.
B. You would see disruptive selection.
c. Your results would show directional selection.
D. The relative numbers of white flowers would increase.
8. Which of the following would indicate you successfully transformed your E. coli culture with the plasmid containing the gene for ampicillin resistance?
A. The ampicillin-containing agar plates would show growth from your control culture (E. coli without the plasmid), but not your transformed culture.
B. The ampicillin-containing agar plates would show growth from your transformed culture, but not the control.
C. The transformed culture would not grow on the agar-only plates.
D. Both the transformed E. coli and the untransformed E. coli would grow on the plain agar plates.
![]() Answers and Explanations
Answers and Explanations
1. B—The water will flow into the dialysis bag because the solute concentration in the bag is higher than that of the beaker. This creates an osmotic driving force that moves water into the bag in an effort to equalize the discrepancy in solute concentrations.
2. D—The rate of reaction can be approximated by calculating the slope of the straight portion of the graph. In this case it is 15 μmol of product produced in 5 minutes for an approximate rate of 3 μmoles/min.
3. A—The distance between the gene and the centromere in Sordaria is determined by adding up the number of crossovers that occur and dividing that by the number of offspring produced. This quotient should be multiplied by 100, and that product represents the percent of the offspring that experienced crossover. This percentage should be divided by 2 to obtain the distance from the centromere to the gene of interest.
4. C—The factors that increase the rate of transpiration are high light intensity, high temperature, low humidity, and high airflow.
5. D—The more current you put through the gel, the faster the DNA will migrate. Adding more DNA will result in thicker bands. Reversing the positive and negative ends will swap the direction in which the DNA migrates. Running the gel for a longer amount of time will increase the distance that the DNA fragments travel, and increasing the temperature really won’t have too much of an effect.
6. B—This is an example of genetic drift, in which a random chunk of the population is eliminated resulting in a potential change in the frequencies of the alleles being studied.
7. C—If you allow only the plants with the dark-pink flower genes to reproduce, those are the genes that will be passed on to the next generation. This will shift the average flower color towards the darker end of the spectrum, an example of directional selection.
8. B—By successfully transforming your E. coli, you are giving it the gene that enables it to survive in the presence of ampicillin (something the bacteria are unable to do otherwise). Therefore, you have successfully transformed your culture if it grows on ampicillin-containing agar, but the control culture without the plasmid dies.
![]() Rapid Review
Rapid Review
Investigation 1: Artificial Selection
✵ To demonstrate evolution in a plant population, choose which traits are selected for and cross-pollinate only between those selected plants. Once the offspring (seeds) are planted and grown, check this trait to see if it is more prevalent in the new population.
✵ This is an example of directional selection, when members of a population at one end of a spectrum are selected for, whereas the trait at the other end of the spectrum becomes rarer.
Investigation 2: Mathematical Modeling: Hardy-Weinberg
✵ The Hardy-Weinberg equation is used to check the frequencies of alleles in a population that is not evolving. This “snapshot” of the population is used as a point of comparison, to see if evolution does occur (and changes the allelic frequencies).
✵ For a given gene, there is the p allele and the q allele. Therefore, p + q = 1.
✵ For that same gene, organisms can be homozygous dominant (pp), homozygous recessive (qq), or heterozygous (pq or qp). Therefore, p2 + 2pq + q2 = 1.
✵ By altering any of the five conditions required for a non-evolving Hardy-Weinberg population, you can cause a change in your population’s gene pool.
Investigation 3: Comparing DNA Sequences to Understand Evolutionary Relationships with BLAST
✵ BLAST is a computer program used to compare specific genes from different organisms.
✵ The more similar the nucleotide base sequence between two genes, the closer the evolutionary relationship.
✵ A cladogram is a visual representation of the evolutionary relatedness of a species.
Investigation 4: Diffusion and Osmosis
✵ Water flows from hypotonic (low solute) to hypertonic (high solute).
✵ To measure diffusion and osmosis, take dialysis bags containing solutes of varying concentrations, place them into beakers containing solutions of various concentrations, and record the direction of flow during each experiment.
Investigation 5: Photosynthesis
✵ To experimentally determine the photosynthetic rate of various plants in various environments, first remove the air from leaf disk samples and add the samples to water containing sodium bicarbonate (a source of carbon dioxide). They will sink to the bottom of the cup.
✵ As the leaf tissue photosynthesizes, oxygen is released, causing the disks to rise to the surface. Expose different plant samples to different environmental conditions, measure how much photosynthesis occurs (ET50), and then compare.
Investigation 6: Cell Respiration
✵ To experimentally determine the rate of respiration in peas, use a respirometer to calculate the change in volume that occurs around the peas. Set up (1) a control group of nongerminating peas that will have a lower baseline respiration rate, (2) a control group that measures the change in oxygen due to pressure and temperature changes, and (3) an experimental group that contains the group whose respiration rate you want to measure.
Investigation 7: Cell Division: Mitosis and Meiosis
✵ To determine experimentally the percentage of cells in a particular stage of the cell cycle, examine an onion root slide and count the number of cells per stage. Divide the number in each stage by the total number of cells to determine the relative percentages.
✵ To determine how far a gene for an ascomycete fungus is from its centromere, cross a wild-type strain with a mutant and examine the patterns among the ascospores. A ratio of 4:4 means no crossover occurred, whereas ratios of 2:2:2:2 or 2:4:2 indicate crossing over did occur. Total number of crossover divided by total number of offspring equals the percent crossover. Divide this by 2 to get the distance from the centromere.
Investigation 8: Biotechnology: Bacterial Transformation
✵ To run a transformation, add ampicillin-sensitive bacteria to two tubes, and to only one of the two, add a plasmid containing both the gene you would like to transform and the gene for ampicillin resistance. The other tube is the control. Ice the two tubes for 15 minutes, then quickly heat-shock the cells into picking up foreign DNA. Ice the tubes again, spread the bacteria out on ampicillin-coated plates, and incubate overnight. If transformation occurs, your bacteria will grow on the ampicillin plate.
Investigation 9: Biotechnology: Restriction Enzyme Analysis of DNA
✵ Gel electrophoresis can be used in court to determine if an individual committed a crime or if an individual is the parent of a particular child. Each person has a particular DNA fingerprint. When that individual’s DNA is cut with restriction enzymes and run on an electrophoresis gel, it will show a unique pattern that only that person has. By matching a person’s DNA fingerprint with that of the child of interest or the evidence from the crime scene, proper identifications can be made.
Investigation 10: Energy Dynamics
✵ A simple model system can be used to track how much energy is transferred from a single producer (plant) to a single consumer (caterpillars).
✵ By weighing the amount of plant eaten by the caterpillars (and the amount of the plant excreted), it is possible to calculate the percent of the plant’s energy that was either incorporated into the caterpillar’s body or used in cellular respiration.
✵ These are methods for estimating the efficiency of transfer of energy from producer to consumer.
Investigation 11: Transpiration
✵ To design an experiment to test the effects of various environmental factors on the rate of transpiration, measure the amount of water that evaporates from the surface of plants over a certain amount of time under normal conditions. You can do this using the whole-plant method or by using a piece of equipment known as a potometer, a device that measures water loss by plants. Compare the normal rate with the rates obtained when the temperature, humidity, airflow, or light intensity is altered. If you run an experiment of this nature, it is important to measure the surface area of the leaves involved because larger surface areas can transpire more water more quickly.
Investigation 12: Fruit Fly Behavior
✵ To study kinesis of an insect such as a fruit fly, create a contraption known as a choice chamber, which is designed to study which of two substances an organism prefers. For example, one-half of the choice chamber may contain banana extract, the other distilled water. Place the organism of interest into the choice chamber and record how many of that organism are on each side of the chamber every 30 seconds. This procedure can also be performed for a choice chamber that has differing temperatures, humidities, light intensities, salinities, and other parameters.
Investigation 13: Enzyme Activity
✵ Enzyme reaction rate is affected by pH, temperature, substrate concentration, and enzyme concentration.
✵ To test the rate of reactivity of an enzyme and the difference it makes compared to the speed of the normal reaction, run the reaction without an enzyme, then run it with your enzyme, and compare.
✵ To determine the ideal pH (or temperature) for an enzyme, run the reaction at varying pH values (or temperatures) and compare.