5 Steps to a 5: AP Biology - Mark Anestis 2021
STEP 4 Review the Knowledge You Need to Score High
CHAPTER 12 Ecology
Exam Weight: 10—15%
IN THIS CHAPTER
Summary: This chapter focuses on the interaction between animals and their environments (ecology) and introduces you to some of the basic terms used in behavioral ecology and ethology.

Key Ideas
![]() Learn the bold-faced terms in this chapter well because they show up often on the multiple-choice portion of the exam.
Learn the bold-faced terms in this chapter well because they show up often on the multiple-choice portion of the exam.
![]() Types of animal learning: associative learning, fixed-action pattern, habituation, imprinting, insight learning, observational learning, and operant conditioning.
Types of animal learning: associative learning, fixed-action pattern, habituation, imprinting, insight learning, observational learning, and operant conditioning.
![]() Three major types of animal movement: kinesis, migration, and taxis.
Three major types of animal movement: kinesis, migration, and taxis.
![]() Behavioral patterns/concepts to know: agonistic behaviors, altruistic behaviors, coefficient of relatedness, dominance hierarchies, foraging, inclusive fitness, optimal foraging, reciprocal altruism, and territoriality.
Behavioral patterns/concepts to know: agonistic behaviors, altruistic behaviors, coefficient of relatedness, dominance hierarchies, foraging, inclusive fitness, optimal foraging, reciprocal altruism, and territoriality.
![]() Types of animal communication: chemical, visual, auditory, and tactile.
Types of animal communication: chemical, visual, auditory, and tactile.
![]() Three main types of dispersion patterns: clumped, uniform, and random.
Three main types of dispersion patterns: clumped, uniform, and random.
![]() Two main types of population growth: exponential (J-shaped) and logistic (S-shaped).
Two main types of population growth: exponential (J-shaped) and logistic (S-shaped).
![]() Two primary life history strategies: K-selected and R-selected populations.
Two primary life history strategies: K-selected and R-selected populations.
![]() Three main symbiotic relationships: commensalism, mutualism, and parasitism.
Three main symbiotic relationships: commensalism, mutualism, and parasitism.
![]() Defense mechanisms: aposematic coloration, Batesian mimicry, cryptic coloration, deceptive markings, and Müllerian mimicry.
Defense mechanisms: aposematic coloration, Batesian mimicry, cryptic coloration, deceptive markings, and Müllerian mimicry.
![]() Biomes that come up on the AP exam: desert, savannah, taiga, temperate deciduous forest, temperate grassland, tropical forest, tundra, and water.
Biomes that come up on the AP exam: desert, savannah, taiga, temperate deciduous forest, temperate grassland, tropical forest, tundra, and water.
![]() Have a general understanding of the biogeochemical cycles (carbon, nitrogen, and water).
Have a general understanding of the biogeochemical cycles (carbon, nitrogen, and water).
Behavioral Ecology
ENE-3
Timing and coordination of biological mechanisms involved in growth, reproduction, and homeostasis depend on organisms responding to environmental cues.
Behavioral ecology and ethology both involve the study of animal behavior. Behavioral ecology focuses on the interaction between animals and their environments, and usually includes an evolutionary perspective. For example, a behavioral ecologist might ask, “Why do two bird species that live in the same environment eat two different types of seeds?” Ethology is a narrower field, focused particularly on animal behavior and less on ecological analysis. Historically, ethology has involved a lot of experimental work, which has given us insight into the nature of animal minds.
This chapter introduces you to some of the basic terms and concepts used in behavioral ecology and ethology.
Types of Animal Learning
Associative learning is the process by which animals take one stimulus and associate it with another. Ivan Pavlov demonstrated classical conditioning, a type of associative learning, with dogs. As will come to be a pattern in this chapter, some poor animals were tampered with to help us understand an important biological principle. Pavlov taught dogs to anticipate the arrival of food with the sound of a bell. He hooked up these dogs to machines that measured salivation. He began the experiments by ringing a bell just moments before giving food to the dogs. Soon after this experiment began, the dogs were salivating at the sound of the bell before food was even brought into the room. They were conditioned to associate the noise of the bell with the impending arrival of food; one stimulus was substituted for another to evoke the same response.
A fixed-action pattern (FAP) is an innate, preprogrammed response to a stimulus (Figure 12.1. Once this action has begun, it will not stop until it has run its course. For example, male stickleback fish are programmed to attack any red-bellied fish that come into their territory. Males do not attack fish lacking this red coloration; it is specifically the color that stimulates aggressiveness. If fake fish with red bottoms are placed in water containing these stickleback fish, there’s bound to be a fight! But if fake fish lacking a red bottom are dropped in, all is peaceful.

Figure 12.1 Innate egg-rolling response in geese. The series of movements used by a goose to retrieve an egg is a fixed action pattern. Once it detects the key stimulus (in this case, an egg outside the nest), the goose goes through the entire set of movements: It will extend its neck toward the egg, get up, and roll the egg back into the nest by moving its neck from side to side with the egg positioned under its bill. (Reproduced with permission from Raven P, Johnson G, Mason K, Losos J, Duncan T; Biology, 12th ed. New York: McGraw Hill; 2020)
Habituation is the loss of responsiveness to unimportant stimuli. For example, as one of us started working on this book, he had just purchased a new fish tank for his office and was struck by how audible the sound of the tank’s filter was. As he sits here typing tonight about two months later, he does not even hear the filter unless he thinks about it; he has become habituated to the noise. There are many examples of habituation in ethology. One classic example involves little ducklings that run for cover whenever birdlike objects fly overhead. If one were to torture these poor baby ducks and throw bird-shaped objects over their heads, in the beginning they would head for cover each time one flew past them, but over time as they learned that the fake birds did not represent any real danger, they would habituate to the mean trick and eventually not react at all. One side note is that ethologists who study wild animals usually have to habituate their study subjects to their presence before recording any behavioral data.
Imprinting is an innate behavior that is learned during a critical period early in life. For example, when geese are born, they imprint on motion that moves away from them, and they follow it around accepting it as their mother. This motion can be the baby’s actual mother goose, it can be a human, or it can be an object. Once this imprint is made, it is irreversible. If given an essay about behavioral ecology, and imprinting in particular, the work of Konrad Lorenz would be a nice addition to your response. He was a scientist who became the “mother” to a group of young geese. He made sure that he was around the baby geese as they hatched and spent the critical period with them creating that mother—baby goose bond. These geese proceeded to follow him around everywhere and didn’t recognize their real mother as their own.
Insight learning is the ability to do something right the first time with no prior experience. It requires reasoning ability—the skill to look at a problem and come up with an appropriate solution.
Observational learning is the ability of an organism to learn how to do something by watching another individual do it first, even if they have never attempted it themselves. An example of this involves young chimpanzees in the Ivory Coast, who watch their mothers crack nuts with rock tools before learning the technique themselves.
Operant conditioning is a type of associative learning that is based on trial and error. This is different from classical conditioning because in operant conditioning, the association is made between the animal’s own behavior and a response. This is the type of conditioning that is important to the aposematically colored organisms. For example, a brightly colored lizard with a chemical defense mechanism (it can spray predators in an attempt to escape) relies on this type of conditioning for survival. The coloration pattern is there in the hope that the predator will, in a trial-and-error fashion, associate the coloration pattern with an uncomfortable chemical-spraying experience that it had in the past. This association might make the predator think twice before attacking in the future and provide the prey with enough time to escape.
Animal Movement
There are three major types of animal movement that you should familiarize yourself with for the AP exam: kinesis, migration, and taxis.
Kinesis. This is a seemingly random change in the speed of a movement in response to a stimulus. When an organism is in a place that it enjoys, it slows down, and when in a bad environment, it speeds up. Overall this leads to an organism spending more time in favorable environments. In Chapter 13, Laboratory Review, an example of kinesis involving pill bugs is discussed. These bugs prefer damp environments to dry ones, and when placed into a contraption that gives them the choice of being on the dry or damp side, they move quickly toward the damp side (where the speed of their movement slows).
Migration. This is a cyclic movement of animals over long distances according to the time of year. Birds are known to migrate south, where it is warmer, for the winter. It is amazing that these animals know where to go (Figure 12.2.
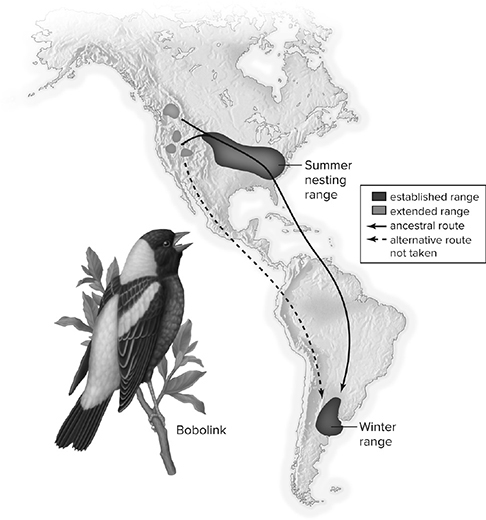
Figure 12.2 Birds on the move. The summer range of bobolinks, Dolichonyx oryzivorus, recently extended to the far western United States from their established range in the Midwest. When birds in these newly established populations migrate to South America in the winter, they do not fly directly to the winter range; instead, they first fly to the Midwest and then use the ancestral flyway, going much farther than if they flew directly to their winter range. (Reproduced with permission from Raven P, Johnson G, Mason K, Losos J, Duncan T; Biology, 12th ed. New York: McGraw Hill; 2020)
Taxis. These are cars taken by people who need transportation. Hmm . . . actually, taxis, the biological term, is a reflex movement toward or away from a stimulus. We always think about summer evenings, sitting on the porch with the bug light near by, watching the poor little moths fly right into the darn thing because of the taxis response. They are drawn to the light at night (phototaxis).
Behave Yourselves, You Animals!
There are several typical behavior patterns that you should familiarize yourself with before the exam.
1. Agonistic behavior. Behavior that results from conflicts over resources. It often -involves intimidation and submission. The battle is often a matter of who can put on the most threatening display to scare the other one into giving up, although the - displays can also be quite subtle. Agonistic behaviors can involve food, mates, and territory, to name only a few. Participants in these displays do not tend to come away injured because most of these interactions are just that: displays.
2. Altruistic behavior. An altruistic action is one in which an organism does something to help another, even if it comes at its own expense. An example of this behavior involves bees. Worker bees are sterile, produce no offspring, and play the role of hive defenders, sacrificing their lives by stinging intruders that pose a threat to the queen bee. (Sounds to us like they need a better agent.) Another example involves vampire bats that vomit food for group mates that did not manage to find food.
3. Coefficient of relatedness. This statistic represents the average proportion of genes that two individuals have in common. Siblings have a coefficient of relatedness (COR) of 0.5 because they share 50 percent of their genes. This coefficient is an interesting statistic because it can be expected that an animal that has a high COR with another animal will be more likely to act in an altruistic manner toward that animal.
4. Dominance hierarchies. A dominance hierarchy among a group of individuals is a ranking of power among the members. The member with the most power is the “alpha” member. The second-in-command, the “beta” member, dominates everyone in the group except for the alpha. It pretty much rocks to be at the top of the dominance hierarchy because you have first dibs (choice) on everything (food, mates, etc.). The dominance hierarchy is not necessarily permanent—there can always be some shuffling around. For example, in chimpanzees, an alpha male can lose his alpha status and become subordinate to another chimp if power relationships change. One positive thing about these hierarchies is that since there is an order, known by all involved, it reduces the energy wasted and the risk from physical fighting for resources. Animals that know that they would be attacked if they took food before a higher-ranking individual wait until it is their turn to eat so as to avoid conflict. Keep in mind that dominance hierarchies are a characteristic of group-living animals.
5. Foraging. A word describes the feeding behavior of an individual. This behavior is not as random as it may seem as animals tend to have something called a search image that directs them toward their potential meal. When searching for food, few fish look for a particular food; rather, they are looking for objects of a particular size that seem to match the size of what they usually eat. This is a search image. In an aquarium at mealtime, if you watch the fish closely, you will see them zoom around taking food into their mouths as they swim. Unfortunately, sometimes the “food” they ingest is the bathroom output of another fish that happens to be the same size as the food and is floating nearby. Simply because the fish dropping is the appropriate size and fits the search image, the fish may take it into its mouth for a second before emphatically spitting it out.
6. Inclusive fitness. This term represents the overall ability of individuals to pass their genes on to the next generation. This includes their ability to pass their own genes through reproduction as well as the ability of their relatives to do the same. Reproduction by relatives is included because related individuals share many of the same genes. Therefore, helping relatives to increase the success of passage of their genes to the next generation increases the inclusive fitness of the helper. The concept of inclusive fitness can explain many cases of altruism in nature.
7. Optimal foraging. Natural selection favors animals that choose foraging strategies that take into account costs and benefits. For example, food that is rich in nutrients but far away may cost too much energy to be worth the extra trip. There are many potential costs to traveling a long distance for some food—the animal itself could be eaten on the way to the food, and the animal could expend more energy than it would gain from the food. You know that you have displayed optimal foraging behavior before. “Hey, do you want to go to Wendy’s?” “Uhh . . . not really, it’s a really long drive . . . let’s go to Bill’s Burgers down the road instead.”
8. Reciprocal altruism. Why should individuals behave altruistically? One reason may be the hope that in the future, the companion will return the favor. A baboon may defend an unrelated companion in a fight, or perhaps a wolf will offer food to another wolf that shares no relation. Animals rarely display this behavior since it is limited to species with stable social groups that allow for exchanges of this nature. The bats described earlier represent a good example of reciprocal altruism.
9. Territoriality. Territorial individuals defend a physical geographic area against other individuals. This area is defended because of the benefits derived from it, which may include available mates, food resources, and high-quality breeding sites. An individual may defend a territory using scent marking, vocalizations that warn other individuals to stay away, or actual physical force against intruders. Animal species vary in their degree of territoriality (in fact, some species are not territorial), and both males and females may exhibit territorial behavior.
Animal Communication
Animals communicate in many ways. Communication need not always be vocal, and we will discuss the various communication mechanisms in this next section: visual, auditory, chemical, and tactile.
Chemical communication. Mammals and insects use chemical signals called pheromones, which in many species play a pivotal role in the mating game. Pheromones can be power-ful enough to attract mates from miles away.
IST-5
Transmission of information results in changes within and between biological systems.
Visual communication. We mentioned a few visual communication examples earlier, such as agonistic displays. Another example of a visual display is a male peacock’s feather splay, which announces his willingness to mate.
Auditory communication. This mode of communication involves the use of sound in the conveying of a message. In many parts of the United States, if one sits on one’s porch on a summer night, one hears the song of night frogs and crickets. These noises are often made in an effort to attract mates.
Tactile communication. This mode of communication involves touch in the conveying of a message and is often used as a greeting (handshake in humans). A major form of primate tactile communication involves grooming behavior.
Bees provide an example of communication (Figure 12.3 that involves chemical, tactile, and auditory components. The beehive is a dark and crowded place, and when a worker bee returns after having found a good food source, how in the world is it going to get the attention of all of the co-workers? Unfortunately, intercom systems in hives are yet to be developed. What these bees do instead is a little dance; a dance in a tight circle accompanied by a certain wag signifies to the co-workers “Hey guys . . . food source is right down the street.” But if the food is farther away, the bee changes the dance to one that provides directional clues as well. The bee will instead perform a different combination of funky moves. This dance provides distance and directional information to the other workers and helps them find the faraway source. The ever so pleasant chemical component to this process is the regurgitation of the food source to show the other bees what kind of food they are chasing. Imagine if humans did that . . . “Dude, I just found the greatest burger place like two miles from here . . . (burp) here . . . try this burger . . . it’s delightful!”
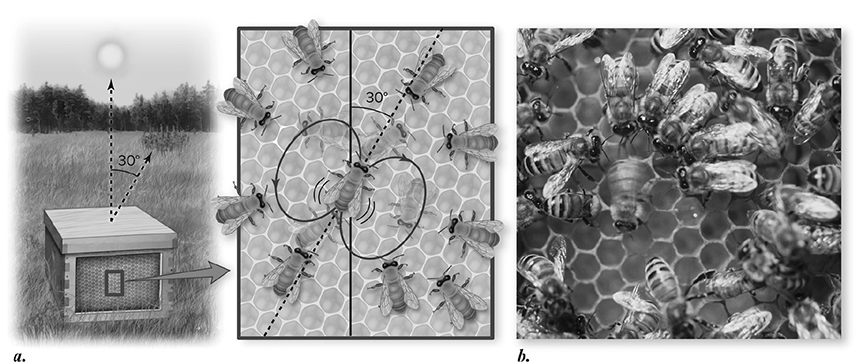
Figure 12.3 The waggle dance of honeybees, Apis mellifera. a. The angle between the food source, the nest, and the Sun is represented by a dancing bee as the angle between the straight part of the dance and vertical. The food is 30° to the right of the Sun, and the straight part of the bee’s dance on the hive is 30° to the right of vertical. b. A scout bee dances on a comb in the hive. (Reproduced with permission from Raven P, Johnson G, Mason K, Losos J, Duncan T; Biology, 12th ed. New York: McGraw Hill; 2020)
Ecology
Ecology is the study of the interaction of organisms and their environments. This chapter covers the main concepts of ecology, including population growth, biotic potential, life history “strategies,” and predator—prey relationships. The chapter will also look at within-community and between-community (intra- and intercommunity) interactions. Finally, we will talk about succession, trophic levels, energy pyramids, biomass pyramids, biomes, and biogeochemical cycles.
Population Ecology and Growth
Like many fields of biology, ecology contains hierarchies of classification. A population is a collection of individuals of the same species living in the same geographic area. A collection of populations of species in a geographic area is known as a community. An ecosystem consists of the individuals of the community and the environment in which it exists. Ecosystems can be subdivided into abiotic and biotic components: biotic components are the living organisms of the ecosystem, while abiotic components are the nonliving players in an ecosystem, such as weather and nutrients. Finally, the biosphere is the entire life-containing area of a planet—all communities and ecosystems.
Three more terms for you: (1) the niche of an organism, which consists of all the biotic and abiotic resources used by the organism; (2) population density, which describes how many individuals are in a certain area; and (3) distribution, which describes how populations are dispersed over that area. There are three main types of dispersion patterns that you should know (see also Figure 12.4):
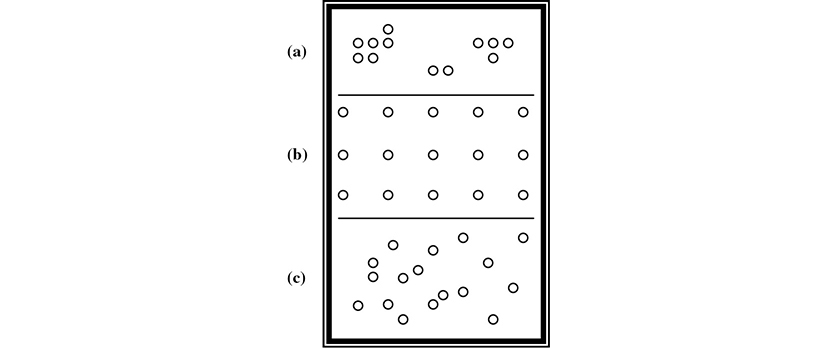
Figure 12.4 Distribution patterns: (a) clumped; (b) uniform; (c) random.
1. Clumped: The individuals live in packs that are spaced out from each other, as in schools of fish or herds of cattle.
2. Uniform: The individuals are evenly spaced out across a geographic area, such as birds on a wire sitting above the highway—notice how evenly spaced out they are.
3. Random: The species are randomly distributed across a geographic area, such as a tree distribution in a forest.
Population ecology is the study of the size, distribution, and density of populations and how these populations change with time. It takes into account all the variables we have mentioned already and many more. The size of the population, symbolized N, indicates how many individuals of that species are in a given area. Demographers study the theory and statistics behind population growth and decline. The following is a list of demographic statistics you should be familiar with for the AP Biology exam:
Liz (college freshman): “Know how to read these charts.”
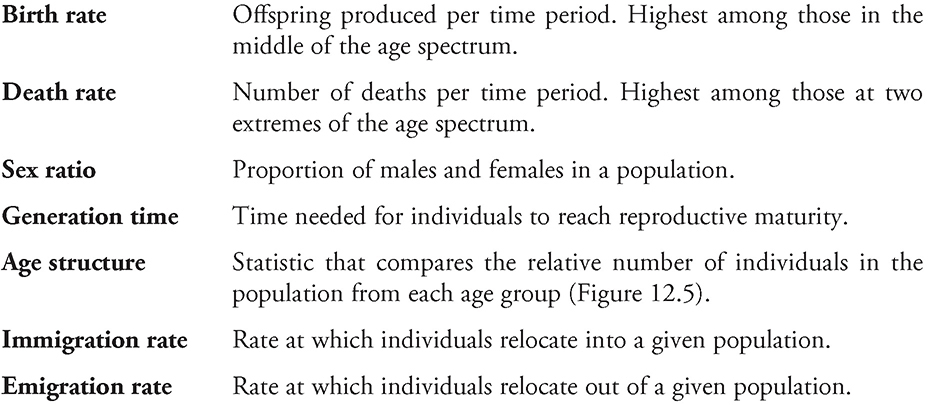
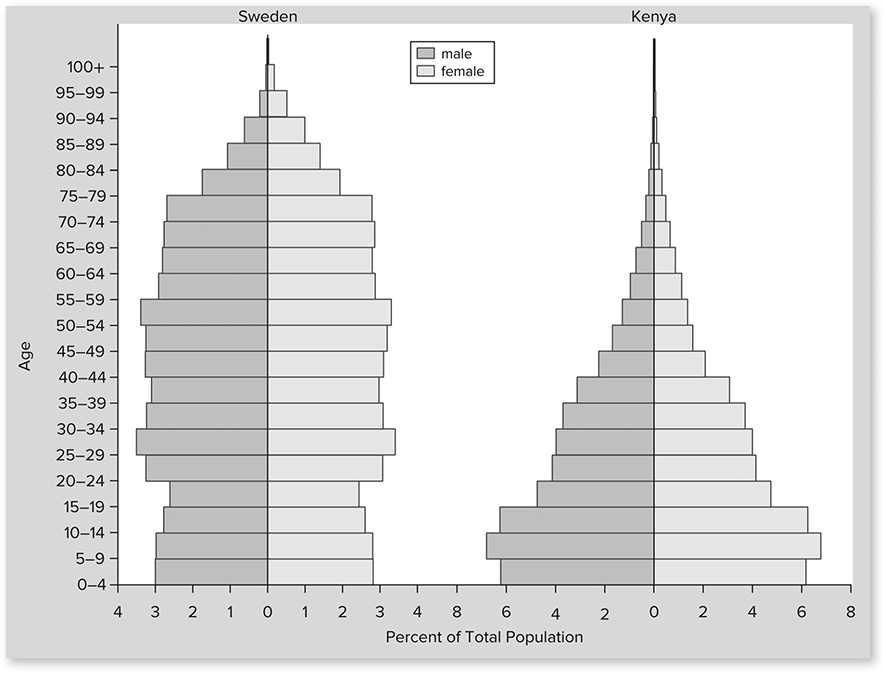
Figure 12.5 A typical age structure chart. (Reproduced with permission from Raven P, Johnson G, Mason K, Losos J, Duncan T; Biology, 12th ed. New York: McGraw Hill; 2020)
All these statistics together determine the size and growth rate of a given population. Obviously, a higher birth rate and a lower death rate will give a faster rate of population growth. A high female sex ratio could lead to an increase in the number of births in a population (more females to produce offspring). A short generation time allows offspring to be produced at a faster rate. An age structure that consists of more individuals in the middle of their reproductive years will grow at a faster rate than one weighted toward older people.
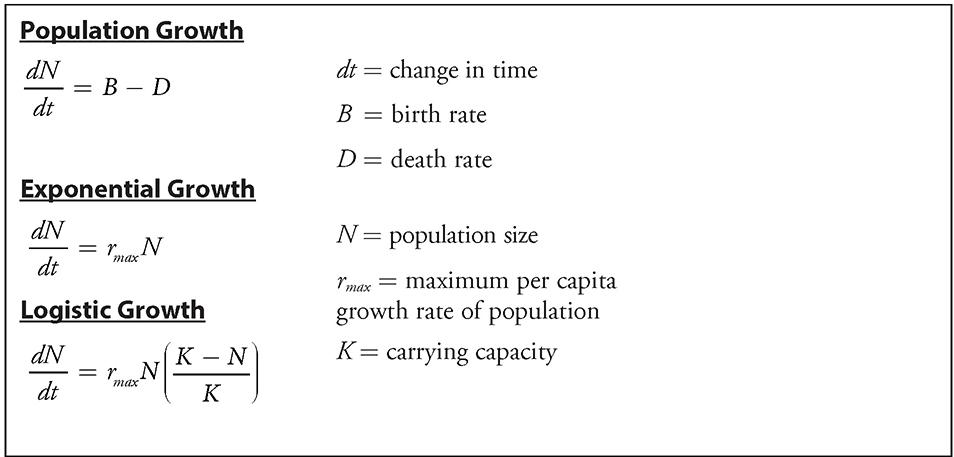
Population Growth and Size
Biotic potential is the maximum growth rate of a population given unlimited resources, unlimited space, and lack of competition or predators. This rate varies from species to species. The carrying capacity is defined as the maximum number of individuals that a population can sustain in a given environment.
SYI-1
Living systems are organized in a hierarchy of structural levels that interact.
If biotic potential exists, then why isn’t every inch of this planet covered with life? Because of the environment in which we live, numerous limiting factors exist that help control population sizes. A few examples of limiting factors include predators, diseases, food supplies, and waste produced by organisms. There are two broad categories of limiting factors:
Density-dependent factors. These limiting factors (Figure 12.6 rear their ugly heads as the population approaches and/or passes the carrying capacity. Examples of density-dependent limiting factors include food supplies, which run low; waste products, which build up; and population-crowding-related diseases such as the bubonic plague, which just stink.
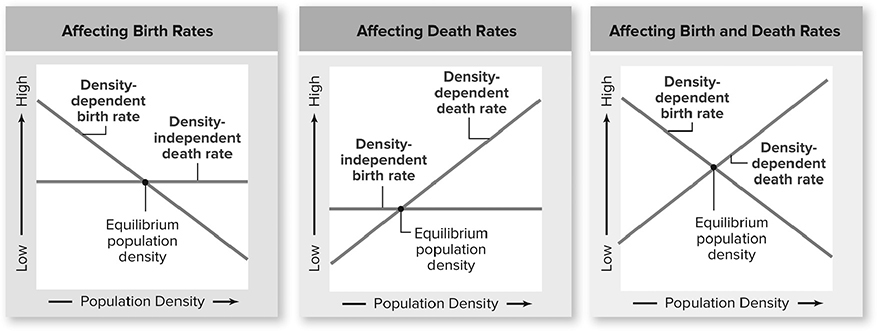
Figure 12.6 Density-dependent population regulation. Density-dependent factors can affect birth rates, death rates, or both. (Reproduced with permission from Raven P, Johnson G, Mason K, Losos J, Duncan T; Biology, 12th ed. New York: McGraw Hill; 2020)
Density-independent factors. These limiting factors have nothing to do with the population size. Examples of density-independent limiting factors include floods, droughts, earthquakes, and other natural disasters and weather conditions.
There are two main types of population growth (Figure 12.8:
1. Exponential growth: the population grows at a rate that creates a J-shaped curve. The population grows as if there are no limitations as to how large it can get (biotic potential).
2. Logistic growth: the population grows at a rate that creates an S-shaped curve similar to the initial portion of Figure 12.7. Limiting factors are the culprits responsible for the S shape of the curve, putting a cap on the size to which the population can grow.
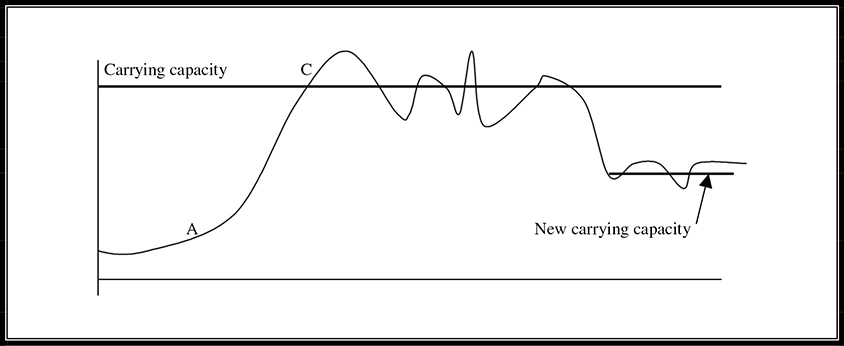
Figure 12.7 Carrying capacity.
Take a look at Figure 12.7. As the population size increases exponentially from point A to point C, there seem to be enough natural resources available to allow the growth rate to be quite high. At some point, however, natural resources, such as food, will start to run out. This will lead to competition between the members of the population for the scarce food. Whenever there is competition, there are winners and losers. Those who win survive; those who lose do not. Notice that the population rises above the carrying capacity. How can this be? This is short-lived, as the complications of being overpopulated (lack of food, disease from increased population density, buildup of waste) will lead to a rise in the death rate that pushes the population back down to the carrying capacity or below. When it drops below the carrying capacity, resources replenish, allowing for an increase in the birth rate and decline in the death rate. What you are looking at in Figure 12.7 is the phenomenon known as a population cycle. Often, as seen in the figure, when the population size dips below the carrying capacity, it will later come back to the capacity and even surpass it. However, another possibility shown in this figure is that when a population dips below the carrying capacity due to some major change in the environment, when all is said and done, it may equilibrate at a new, lower carrying capacity (Figure 12.8.
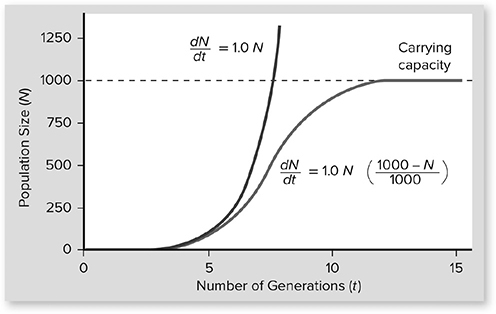
Figure 12.8 Two models of population growth. The red line illustrates the exponential growth model for a population with an r of 1.0. The blue line illustrates the logistic growth model in a population with r = 1.0 and K = 1000 individuals. At first, logistic growth accelerates exponentially; then, as resources become limited, the death rate increases and growth slows. Growth ceases when the death rate equals the birth rate. The carrying capacity (K) ultimately depends on the resources available in the environment. (Reproduced with permission from Raven P, Johnson G, Mason K, Losos J, Duncan T; Biology, 12th ed. New York: McGraw Hill; 2020)
Life History Strategies
You should be familiar with two primary life history “strategies,” which represent two extremes of the spectrum:
K-selected populations: populations of a roughly constant size whose members have low reproductive rates. The offspring produced by these K-selected organisms require extensive postnatal care until they have sufficiently matured. Humans are a fine example of a K-selected population.
R-selected populations: populations that experience rapid growth of the J-curve variety. The offspring produced by R-selected organisms are numerous, mature quite rapidly, and require very little postnatal care. These populations are also known as opportunistic populations and tend to show up when space in the region opens up as a result of some environmental change. The opportunistic population grows fast, reproduces quickly, and dies quickly as well. Bacteria are a good example of an R-selected population.
Survivorship Curves
Survivorship curves (Figure 12.9 are another tool used to study the population dynamics of species. These curves show the relative survival rates for population members of different ages.
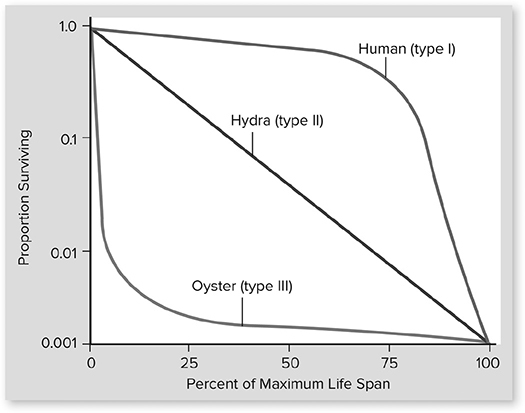
Figure 12.9 Survivorship curves. (Reproduced with permission from Raven P, Johnson G, Mason K, Losos J, Duncan T; Biology, 12th ed. New York: McGraw Hill; 2020)
Type I individuals live a long life until an age is reached where the death rate in the population increases rapidly, causing the steep downward end to the type I curve. Examples of type I organisms include humans and other large mammals.
Type II individuals have a death rate that is reasonably constant across the age spectrum. Examples of type II species include lizards, hydra, and other small mammals.
Type III individuals have a steep downward curve for those of young age, representing a death rate that flattens out once a certain age is reached. Examples of type III organisms include many fishes, oysters, and other marine organisms.
Biological Communities
ENE-4
Communities and ecosystems change on the basis of interactions among populations and disruptions to the environment.
Most species exist within a community. Because they share a geographic home, they are bound to interact with one another. These interactions range from positive to neutral to negative. The communities are characterized by the amount of energy they are able to -produce (primary productivity) and the number of species present in the community.
Ecological Niche
A niche of an organism, which was discussed earlier, represents all the biotic and abiotic resources used by organisms in a given area. However, species sometimes are not able to occupy their entire niche due to the presence or absence of other species. These interactions with other species may have harmful (negative) or helpful (positive) effects on the species. This leads to the presence of fundamental niches, which include all the resources and area that a species can occupy and realized niches, which include the actual resources and space that an organism occupies.
Competition between species for resources in a niche leads to the competitive exclusion principle: when two species compete for limited resources and one of the species uses the resources more efficiently than the other, it will lead to the elimination of the less efficient species. Figure 12.10 shows competition between two species of barnacles.
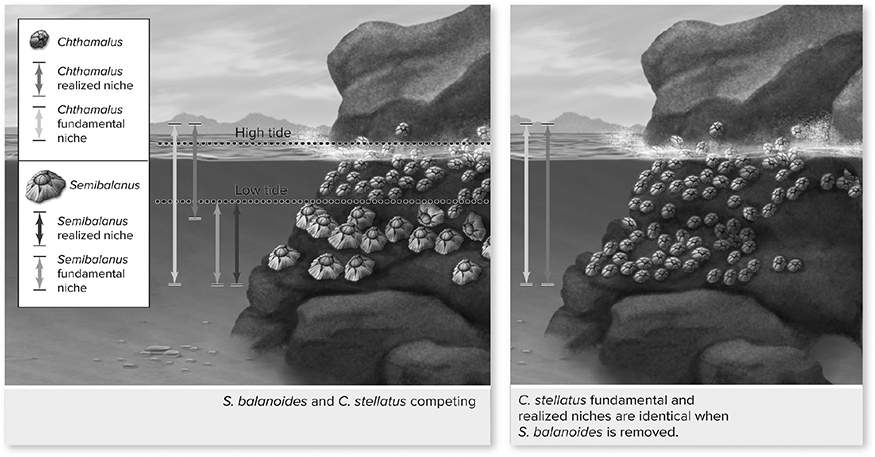
Figure 12.10 Competition between two species of barnacles. (Reproduced with permission from Raven P, Johnson G, Mason K, Losos J, Duncan T; Biology, 12th ed. New York: McGraw Hill; 2020)
Forms of Species Interaction
1. Symbiosis. A symbiotic relationship is one between two different species that can be classified as one of three main types: commensalism, mutualism, or parasitism.
SYI-3
Naturally occurring diversity among and between components within biological systems affects interactions with the environment.
A. Commensalism. One organism benefits while the other is unaffected. Commen-salistic relationships are rare, and examples are hard to find. Cattle egrets feast on insects that are aroused into flight by cattle grazing in the insects’ habitat. The birds benefit because they get food, but the cattle do not appear to benefit at all.
B. Mutualism. Both organisms reap benefits from the interaction. One popular example of a mutualistic relationship is that between acacia trees and ants. The ants are able to feast on the yummy sugar produced by the trees, while the trees are protected by the ants’ attack on any potentially harmful foreign insects. Another example involves a lichen, which is a collection of photosynthetic organisms (fungus and algae) living as one. The fungus component pulls its weight by helping to create an environment suitable for the lichen’s survival, while the algae component supplies the food for the fungus. Without each other’s contribution, they are doomed.
C. Parasitism. One organism benefits at the other’s expense. A popular example of a parasitic relationship involves tapeworms, which live in the digestive tract of their hosts. They reap the benefits of the meals that their host consumes by stealing the nutrients and depriving the host of nutrition. Another less well-known example of parasitism involves myself and my younger brother’s Playstation 2 console.
2. Competition. Both species are harmed by this kind of interaction. The two major forms of competition are intraspecific and interspecific competition. Intraspecific competition is within-species competition. This kind of competition occurs because members of the same species rely on the same valuable resources for survival. When resources become scarce, the most fit of the species will get more of the resource and survive. Interspecific competition is competition between different species.
3. Predation. (Figure 12.11 is one of the “negative” interactions seen in communities (well, for one half of those involved, it is negative). One species, the predator, hunts another species, the prey.
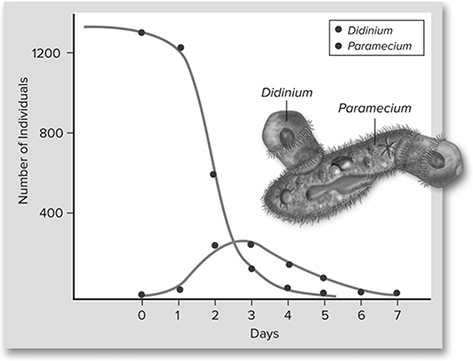
Figure 12.11 Predator—prey in the microscopic world. When the predatory Didinium is added to a Paramecium population, the numbers of Didinium initially rise, and the numbers of Paramecium steadily fall. When the Paramecium population is depleted, however, the Didinium individuals also die. (Reproduced with permission from Raven P, Johnson G, Mason K, Losos J, Duncan T; Biology, 12th ed. New York: McGraw Hill; 2020)
Not all prey give in to this without a fight, and the hunted may develop mechanisms to defend against predatory attack. The next section describes the various kinds of defense mechanisms developed by prey in an effort to survive.
Keystone species are critical to the survival of other species in a given ecosystem. These keystone species may be predators or something as simple as a plant. But do not make the mistake of discounting their importance to the survival of the ecosystem. Without them, the ecosystem would be dramatically different.
Defense Mechanisms
Aposematic coloration is a very impressive-sounding name for this defense mechanism. Stated simply, it is warning coloration adopted by animals that possess a chemical defense mechanism. Predators have grown cautious of animals with bright color patterns due to past encounters in which prey of a certain coloration have sprayed the predator with a chemical defense. It is kind of like the blinking red light seen in cars with elaborate alarm systems. Burglars notice the red light and may think twice about attempting to steal that car because of the potential for encountering an alarm system.
In Batesian mimicry, an animal that is harmless copies the appearance of an animal that is dangerous to trick predators. An example of this is a beetle whose colors closely resemble those of bees. Predators may fear that the beetle is a bee and avoid confrontation.
In cryptic coloration, those being hunted adopt a coloring scheme that allows them to blend in to the colors of the environment. It is like camouflage worn by army soldiers moving through the jungle. The more you look like the terrain, the harder you are to see.
Some animals have patterns called deceptive markings, which can cause a predator to think twice before attacking. For example, some insects may have colored designs on their wings that resemble large eyes, causing individuals to look more imposing than they truly are.
In Müllerian mimicry, two species that are aposematically colored as an indicator of their chemical defense mechanisms mimic each other’s color scheme in an effort to increase the speed with which their predators learn to avoid them. The more often predators see dangerous prey with this coloration, the faster the negative association is made.
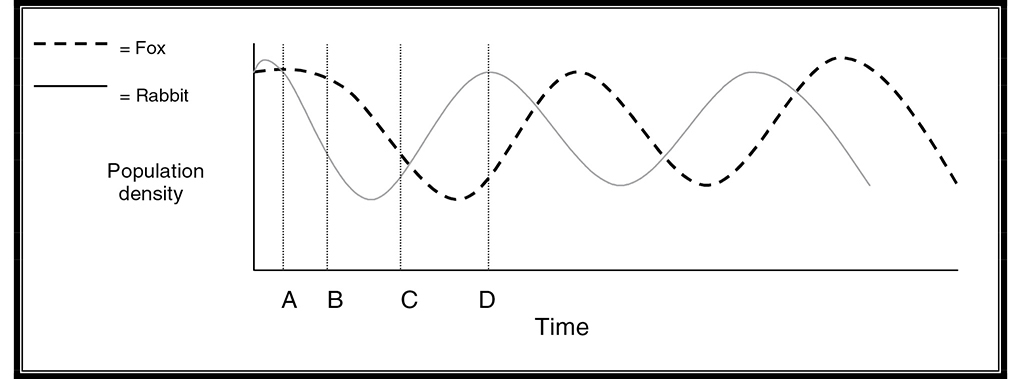
Looking at Figure 12.12, we can see how the predator—prey dance plays out. When the prey population starts to decrease because of predation, there is a reactionary reduction in the predator population. Why does this happen? Because the predators run low on a valuable resource necessary to their survival—their prey. Notice in the figure that as the predator population declines, an increase in the population of the prey begins to appear because more of those prey animals are able to survive and reproduce. As the prey population density rises, the predators again have enough food available to sustain a higher population, and their population density returns to a higher level again. Unless disturbed by a dramatic environmental change, this cyclical pattern continues.
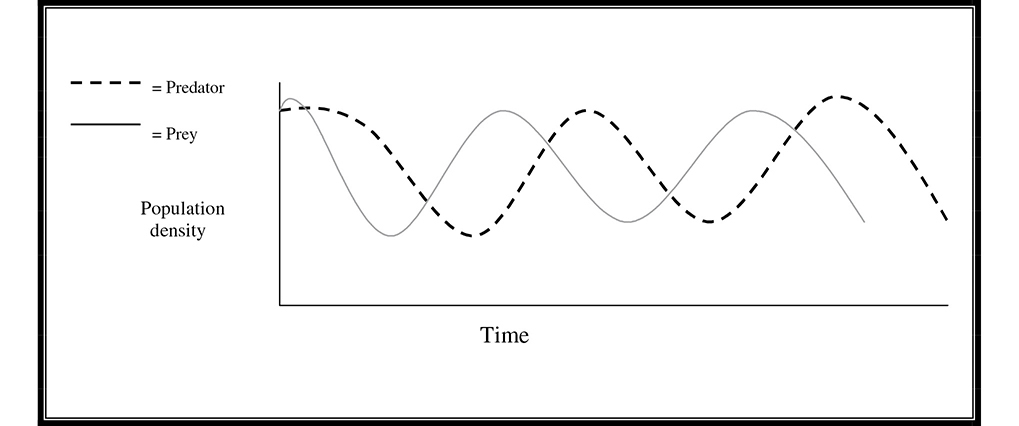
Figure 12.12 Predator—prey population curves.
Coevolution is mutual evolution between two species and is often seen in predator—prey relationships. For example, imagine that the hunted prey adapts a new character trait that allows it to better elude the predator. In order to survive, the predator must evolve so that it can catch its victim and eat.
Succession
When something happens to a community that causes a shift in the resources available to the local organisms, it sets the stage for the process of succession—the shift in the local composition of species in response to changes that occur over time. As time passes, the community goes through various stages until it arrives at a final stable stage called the climax community. Two major forms of succession you should know about are primary and secondary succession.
Primary succession occurs in an area that is devoid of life and contains no soil. A pioneer species (usually a small plant) able to survive in resource-poor conditions takes hold of a barren area such as a new volcanic island. The pioneer species does the grunt work, adding nutrients and other improvements to the once uninhabited volcanic rock until future species take over. As the plant species come and go, adding nutrients to the environment, animal species are drawn in by the presence of new plant life. These animals contribute to the development of the area with the addition of further organic matter (waste). This constant changing of the guard continues until the climax community is reached and a steady-state equilibrium is achieved. Bare-rock succession involves the attachment of lichen to rocks, followed by the step-by-step arrival of replacement species up to the climax community. Pond succession is kicked off when a shallow, water-filled hole is created. As time passes, animals arrive on the scene as the pioneer species deposit debris, encouraging the growth of vegetation on the pond floor. Over time, plants develop whose roots are underwater and whose leaves are above the water. As these plants begin to cover the entire area of the pond, the debris continues to build up, transforming the once empty pond into a marsh. When enough trees fill the area, the marsh becomes a swamp. If the conditions are appropriate, the swamp can eventually become a forest or grassland, completing the succession process. One trivia fact to take out of primary succession is that usually the pioneer species is an R-selected species, while the later species tend to be K-selected species.
Secondary succession occurs in an area that once had stable life but has since been disturbed by some major force such as a forest fire. This type of succession is different from primary succession because there is already soil present on the terrain when the process begins.
Keystone species are critical to the survival of other species in a given ecosystem. These keystone species may be predators or something as simple as a plant. But do not make the mistake of discounting their importance to the survival of the ecosystem. Without them, the ecosystem would be dramatically different.
Trophic Levels
As we discussed earlier, an ecosystem consists of the individuals of the community and the environment in which they exist. Organisms are classified as either producers or consumers. The producers of the world are the autotrophs mentioned in Chapter 7 Cellular Energetics. The autotrophs you should recognize can be one of two types: photosynthetic or chemo-synthetic autotrophs. Photoautotrophs (photosynthetic autotrophs) start the Earth’s food chain by converting the energy of light into the energy of life. Chemoautotrophs (chemosynthetic autotrophs) release energy through the movement of electrons in oxidation reactions.
ENE-1
The highly complex organization of living systems requires constant input of energy and the exchange of macromolecules.
The consumers of the world are the heterotrophs. They are able to obtain their energy only through consumption of other living things (Figure 12.13. One type of consumer is an herbivore, which feeds on plants for nourishment. Another consumer, the carnivore, obtains energy and nutrients through the consumption of other animals. A third consumer, the detritivore, obtains its energy through the consumption of dead animals and plants. A special subcategory of this type of consumer includes decomposers, which also consume dead animal and plant matter, but then release nutrients back into the environment. The decomposer subcategory includes fungi, bacteria, and earthworms.
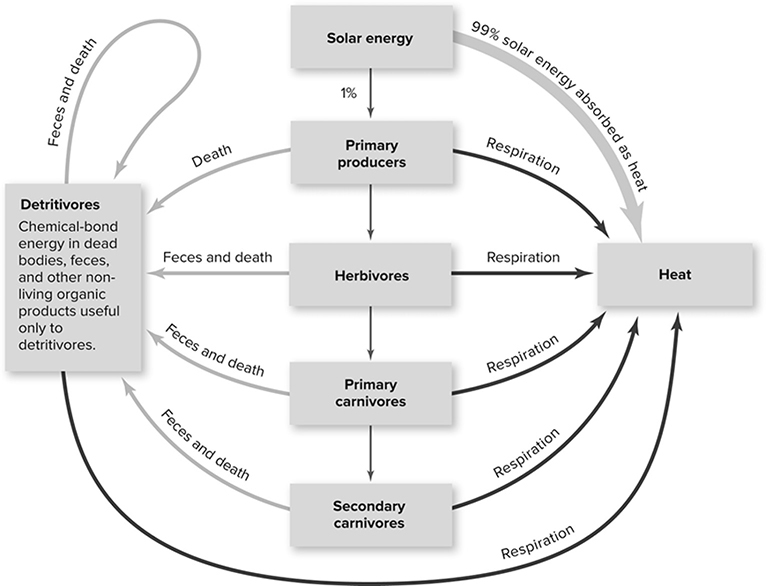
Figure 12.13 The flow of energy through an ecosystem. Blue arrows represent the flow of energy that enters the ecosystem as light and is then passed along as chemical-bond energy to successive trophic levels. At each step energy is diverted, meaning that the chemical-bond energy available to each trophic level is less than that available to the preceding trophic level. Red arrows represent diversions of energy into heat. Tan arrows represent diversions of energy into feces and other organic materials useful only to the detritivores. Detritivores may be eaten by carnivores, so some of the chemical-bond energy returns to higher trophic levels. (Reproduced with permission from Raven P, Johnson G, Mason K, Losos J, Duncan T; Biology, 12th ed. New York: McGraw Hill; 2020)
Here comes another hierarchy for you to remember. The distribution of energy on the planet can be subdivided into a hierarchy of energy levels called trophic levels. Take a look at the energy pyramid in Figure 12.14. The primary producers make up the first trophic level. The next trophic level consists of the organisms that consume the primary producers: the herbivores. These organisms are known as primary consumers. The primary consumers are consumed by the secondary consumers, or primary carnivores, that are the next trophic level. These primary carnivores are consumed by the secondary carnivores to create the next trophic level. This is an oversimplified yet important basic explanation of how trophic levels work. Usually there are only four or five trophic levels to a food chain because energy is lost from each level as it progresses higher.
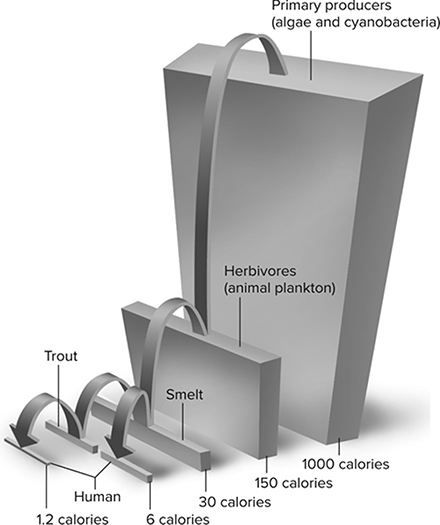
Figure 12.14 Energy pyramid, indicating decrease in energy level. (Reproduced with permission from Raven P, Johnson G, Mason K, Losos J, Duncan T; Biology, 12th ed. New York: McGraw Hill; 2020)
The energy pyramid is not the only type of ecological pyramid that you might encounter on the AP Biology exam. Be familiar with a type of pyramid known as a biomass pyramid (Figure 12.15, which represents the cumulative weight of all of the members at a given trophic level. These pyramids tend to vary from one ecosystem to another. Like energy pyramids, the base of the biomass pyramid represents the primary producers and tends to be the largest.
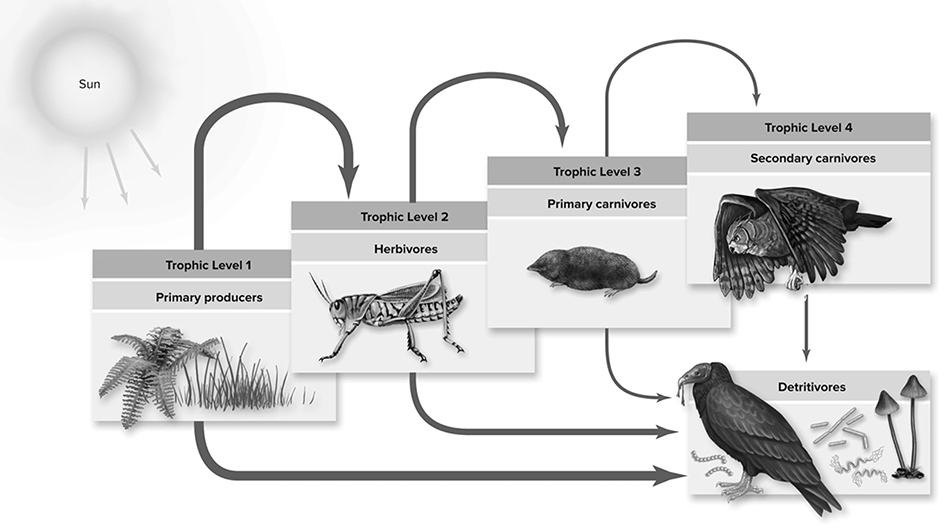
Figure 12.15 Biomass pyramid. (Reproduced with permission from Raven P, Johnson G, Mason K, Losos J, Duncan T; Biology, 12th ed. New York: McGraw Hill; 2020)
There is also the pyramid of numbers, which is based on the number of individuals at each level of the biomass chain. Each box in this pyramid represents the number of members of that level. The highest consumers in the chain tend to be quite large, resulting in a smaller number of those individuals spread out over an area.
Two more terms to cover before moving on to the biomes are food chains and food webs. A food chain is a hierarchical list of who snacks on who. For example, bugs are eaten by spiders, who are eaten by birds, who are eaten by cats. A food web provides more information than a food chain—it is not so cut and dry. Food webs recognize that, for example, bugs are eaten by more than only spiders. Food webs can be regarded as overlapping food chains that show all the various dietary relationships.
Biomes
The various geographic regions of the Earth that serve as hosts for ecosystems are known as biomes. Read through the following list so that you will be able to sprinkle some biome knowledge into an essay on ecological principles.
1. Deserts. The driest land biome of the group, deserts experience a wide range of temperature from day to night and exist on nearly every continent. Deserts that do not receive adequate rainfall will not have any vegetative life. However, plants such as cacti seem to have adjusted to desert life and have done quite nicely in this biome, given enough water. Much of the wildlife found in deserts is nocturnal and conserves energy and water during the heat of the day. This biome shows the greatest daily fluctuation in temperature due to the fact that water moderates temperature.
2. Savanna. Savanna grasslands, which contain a spattering of trees, are found throughout South America, Australia, and Africa. Savanna soil tends to be low in nutrients, while temperatures tend to run high. Many of the grazing species of this planet (herbivores) make savannas their home.
3. Taiga. This biome, characterized by lengthy cold and wet winters, is found in Canada and has gymnosperms as its prominent plant life. Taigas contain coniferous forests (pine and other needle-bearing trees).
4. Temperate deciduous forests. A biome that is found in regions that experience cold winters where plant life is dormant, alternating with warm summers that provide enough moisture to keep large trees alive. Temperate deciduous forests can be seen in the northeastern United States, much of Europe, and eastern Asia.
5. Temperate grasslands. Temperate grasslands are found in regions with cold winters. The soil of this biome is considered to be among the most fertile of all. This biome receives less water than tropical savannas.
6. Tropical forests. Found all over the planet in South America, Africa, Australia, and Asia, tropical forests come in many shapes and sizes. Near the equator, they can be rainforests, whereas in lowland areas that have dry seasons, they tend to be dry forests. Rainforests consist primarily of tall trees that form a thick cover, which blocks the light from reaching the floor of the forest (where there is little growth). Tropical rainforests are known for their rapid recycling of nutrients and contain the greatest diversity of species.
7. Tundras. The tundra biome experiences extremely cold winters during which the ground freezes completely. The upper layer of the ground is able to thaw during the summer months, but the land directly underneath, called the permafrost, remains frozen throughout the year. This keeps plants from forming deep roots in this soil and dictates what type of plant life can survive. The plant life that tends to predominate is short shrubs or grasses that are able to withstand difficult conditions.
8. Water biomes. Both freshwater and marine water biomes occupy the majority of the surface of the Earth.
The general distribution of biomes on the Earth’s surface is shown in Figure 12.16.
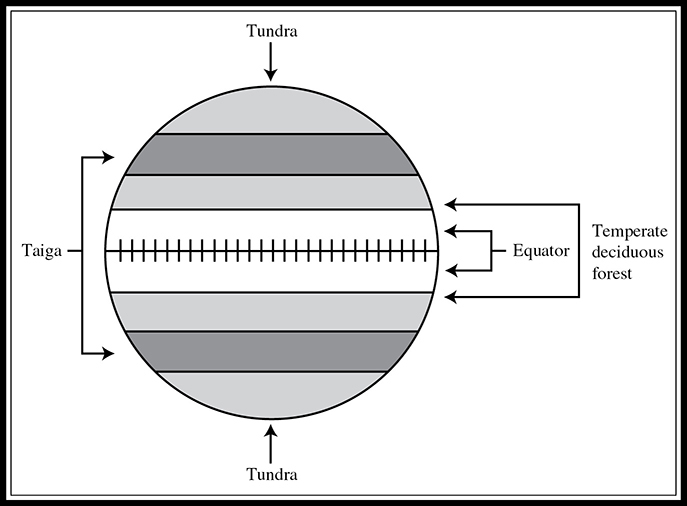
Figure 12.16 General distribution of biomes on the Earth’s surface. (The other land biomes such as grassland and desert are interspersed in temperate and tropical regions with water as the limiting factor.)
Biogeochemical Cycles
One last topic to briefly cover before we wave good-bye to ecology is that of biogeochemical cycles. These cycles represent the movement of elements, such as nitrogen and carbon, from organisms to the environment and back in a continuous cycle. Do not attempt to become a master of these cycles, but you should understand the basics.
Carbon cycle. Carbon is the building block of organic life. The carbon cycle begins when carbon is released to the atmosphere from volcanoes, aerobic respiration (CO2), and the burning of fossil fuels (coal). Most of the carbon in the atmosphere is present in the form of CO2. Plants contribute to the carbon cycle by taking in carbon and using it to perform photosynthetic reactions, and then incorporating it into their sugars. The carbon is ingested by animals, who send the carbon back to the atmosphere when they die.
Nitrogen cycle. Nitrogen is an element vital to plant growth. In the nitrogen cycle (Figure 12.17, plants have nitrogen to consume thanks to the existence of organisms that perform the thankless task of nitrogen fixation—the conversion of N2 to NH3 (ammonia). The only source of nitrogen for animals is the plants they consume. When these organisms die, their remains become a source of nitrogen for the remaining members of the environment. Bacteria and fungi (decomposers) chomp at these organisms and break down any nitrogen remains. The NH3 in the environment is converted by bacteria into NO3 (nitrate), and this NO3 is taken up by plants and then eventually by animals to complete the nitrogen cycle. Denitrification is the process by which bacteria themselves use nitrates and release N2 as a product.
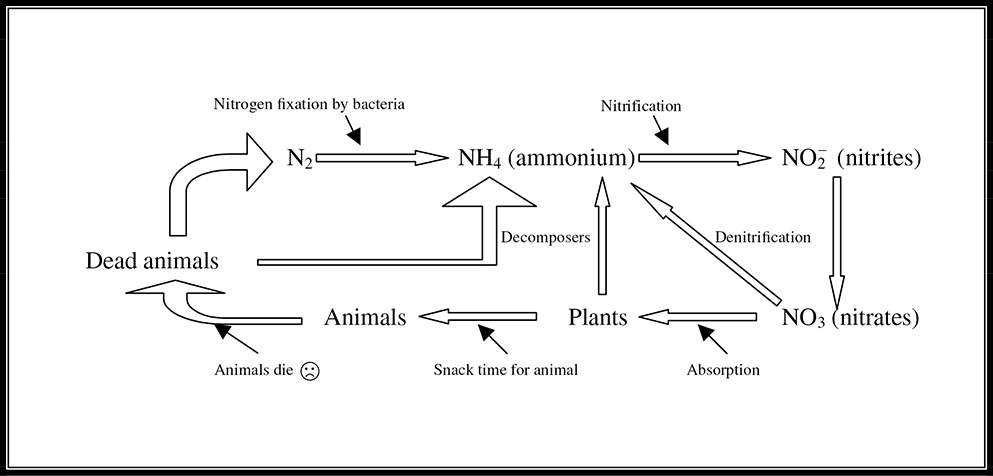
Figure 12.17 The nitrogen cycle.
Water cycle. The Earth is covered in water. A considerable amount of this water evaporates each day and returns to the clouds. Eventually, this water is returned to the earth in the form of precipitation. This process is termed the water cycle.
Disruptions to Ecosystem
In all ecosystems, competition and cooperation play important roles in the diversity and survival of the ecosystem. Changes to these interactions (genetic makeup change, abiotic factor change, human-caused change) could eventually lead to the evolution of the ecosystem.
EVO-1
Evolution is characterized by change in the genetic makeup of a population over time and is supported by multiple lines of evidence.
An invasive species is an organism that is introduced to an area that is not native to the particular area and that leads to environmental harm to the area. While not all non-native species are invasive, invasive species are often able to outcompete native species for abiotic and biotic resources, leading to uncontrolled population growth and changes in the ecosystem. Invasive species can be introduced in many different ways, including accidently or intentionally. Either way, they negatively impact the native ecosystem.
SYI-2
Competition and cooperation are important aspects of biological systems.
Local and global ecosystems naturally change over time. Humans accelerate the change in many ways. These include introduction of invasive species, overpopulation, deforestation, pollution, and burning fossil fuels. These negative human impacts have caused climate change, soil erosion, and reduced air and water quality, leading to local and global ecosystem changes (Figure 12.18.
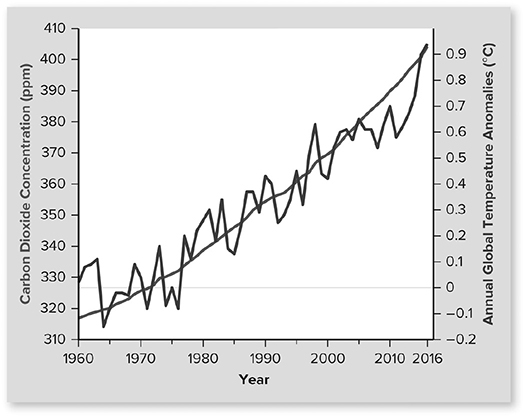
Figure 12.18 The greenhouse effect. The concentration of carbon dioxide in the atmosphere has increased steadily since the 1950s, as shown by the blue line. The red line shows the change in average global temperatures for the same period. The temperatures are recorded as anomalies relative to the mean temperature during a reference period (1951—1980). CO2 concentration is measured as parts per million; that is, the number of CO2 molecules compared to other molecules of gas in the atmosphere. (Reproduced with permission from Raven P, Johnson G, Mason K, Losos J, Duncan T; Biology, 12th ed. New York: McGraw Hill; 2020)
![]() Review Questions
Review Questions
1. When horses hear an unusual noise, they turn their ears toward the sound. This is an example of
A. a fixed-action pattern.
B. habituation.
C. associative learning.
D. imprinting.
2. Why do animal behaviorists have to account for a habituation period when undertaking an observational study?
A. They have to make sure that the study animals do not imprint on them.
B. They have to wait until their presence no longer affects the behavior of the animals.
C. The animals need a period of time to learn to associate the observer with data collection.
D. Before insight learning can be observed, the animals must practice.
3. Which of the following is an example of an agonistic behavior?
A. A subordinate chimpanzee grooms a dominant chimpanzee.
B. Two lionesses share a fresh kill.
C. A female wolf regurgitates food for her nieces and nephews.
D. A blackbird approaches and takes the feeding position of another blackbird, causing it to fly away.
4. In which of the following dyads do we expect not to see any altruistic behavior?
A. Two sisters who are allies
B. Two half-brothers
C. Two individuals migrating in opposite directions
D. Two group members who have frequent conflicts and reconciliations
5. Which of the following is not a requirement for reciprocal altruism to occur?
A. Ability to recognize the other individual
B. Long lifespan
C. Opportunity for multiple interactions
D. High coefficient of relatedness
6. A female tamarin monkey licks her wrists, rubs them together, and then rubs them against a nearby tree. What kind of communication is this probably an example of?
A. Chemical
B. Visual
C. Auditory
D. Territorial
For questions 7—10, please use the following answers:
A. Habituation
B. Imprinting
C. Associative learning
D. Operant conditioning
7. This type of learning is the lack of responsiveness to unimportant stimuli that do not provide appropriate feedback.
8. Trial-and-error learning important to animals displaying aposometric coloration.
9. Process by which animals associate one stimulus with another.
10. Innate behavior that is learned during a critical period in life.
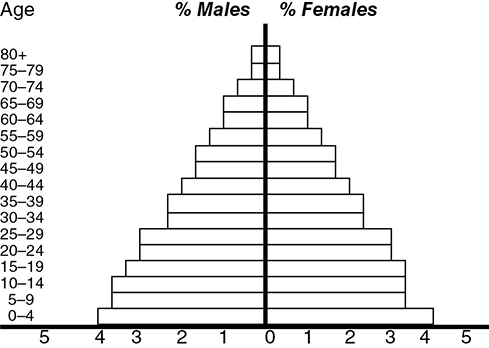
11. How would you describe the population depicted in the age structure graph shown here?
A. Growing rapidly
B. Growing slowly
C. Not growing at all
D. Experiencing slow negative growth
12. Carbon is most commonly present in the atmosphere in what form?
A. CCl4
B. CO
C. CO2
D. CH2
13. Which of the following is a density-dependent limiting factor?
A. Flood
B. Drought
C. Earthquake
D. Famine
14. The process by which bacteria themselves use the nitrate of the environment, releasing N2 as a product, is called
A. nitrogen fixation.
B. abiotic fixation.
C. denitrification.
D. chemosynthetic autotrophism.
For question 15, please use the curve below:
15. At what point on the graph does the decline in rabbit population act as a limiting factor to the survival of the foxes, leading to a decline in their population size?
A. A
B. B
C. C
D. D
16. A collection of all the individuals of an area combined with the environment in which they exist is called a/an
A. population.
B. community.
C. ecosystem.
D. biosphere.
For questions 17—20, please use the following answer choices:
A. Aposematic coloration
B. Batesian mimicry
C. Müllerian mimicry
D. Cryptic coloration
17. A beetle that has the coloration of a yellow jacket is displaying which defense mechanism?
18. A moth whose body color matches that of the trees in which it lives is displaying which defense mechanism?
19. Two different lizard species, each possessing a particular chemical defense mechanism and sharing a similar body coloration, are displaying which defense mechanism?
20. A lizard with a chemical defense mechanism has a bright-colored body as a warning to predators that it is one tough customer is displaying which defense mechanism?
21. Which of the following is not a characteristic of a K-selected population?
A. Populations tend to be of a relatively constant size.
B. Offspring produced tend to require extensive postnatal care.
C. Primates are classified as K-selected organisms.
D. Offspring are produced in large quantities.
22. Which of the following would have the survivorship curve shown in the following diagram?
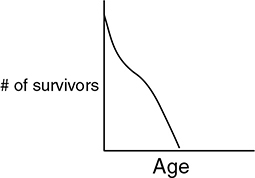
A. Humans
B. Lizards
C. Oysters
D. Fish
For questions 23—26, please use the following answer choices:
A. Desert
B. Taiga
C. Tundra
D. Tropical rain forest
23. This biome is known for having the most diverse variety of species.
24. This biome is the driest of the land biomes.
25. The predominate plant life of this biome is short shrubs or grasses.
26. This biome is known for its cold, lengthy, and snowy winters and the presence of coniferous forests.
![]() Answers and Explanations
Answers and Explanations
1. A—This is a fixed-action pattern—an innate behavior that is a programmed response to a stimulus that appears to be carried out without any thought by the organisms involved.
2. B—If the scientist does not allow for a period of habituation, the behavioral observations will be inaccurate since the behavior of the animal will be altered by the presence of the scientist.
3. D—An agonistic behavior is a contest of intimidation and submission where the prize is a desired resource. In this case, the resource is the feeding position.
4. C—Altruistic behavior cannot be expected from two migrating individuals for a couple of reasons: (1) there is no reason for either of them to believe that they will see the other in the future, taking the “If I help them now, perhaps they will help me sometime in the future” element out of play; and (2) if they are migrating in different directions, it is reasonably likely that they are probably not related, which takes the “I’ll help because it’ll increase the chance that more of my genes get passed along” element out of play.
5. D—Reciprocal altruism need not occur between related individuals.
6. A
7. A
8. D
9. C
10. B
11. A—The population shown in this age structure chart is one that is growing rapidly because of the gradual increase in percentage of the population as the age approaches 0. This shows a population that has a high birth rate and a reasonable life expectancy.
12. C—CO2 is the dominant form of carbon present in the atmosphere.
13. D—Density-dependent limiting factors show up as the population approaches and/or passes the carrying capacity. Examples of density-dependent limiting factors include availability of food resources, waste buildup, and density-induced diseases. The other three choices are examples of density-independent factors, which affect population size regardless of how large or small it may be.
14. C—Denitrification is defined as the process by which bacteria themselves use nitrates and release nitrogen gas as a product. Bacteria also perform the necessary task of nitrogen fixation, which takes atmospheric nitrogen and converts it to NH3. They later take this NH3 and convert it to nitrate, which plants require for photosynthetic success. (Abiotic fixation is a term that we made up because it sounded cool.) Chemiosynthetic autotrophs are the producers of the planet that produce energy through the movement of electrons in oxidation reactions.
15. B—At this point, the population of rabbits has declined to the point where the foxes are starting to feel the reduction in their food supply. The fox survival curve soon begins its decline, which leads to the revival of the rabbits.
16. C—An ecosystem consists of all the individuals in the community and the environment in which they exist. A population is a collection of individuals of the same species living in the same area. A community is a collection of all the different populations of the various species in a geographic area. A biosphere is the collection of all the life-containing areas of the planet.
17. B—An animal that is harmless copies the appearance of an animal that is dangerous as a defense mechanism to make predators think twice about attacking.
18. D—Cryptic coloration is the animal kingdom’s version of army clothes. Their coloration matches that of their environment so they can blend in and hide from their predators.
19. C—Two species that are aposematically colored as an indicator of their chemical defense mechanism mimic each other’s color scheme in an effort to increase the speed with which their predators learn to avoid them. This, of course, requires a predator that can learn based on experience.
20. A—This defense mechanism is warning coloration adopted by animals that possess a chemical defense mechanism. Ideally, predators will learn to avoid the species, helping the prey survive longer.
21. D—K-selected populations tend to be populations of a roughly constant size, with low reproductive rates and whose offspring require extensive postnatal care until they have sufficiently matured. R-selected populations tend to produce many offspring per birth.
22. B—Lizards follow a type II survivorship curve as illustrated in the diagram in review question 12. Humans (answer A) follow a type I curve, while oysters and fish (answers C and D) follow a type III survivorship curve.
23. D
24. A
25. C
26. B
![]() Rapid Review
Rapid Review
Quickly review the following terms:
Behavioral ecology: study of interaction between animals and their environments.
Ethology: study of animal behavior.
Types of Animal Learning
✵ Fixed-action pattern: preprogrammed response to a stimulus (stickleback fish).
✵ Habituation: loss of responsiveness to unimportant stimuli or stimuli that provide no feedback.
✵ Imprinting: innate behavior learned during critical period early in life (baby ducks imprint to mama ducks).
✵ Associative learning: one stimulus is associated with another (classical conditioning—Pavlov).
✵ Operant conditioning: trial-and-error learning (aposometric predator training).
✵ Insight learning: ability to reason through a problem the first time through with no prior experience.
✵ Observational learning: learning by watching someone else do it first.
Types of Animal Movement
✵ Kinesis: change in the speed of movement in response to a stimulus. Organisms will move faster in bad environments and slower in good environments.
✵ Migration: cyclic movement of animals over long distances according to the time of year.
✵ Taxis: reflex movement toward or away from a stimulus.
Animal Behaviors
✵ Agonistic behavior: conflict behavior over access to a resource. Often a matter of which animal can mount the most threatening display and scare the other into submission.
✵ Dominance hierarchies: ranking of power among the members of a group; subject to change. Since members of the group know the order, less energy is wasted in conflicts over food and resources.
✵ Territoriality: defense of territory to keep others out.
✵ Altruistic behavior: action in which an organism helps another at its own expense.
✵ Reciprocal altruism: animals behave altruistically toward others who are not relatives, hoping that the favor will be returned sometime in the future.
✵ Foraging: feeding behavior of an individual. Animals have a search image that directs them to food.
✵ Optimal foraging: natural selection favors those who choose foraging strategies that maximize the differential between costs and benefits. If the effort involved in obtaining food outweighs the nutritive value of the food, forget about it.
✵ Inclusive fitness: the ability of individuals to pass their genes not only through the production of their own offspring, but also by providing aid to enable closely related individuals to produce offspring.
✵ Coefficient of relatedness: statistic that represents the average proportion of genes two individuals have in common. The higher the value, the more likely they are to altruistically aid one another.
Communication
✵ Chemical: communication through the use of chemical signals, such as pheromones.
✵ Visual: communication through the use of visual cues, such as the tail feather displays of peacocks.
✵ Auditory: communication through the use of sound, such as the chirping of frogs in the summer.
✵ Tactile: communication through the use of touch, such as a handshake in humans.
The following terms are important in this chapter:
Population: collection of individuals of the same species living in the same geographic area.
Community: collection of populations of species in a geographic area.
Ecosystem: community + environment.
Biosphere: communities + ecosystems of planet.
Biotic components: living organisms of ecosystem.
Abiotic components: nonliving players in ecosystem.
Dispersion patterns: clumped dispersion (animals live in packs spaced from each other—cattle), uniform distribution (species are evenly spaced out across an area, e.g., birds on a wire), random distribution (species are randomly distributed across an area, e.g., trees in a forest).
Biotic potential: maximum growth rate for a population.
Carrying capacity: maximum number of individuals that a population can sustain in a given environment.
Limiting factors: factors that keep population size in check: density-dependent (food, waste, disease), density-independent (weather, natural disasters).
Population growth: exponential growth (J-shaped curve, unlimited growth), logistic growth (S-shaped curve, limited growth).
Life history strategies: K-selected populations (constant size, low reproductive rate, extensive postnatal care—humans); R-selected populations (rapid growth, J-curve style, little postnatal care, reproduce quickly, die quickly—bacteria).
Survivorship curves: show survival rates for different-aged members of a population:
✵ Type I: live long life, until age is reached where death rate increases rapidly—humans, large mammals.
✵ Type II: constant death rate across the age spectrum—lizards, hydra, small mammals.
✵ Type III: steep downward death rate for young individuals that flattens out at certain age—fish, oysters.
Forms of Species Interaction
✵ Parasitism: one organism benefits at another’s expense (tapeworms and humans).
✵ Commensalism: one organism benefits while the other is unaffected (cattle egrets and cattle).
✵ Mutualism: both organisms reap benefits from the interaction (acacia trees and ants, lichen).
✵ Competition: both species are harmed by the interaction (intraspecific vs. interspecific).
✵ Predation: one species, the predator, hunts the other, the prey.
Defense Mechanisms
✵ Cryptic coloration: coloring scheme that allows organism to blend into colors of environment.
✵ Deceptive markings: patterns that cause an animal to appear larger or more dangerous than it really is.
✵ Aposematic coloration: warning coloration adopted by animals that possess a chemical defense mechanism.
✵ Batesian mimicry: animal that is harmless copies the appearance of an animal that is dangerous.
✵ Müllerian mimicry: two aposemetrically colored species have a similar coloration pattern.
Primary succession: occurs in area devoid of life that contains no soil; pioneer species come in, add nutrients, and are replaced by future species, which attract animals to the area, thus adding more nutrients; constant changing of guards until the climax community is reached and a steady-state equilibrium is achieved.
Secondary succession: occurs in area that once had stable life but was disturbed by major force (fire).
Biomes: The Special Facts
We recommend that you read the biome material in the chapter for more detail.
✵ Desert: driest land biome.
✵ Taiga: lengthy cold, wet winters; lots of conifers.
✵ Temperate grasslands: most fertile soil of all.
✵ Tundra: permafrost, cold winters, short shrubs.
✵ Savanna: grasslands, home to herbivores.
✵ Deciduous forest: cold winters/warm summers.
✵ Tropical forest: greatest diversity of species.
✵ Water biomes: freshwater and marine biomes of Earth.
Trophic levels: hierarchy of energy levels on a planet; energy level decreases from bottom to top; primary producers (bottom) → primary consumers (herbivores) → secondary consumers → tertiary consumers → decomposers.