Biology Premium, 2024: 5 Practice Tests + Comprehensive Review + Online Practice - Wuerth M. 2023
Appendix
Frequently Used Formulas and Equations
Statistics
The proper use of statistics is important in biology. Here are some of the terms and formulas you should be familiar with for the AP Biology exam.
Mode, median, and mean are used to describe the central tendency of a data set.
Mode—the most frequently used value in a data set
Median—the middle value of a data set
Mean—the average of a data set; to find the mean, add all of the data points in a data set, and then divide by the number of members in the data set
Here is another way to define the mean:

n = the number of members in the data set
Range, standard deviation, and standard error of the mean are used to describe the spread of a data set.
Range—the highest value of the data set minus the lowest value of the data set
Standard Deviation*
![]()
Standard Error of the Mean*
![]()
To construct a 95% confidence interval, start at the mean of the data set. Add two times the standard error of the mean to find the upper limit of the 95% confidence interval. To find the lower limit of the 95% confidence interval, start at the mean of the data set, and then subtract two times the standard error of the mean.
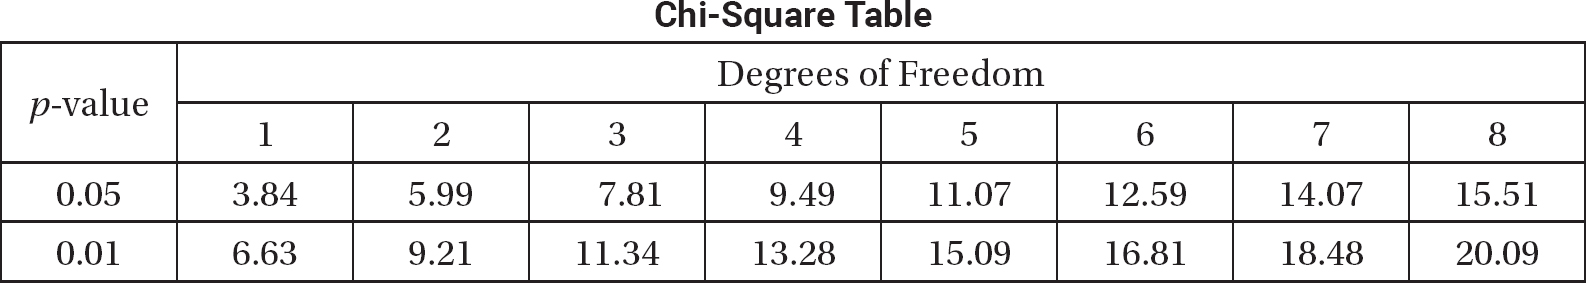
Chi-Square
The chi-square formula is appropriate for evaluating a null hypothesis about a data set that involves counts (for example, whether or not the observed numbers of cells in different phases of the cell cycle are significantly different from the expected numbers). The formula for chi-square is:
![]()
Once the chi-square value for a data set is calculated, it is compared to the critical value found in the chi-square table. Find the critical value at the intersection of the degrees of freedom (df) and the p-value.
Genetics Problems and Laws of Probability
When working through genetics problems, it is useful to understand the basic laws of probability.
If the results of one event do not affect the results of a second event (independent events), the probability of both events happening equals the product of their individual probabilities:
![]()
For example, if the probability of a tall plant is ![]() and the probability of the plant having purple flowers is
and the probability of the plant having purple flowers is ![]() (and the gene that determines tallness has no effect—is independent of—the gene that determines flower color), the probability of the plant being tall AND having purple flowers is
(and the gene that determines tallness has no effect—is independent of—the gene that determines flower color), the probability of the plant being tall AND having purple flowers is ![]() .
.
If the results of one event do affect the probability of a second event happening (mutually exclusive events), the probability of both events happening equals the sum of their individual probabilities:
![]()
For example, in a heterozygous cross, the probability of a homozygous recessive offspring is ![]() and the probability of a heterozygous offspring is
and the probability of a heterozygous offspring is ![]() , so the probability of an offspring being either homozygous recessive OR heterozygous is
, so the probability of an offspring being either homozygous recessive OR heterozygous is ![]() .
.
Hardy-Weinberg Equations
Use this equation when finding allele frequencies:
![]()
p is the frequency of the dominant allele.
q is the frequency of the recessive allele in the gene pool.
Use this equation when looking for genotype frequencies:
![]()
p2 is the frequency of the homozygous dominant genotype.
2pq is the frequency of the heterozygous genotype.
q2 is the frequency of the homozygous recessive genotype.
Water Equations
The total water potential is the sum of the pressure potential and the solute potential:
![]()
In open containers in equilibrium with their environment:
![]()
Solute potential can be calculated with the following equation:
![]()
i = ionization constant for the solute
C = concentration of the solute in moles per liter
R = pressure constant ![]()
T = temperature in Kelvin (Note: Kelvin = °C + 273)
pH balance is vital to living organisms and can be calculated with the following equation:
![]()
Equations Related to Ecology
Greater biodiversity can help ecosystems withstand disruptions (environmental changes). One way to measure the biodiversity of an ecosystem is by using the Simpson’s Diversity Index:
![]()
N = the total number of organisms of all species in an entire ecosystem
n = the total number of organisms of one particular species in an ecosystem
Measuring population growth is important in understanding ecosystems. The following equations can be used to describe population growth.
General rate equation:
![]()
dY is change in Y.
dt is change in time.
The population growth rate can measured by comparing the birth rate and the death rate in a population:
![]()
dN is change in population size.
dt is change in time.
B is the birth rate.
D is the death rate.
If a population is growing exponentially, you may use the following equation:
![]()
rmax is the maximum per capita growth rate of a population.
N is population size.
If a population is growing logistically, you may use the following equation:
![]()
K is the carrying capacity.
Equations for Surface Area and Volume
The surface area to volume ratio of a cell has a big effect on how efficiently it can exchange materials with its environment. The table lists some commonly used surface area formulas and volume formulas for various shapes. In these formulas, note the following:
h is height.
l is length.
r is radius.
s is length of one side of a cube.
w is width.
|
Shape |
Surface Area Formula |
Volume Formula |
Sphere |
4πr2 |
|
Rectangular Solid |
2lh + 2lw + 2wh |
lwh |
Cylinder |
2πrh + 2πr2 |
πr2h |
Cube |
6s2 |
s3 |
Metric Prefixes
Here are some commonly used metric prefixes.
|
Prefix |
Symbol |
Factor |
Giga |
G |
109 |
Mega |
M |
106 |
Kilo |
k |
103 |
Deci |
d |
10—1 |
Centi |
c |
10—2 |
Milli |
m |
10—3 |
Micro |
μ |
10—6 |
Nano |
n |
10—9 |
Pico |
p |
10—12 |
*Note: While you do need to understand how to apply standard deviation and standard error of the mean, and how to use them to construct 95% confidence intervals, you will not be required to calculate standard deviation or standard error of the mean on the AP Biology exam.