CONCEPTS IN BIOLOGY
PART IV. EVOLUTION AND ECOLOGY
17. Population Ecology
17.3. The Population Growth Curve
Because most species have a high reproductive capacity, populations tend to grow if environmental conditions permit. The change in the size of a population depends on the rate at which new organisms enter the population, compared with the rate at which they leave. Natality is the number of individuals added to the population by reproduction per thousand individuals in the population. Mortality is the number of individuals leaving a population by death per thousand individuals in the population. If a species enters a previously uninhabited area, its population will go through a typical pattern of growth. Figure 17.8 shows a population growth curve, which is a graph of change in population size over time. There are four recognizable portions in a population growth curve: the lag phase, the exponential growth phase, the deceleration phase, and the stable equilibrium phase.
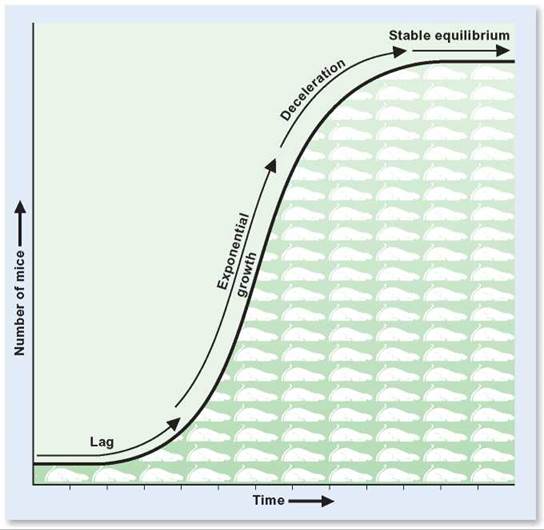
FIGURE 17.8. A Typical Population Growth Curve
In this mouse population, the period of time in which there is little growth is known as the lag phase. This is followed by a rapid increase in population as the offspring of the originating population begin to reproduce themselves; this is known as the exponential growth phase. Eventually, the population growth rate begins to slow during the deceleration phase and the population reaches a stable equilibrium phase, during which the birthrate equals the death rate.
The Lag Phase
The lag phase of a population growth curve is the period of time immediately following the establishment of a population, when the population remains small and fairly constant. During the lag phase, both natality and mortality are low.
The lag phase occurs because reproduction is not an instantaneous event. Even after animals enter an area, they must mate and produce young. This may take days or years, depending on the animal. Similarly, new plant introductions must grow to maturity, produce flowers, and set seed. Some annual plants do this in less than a year, whereas some large trees take several years of growth before they produce flowers. In organisms that take a long time to mature and produce young, such as elephants, deer, and many kinds of plants, the lag phase may be measured in years.
The Exponential Growth Phase
The exponential growth phase of a population growth curve is the period of time when a population is growing rapidly. Exponential growth results in a population increasing by the same percent each year. For example, if the population were to double each year we would have 2, 4, 8, 16, 32, etc. individuals in the population. A population of mice is a good example of why populations can increase rapidly. Assuming that the population is started by a single pair—a male and female—it will take some time for them to mate and produce their first litter of offspring. This is the lag phase. However, once the first litter of young has been produced, the population is likely to increase rapidly. The first litter of young will become sexually mature and able to reproduce in a matter of weeks. If the usual litter size for a pair of mice is 4, the 4 produce 8, which in turn produce 16, and so forth. Furthermore, the original parents will probably produce an additional litter or two during this time period. Now, several pairs of mice are reproducing more than just once. With several pairs of mice reproducing, natality increases while mortality remains low; therefore, the population begins to grow at an ever-increasing rate. However, the population cannot continue to increase indefinitely. Eventually, the rate at which the population is growing will begin to level off.
The Deceleration Phase
A deceleration phase eventually occurs during which the population growth rate begins to slow. The number entering the population by reproduction remains high but the number leaving by death increases and the population growth rate begins to slow. The size of the population continues to grow but at a slower and slower rate until natality and mortality become equal. At this point, the population will enter the stable equilibrium phase.
The Stable Equilibrium Phase
The stable equilibrium phase of a population growth curve is the period of time when a population stops growing and maintains itself at a reasonably stable level. This occurs because the number of individuals entering the population by birth will come to equal the number of individuals leaving it by death or migration. The number of organisms cannot continue to increase indefinitely, because eventually something in the environment will become limiting and cause an increase in the number of deaths. For animals, food, water, or nesting sites may be in short supply, or predators or disease may kill many individuals. Plants may lack water, soil nutrients, or sunlight. Often, there is both a decrease in natality and an increase in mortality as a population reaches the stable equilibrium phase. Although the size of the population is stable, the individuals in the population are changing. Birth, death, and migration are still going on, resulting in a changing mix of individuals. The size of the population is stable because there is an equilibrium between those entering and those leaving the population.
Alternate Population Growth Strategies
When ecologists look at many kinds of organisms and how their populations change, they recognize two general types of reproductive strategies. These are often referred to as K-strategists and r-strategists. The K and r notations come from a mathematical formula where the K represents the carrying capacity and the r represents the population growth rate.
1. K-strategists are large organisms that live a long time and tend to reach a population size that can be sustained over an extended period. These kinds of organisms follow the pattern of population growth just described.
2. r-strategists are organisms that are small and have short life spans, tend to have fluctuating populations, and do not reach a stable equilibrium phase during population growth. Their populations go through the normal pattern of beginning with a lag phase, followed by an exponential growth phase. However, they typically reach a maximum, followed by a rapid decrease in population often called a “crash” (figure 17.9).
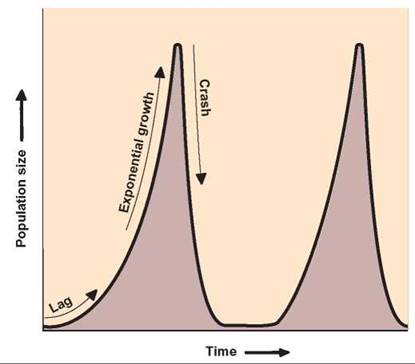
FIGURE 17.9. A Population Growth Curve for Short-Lived Organisms
Organisms that are small and live only a short time often show this kind of population growth curve. There is a lag phase, followed by an exponential growth phase. However, instead of entering into a stable equilibrium phase, the population reaches a maximum and crashes.
17.3. CONCEPT REVIEW
7. Draw a population growth curve. Label the lag, exponential growth, deceleration, and stable equilibrium phases.
8. What causes a lag phase in a population growth curve? An exponential growth phase? A deceleration phase? A stable equilibrium phase?
9. Describe how the population growth curves of K-strategists and r-strategists differ.