THE LIVING WORLD
Unit Three. The Continuity of Life
10. Foundations of Genetics
10.6. Some Traits Don't Show Mendelian Inheritance
Scientists attempting to confirm Mendel’s theory often had trouble obtaining the same simple ratios he had reported. Often the expression of the genotype is not straightforward. Most phenotypes reflect the action of many genes, and the phenotype can be affected by alleles that lack complete dominance, are expressed together, or influence each other’s expression.
Continuous Variation
When multiple genes act jointly to influence a character such as height or weight, the character often shows a range of small differences. Because all of the genes that play a role in determining these phenotypes segregate independently of each other, we see a gradation in the degree of difference when many individuals are examined. A classic illustration of this sort of variation is seen in figure 10.12, a photograph of a 1914 college class. The students were placed in rows according to their heights, under 5 feet toward the left and over 6 feet to the right. You can see that there is considerable variation in height in this population of students. We call this type of inheritance polygenic (many genes) and we call this gradation in phenotypes continuous variation.
How can we describe the variation in a character such as the height of the individuals in figure 10.12a? Individuals range from quite short to very tall, with average heights more common than either extreme. What we often do is to group the variation into categories. Each height, in inches, is a separate phenotypic category. Plotting the numbers in each height category produces a histogram, such as that in figure 10.12b. The histogram approximates an idealized bell-shaped curve, and the variation can be characterized by the mean and spread of that curve. Compare this to the inheritance of plant height in Mendel’s peas; they were either tall or dwarf, no intermediate height plants existed because only one gene controlled that trait.
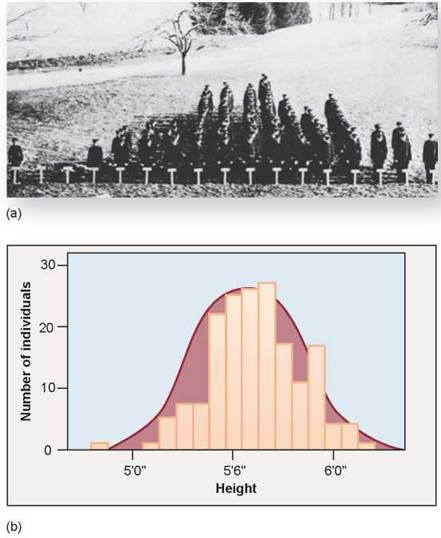
Figure 10.12. Height is a continuously varying character in humans.
(a) This photograph shows the variation in height among students of the 1914 class of the Connecticut Agricultural College. Because many genes contribute to height and tend to segregate independently of each other, there are many possible combinations of those genes. (b) The cumulative contribution of different combinations of alleles for height forms a continuous spectrum of possible heights, in which the extremes are much rarer than the intermediate values. This is quite different from the 3:1 ratio seen in Mendel's F2 peas.
Pleiotropic Effects
Often, an individual allele has more than one effect on the phenotype. Such an allele is said to be pleiotropic. When the pioneering French geneticist Lucien Cuenot studied yellow fur in mice, a dominant trait, he was unable to obtain a true-breeding yellow strain by crossing individual yellow mice with one another. Individuals homozygous for the yellow allele died, because the yellow allele was pleiotropic: One effect was yellow color, but another was a lethal developmental defect. A pleiotropic gene alteration may be dominant with respect to one phenotypic consequence (yellow fur) and recessive with respect to another (lethal developmental defect). In pleiotropy, one gene affects many characters, in marked contrast to polygeny, where many genes affect one character. Pleiotropic effects are difficult to predict, because the genes that affect a character often perform other functions we may know nothing about.
Pleiotropic effects are characteristic of many inherited disorders, such as cystic fibrosis and sickle-cell disease, discussed later in this chapter. In these disorders, multiple symptoms can be traced back to a single gene defect. As shown in figure 10.13, cystic fibrosis patients exhibit overly sticky mucus, salty sweat, liver and pancreas failure, and a battery of other symptoms. All are pleiotropic effects of a single defect, a mutation in a gene that encodes a chloride ion transmembrane channel. In sickle-cell disease, a defect in the oxygen-carrying hemoglobin molecule causes anemia, heart failure, increased susceptibility to pneumonia, kidney failure, enlargement of the spleen, and many other symptoms. It is usually difficult to deduce the nature of the primary defect from the range of its pleiotropic effects.
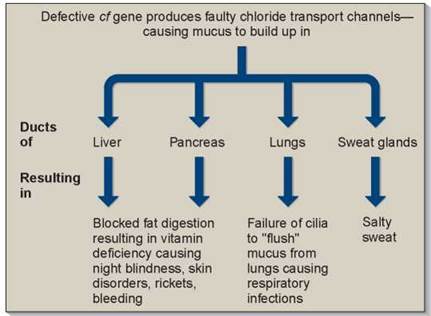
Figure 10.13. Pleiotropic effects of the cystic fibrosis gene, cf.
Not all alternative alleles are fully dominant or fully recessive in heterozygotes. Some pairs of alleles exhibit incomplete dominance and produce a heterozygous phenotype that is intermediate between those of the parents. For example, the cross of red- and white-flowered Japanese four o’clocks described in figure 10.14 produced red-, pink-, and white-flowered F2 plants in a 1:2:1 ratio—heterozygotes are intermediate in color. This is different than in Mendel’s pea plants that didn’t exhibit incomplete dominance; the heterozygotes expressed the dominant phenotype.
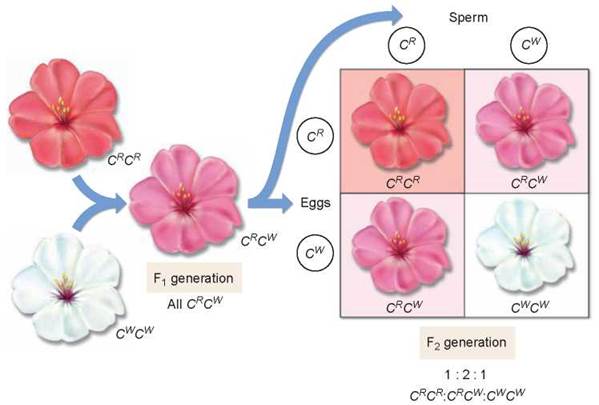
Figure 10.14. Incomplete dominance.
In a cross between a red-flowered Japanese four o'clock, genotype CRCR, and a white-flowered one (CWCW), neither allele is dominant. The heterozygous progeny have pink flowers and the genotype CRCW. If two of these heterozygotes are crossed, the phenotypes of their progeny occur in a ratio of 1:2:1 (red:pink:white).
Environmental Effects
The degree to which many alleles are expressed depends on the environment. Some alleles are heat-sensitive, for example. Traits influenced by such alleles are more sensitive to temperature or light than are the products of other alleles. The arctic fox in figure 10.15, for example, makes fur pigment only when the weather is warm. Can you see why this trait would be an advantage for the fox? Imagine a fox that didn’t possess this trait and was white all year round. It would be very visible to predators in the summer, standing out against its darker surroundings. Similarly, the ch allele in Himalayan rabbits and Siamese cats encodes a heat-sensitive version of tyrosinase, one of the enzymes mediating the production of melanin, a dark pigment. The ch version of the enzyme is inactivated at temperatures above about 33°C. At the surface of the main body and head, the temperature is above 33°C and the tyrosinase enzyme is inactive, while it is more active at body extremities such as the tips of the ears and tail, where the temperature is below 33°C. The dark melanin pigment this enzyme produces causes the ears, snout, feet, and tail to be black.
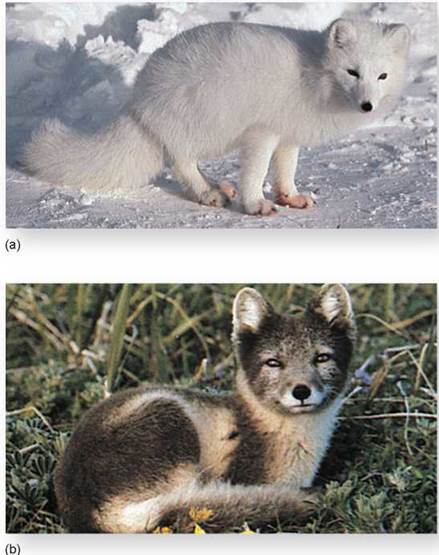
Figure 10.15. Environmental effects on an allele.
(a) An arctic fox in winter has a coat that is almost white, so it is difficult to see the fox against a snowy background. (b) In summer, the same fox's fur darkens to a reddish brown, so that it resembles the color of the surrounding tundra.
In some situations, two or more genes interact with each other, such that one gene contributes to or masks the expression of the other gene. This becomes apparent when analyzing dihybrid crosses involving these traits. Recall that when individuals heterozygous for two different genes mate (a dihybrid cross), offspring may display the dominant phenotype for both genes, either one of the genes, or for neither gene. Sometimes, however, an investigator cannot find four phenotype classes because two or more of the genotypes express the same phenotypes.
As was stated earlier, few phenotypes are the result of the action of one gene. Most traits reflect the action of many genes, some that act sequentially or jointly. Epistasis is an interaction between the products of two genes in which one of the genes modifies the phenotypic expression produced by the other. For example, some commercial varieties of corn, Zea mays, exhibit a purple pigment called anthocyanin in their seed coats, while others do not. In 1918, geneticist R. A. Emerson crossed two true-breeding corn varieties, neither exhibiting anthocyanin pigment. Surprisingly, all of the F1plants produced purple seeds.
When two of these pigment-producing F1 plants were crossed to produce an F2 generation, 56% were pigment producers and 44% were not. What was happening? Emerson correctly deduced that two genes were involved in producing pigment, and that the second cross had thus been a dihybrid cross like those performed by Mendel. Mendel had predicted 16 equally possible ways gametes could combine with each other, resulting in genotypes with a phenotypic ratio of 9:3:3:1 (9 + 3 + 3 + 1 = 16). How many of these were in each of the two types Emerson obtained? He multiplied the fraction that were pigment producers (0.56) by 16 to obtain 9 and multiplied the fraction that were not (0.44) by 16 to obtain 7. Thus, Emerson had a modified ratio of 9:7 instead of the usual 9:3:3:1 ratio. Figure 10.16 shows the results of the dihybrid cross made by Emerson. Go back and compare these results with Mendel’s dihybrid cross in figure 10.10 and you can see that the F2 genotypes in Emerson’s results are consistent with what Mendel found; so why are the phenotypic ratios different?
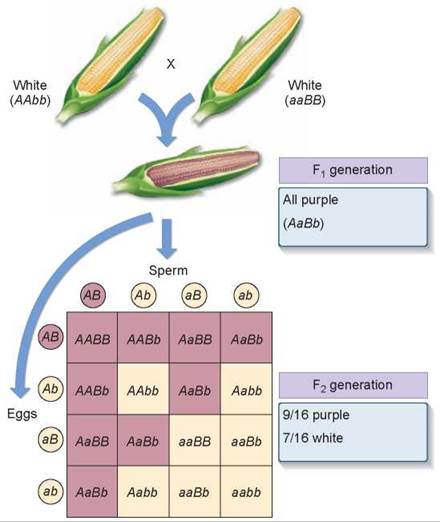
Figure 10.16. How epistasis affects kernel color.
The purple pigment found in some varieties of corn is the result of two genes. Unless a dominant allele is present at each of the two loci, no pigment is expressed.
Why Was Emerson’s Ratio Modified? It turns out that in corn plants either one of the two genes that contribute to kernel color can block the expression of the other. One of the genes (B) produces an enzyme that permits colored pigment to be produced only if a dominant allele (BB or Bb) is present. The other gene (A) produces an enzyme that in its dominant form (AA or Aa) allows the pigment to be deposited on the seed coat color. Thus, an individual with two recessive alleles for gene A (no pigment deposition) will have white seed coats even though it is able to manufacture the pigment because it possesses dominant alleles for gene B (purple pigment production). Similarly, an individual with dominant alleles for gene A (pigment can be deposited) will also have white seed coats if it has only recessive alleles for gene B (pigment production) and cannot manufacture the pigment.
To produce and deposit pigment, a plant must possess at least one functional copy of each enzyme gene (A_B_). Of the 16 genotypes predicted by random assortment, 9 contain at least one dominant allele of both genes; they produce purple progeny and are colored darker in the Punnett square in figure 10.16. The remaining 7 genotypes lack dominant alleles at either or both loci (3 + 3 + 1 = 7) and so are phenotypically the same (nonpigmented—the light-color boxes in the Punnett square), giving the phenotypic ratio of 9:7 that Emerson observed.
Other Examples of Epistasis In many animals, coat color is the result of epistatic interactions among genes. Coat color in Labrador retrievers, a breed of dog, is due primarily to the interaction of two genes. The E gene determines if dark pigment will be deposited in the fur or not. If a dog has the genotype ee (like the two dogs on the left in figure 10.17), no pigment will be deposited in the fur, and it will be yellow. If a dog has the genotype EE or Ee (E_), pigment will be deposited in the fur (like the two dogs on the right).
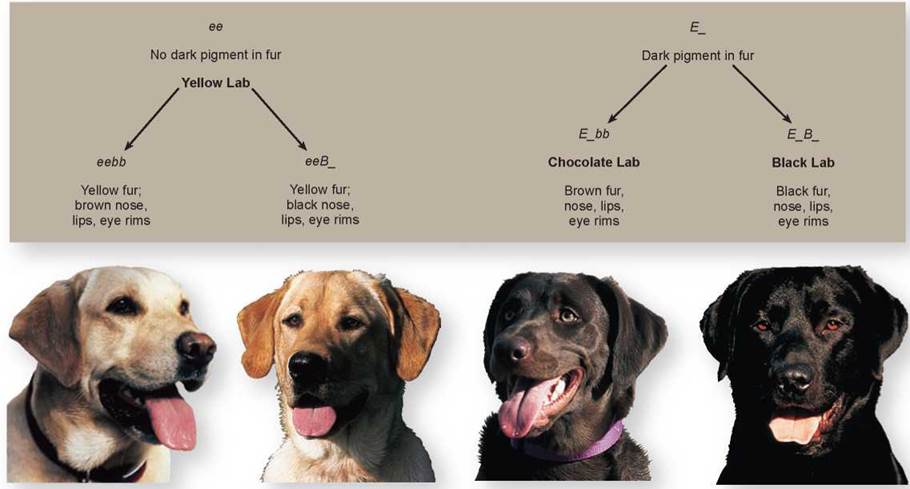
Figure 10.17. The effect of epistatic interactions on coat color in dogs.
The coat color seen in Labrador retrievers is an example of the interaction of two genes, each with two alleles. The E gene determines if the pigment will be deposited in the fur, and the B gene determines how dark the pigment will be.
A second gene, the B gene, determines how dark the pigment will be. Dogs with the genotype E_bb will have brown fur and are called chocolate labs. Dogs with the genotype E_B_ are black labs with black fur. But, even in yellow dogs, the B gene does have some effect. Yellow dogs with the genotype eebb (on the far left) will have brown pigment on their nose, lips, and eye rims, while yellow dogs with the genotype eeB_ (the second from the left) will have black pigment in these areas. The genes for coat color in this breed have been found, and a genetic test is available to determine the coat color in a litter of puppies.
Codominance
A gene may have more than two alleles in a population, and in fact most genes possess several different alleles. Often in heterozygotes there isn’t a dominant allele; instead, the effects of both alleles are expressed. In these cases, the alleles are said to be codominant.
Codominance is seen in the color patterning of some animals. For example, the “roan” pattern is a coloring pattern exhibited in some varieties of horses and cattle. A roan animal expresses both white and colored hairs on at least part of its body. This intermingling of the different colored hairs creates either an overall lighter color, or patches of lighter and darker colors. The roan pattern results from a heterozygous genotype, such as produced by mating of a homozygous white and homozygous colored. Could the intermediate color be the result of incomplete dominance? No. The heterozygote that receives a white allele and a colored allele does not have individual hairs that are a mix of the two colors; rather, both alleles are being expressed, with the result that the animal has some hairs that are white and some that are colored. The gray horse in figure 10.18 is exhibiting the roan pattern. It looks like it has gray hairs, but if you were able to examine its coat closely, you would see both white hairs and black hairs, giving it an overall gray color.
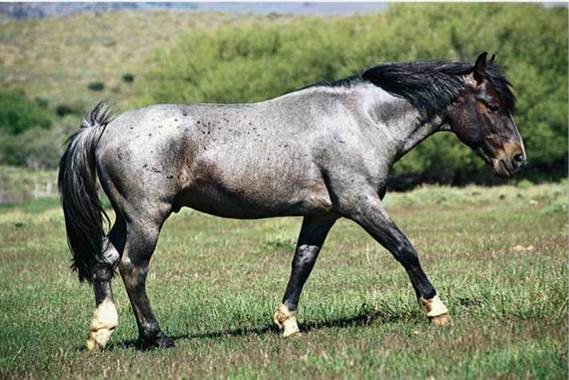
Figure 10.18. Codominance in color patterning.
This roan horse is heterozygous for coat color. The offspring of a cross between a white homozygote and a black homozygote, it expresses both phenotypes. Some of the hairs on its body are white and some are black.
A human gene that exhibits more than one dominant allele is the gene that determines ABO blood type. This gene encodes an enzyme that adds sugar molecules to lipids on the surface of red blood cells. These sugars act as recognition markers for cells in the immune system and are called cell surface antigens. The gene that encodes the enzyme, designated I, has three common alleles: IB, whose product adds the sugar galactose; IA, whose product adds galactosamine; and i, which codes for a protein that does not add a sugar.
Different combinations of the three I gene alleles occur in different individuals because each person may be homozygous for any allele or heterozygous for any two. An individual heterozygous for the IA and IB alleles produces both forms of the enzyme and adds both galactose and galactosamine to the surfaces of red blood cells. Because both alleles are expressed simultaneously in heterozygotes, the IA and IB alleles are codominant. Both IA and IB are dominant over the i allele because both IA or IB alleles lead to sugar addition and the i allele does not. The different combinations of the three alleles produce four different phenotypes:
1. Type A individuals add only galactosamine. They are either IAIA homozygotes or IAi heterozygotes (the three darkest boxes in figure 10.19).
2. Type B individuals add only galactose. They are either IBIB homozygotes or IBi heterozygotes (the three lightest-colored boxes).
3. Type AB individuals add both sugars and are IAIB heterozygotes (the two intermediate-colored boxes).
4. Type O individuals add neither sugar and are ii homozygotes (the one white box in figure 10.19).
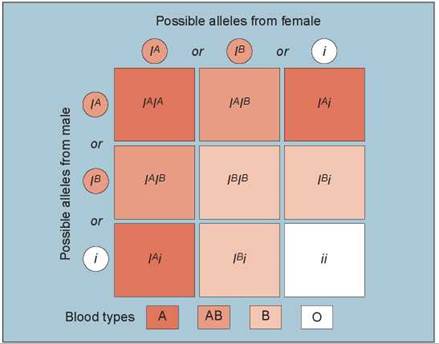
Figure 10.19. Multiple alleles controlling the ABO blood groups.
Three common alleles control the ABO blood groups. The different combinations of the three alleles result in four different blood type phenotypes: type A (either IAIA homozygotes or IAi heterozygotes), type B (either IBIB homozygotes or IBi heterozygotes), type AB (IAIB heterozygotes), and type O (ii homozygotes).
These four different cell surface phenotypes are called the ABO blood groups. A person’s immune system can distinguish between these four phenotypes. If a type A individual receives a transfusion of type B blood, the recipient’s immune system recognizes that the type B blood cells possess a “foreign” antigen (galactose) and attacks the donated blood cells, causing the cells to clump or agglutinate. This also happens if the donated blood is type AB. However, if the donated blood is type O, it contains no galactose or ga- lactosamine antigens on the surfaces of its blood cells, and so elicits no immune response to these antigens. For this reason, the type O individual is often referred to as a “universal donor.” In general, any individual’s immune system will tolerate a transfusion of type O blood. Because neither galactose nor galactosamine is foreign to type AB individuals (whose red blood cells have both sugars), those individuals may receive any type of blood.
Key Learning Outcome 10.6. A variety of factors can disguise the Mendelian segregation of alleles. Among them are continuous variation, which results when many genes contribute to a trait; pleiotropic effects, where one allele affects many phenotypes; incomplete dominance, which produces heterozygotes unlike either parent; environmental influences on the expression of phenotypes; and the interaction of more than one allele, as seen in epistasis and codominance.
Today’s Biology
Does Environment Affect I.Q.?
Nowhere has the influence of environment on the expression of genetic traits led to more controversy than in studies of I.Q. scores. I.Q. is a controversial measure of general intelligence based on a written test that many feel to be biased toward white middle-class America. However well or poorly I.Q. scores measure intelligence, a person's
I.Q. score has been believed for some time to be determined largely by his or her genes.
How did science come to that conclusion? Scientists measure the degree to which genes influence a multigene trait by using an off-putting statistical measure called the variance. Variance is defined as the square of the standard deviation (a measure of the degree-of-scatter of a group of numbers around their mean value), and has the very desirable property of being additive—that is, the total variance is equal to the sum of the variances of the factors influencing it.
What factors contribute to the total variance of I.Q. scores? There are three. The first factor is variation at the gene level, some gene combinations leading to higher I.Q. scores than others. The second factor is variation at the environmental level, some environments leading to higher I.Q. scores than others. The third factor is what a statistician calls the covariance, the degree to which environment affects genes.
The degree to which genes influence a trait like I.Q., the heritability of I.Q., is given the symbol H and is defined simply as the fraction of the total variance that is genetic.
So how heritable is I.Q.? Geneticists estimate the heritability of I.Q. by measuring the environmental and genetic contributions to the total variance of I.Q. scores.
The environmental contributions to variance in I.Q. can be measured by comparing the I.Q. scores of identical twins reared together with those reared apart (any differences should reflect environmental influences). The genetic contributions can be measured by comparing identical twins reared together (which are 100% genetically identical) with fraternal twins reared together (which are 50% genetically identical). Any differences should reflect genes, as twins share identical prenatal conditions in the womb and are raised in virtually identical environmental circumstances, so when traits are more commonly shared between identical twins than fraternal twins, the difference is likely genetic.
When these sorts of "twin studies” have been done in the past, researchers have uniformly reported that I.Q. is highly heritable, with values of H typically reported as being around 0.7 (a very high value). While it didn't seem significant at the time, almost all the twins available for study over the years have come from middle-class or wealthy families.
The study of I.Q. has proven controversial, because I.Q. scores are often different when social and racial groups are compared. What is one to make of the observation that I.Q. scores of poor children measure lower as a group than do scores of children of middle-class and wealthy families? This difference has led to the controversial suggestion by some that the poor are genetically inferior.
What should we make of such a harsh conclusion? To make a judgement, we need to focus for a moment on the fact that these measures of the heritability of I.Q. have all made a critical assumption, one to which population geneticists, who specialize in these sorts of things, object strongly. The assumption is that environment does not affect gene expression, so that covariance makes no contribution to the total variance in I.Q. scores—that is, that the covariance contribution to H is zero.
Studies have allowed a direct assessment of this assumption. Importantly, it proves to be flat wrong.
In November of 2003, researchers reported an analysis of twin data from a study carried out in the late 1960s. The National Collaborative Prenatal Project, funded by the National Institutes of Health, enrolled nearly 50,000 pregnant women, most of them black and quite poor, in several major U.S. cities. Researchers collected abundant data, and gave the children I.Q. tests seven years later. Although not designed to study twins, this study was so big that many twins were born, 623 births. Seven years later, 320 of these pairs were located and given I.Q. tests. This thus constitutes a huge "twin study,” the first ever conducted of I.Q. among the poor.
When the data were analyzed, the results were unlike any ever reported. The heritability of I.Q. was different in different environments! Most notably, the influence of genes on I.Q. was far less in conditions of poverty, where environmental limitations seem to block the expression of genetic potential. Specifically, for families of high socioeconomic status, H = 0.72, much as reported in previous studies, but for families raised in poverty, H = 0.10, a very low value, indicating that genes were making little contribution to observed I.Q. scores. The lower a child's socioeconomic status, the less impact genes had on I.Q.
These data say, with crystal clarity, that the genetic contributions to I.Q. don't mean much in an impoverished environment.
How does poverty in early childhood affect the brain? Neuroscientists reported in 2008 that many children growing up in very poor families experience poor nutrition and unhealthy levels of stress hormones, both of which impair their neural development. This affects language development and memory for the rest of their lives.
Clearly, improvements in the growing and learning environments of poor children can be expected to have a major impact on their I.Q. scores. Additionally, these data argue that the controversial differences reported in mean I.Q. scores between racial groups may well reflect no more than poverty, and are no more inevitable.