Cracking the AP Chemistry Exam
Part IV
Content Review for the AP Chemistry Exam
Chapter 8
Big Idea #6: Equilibrium, Acids and Bases, Titrations, and Solubility
TITRATION
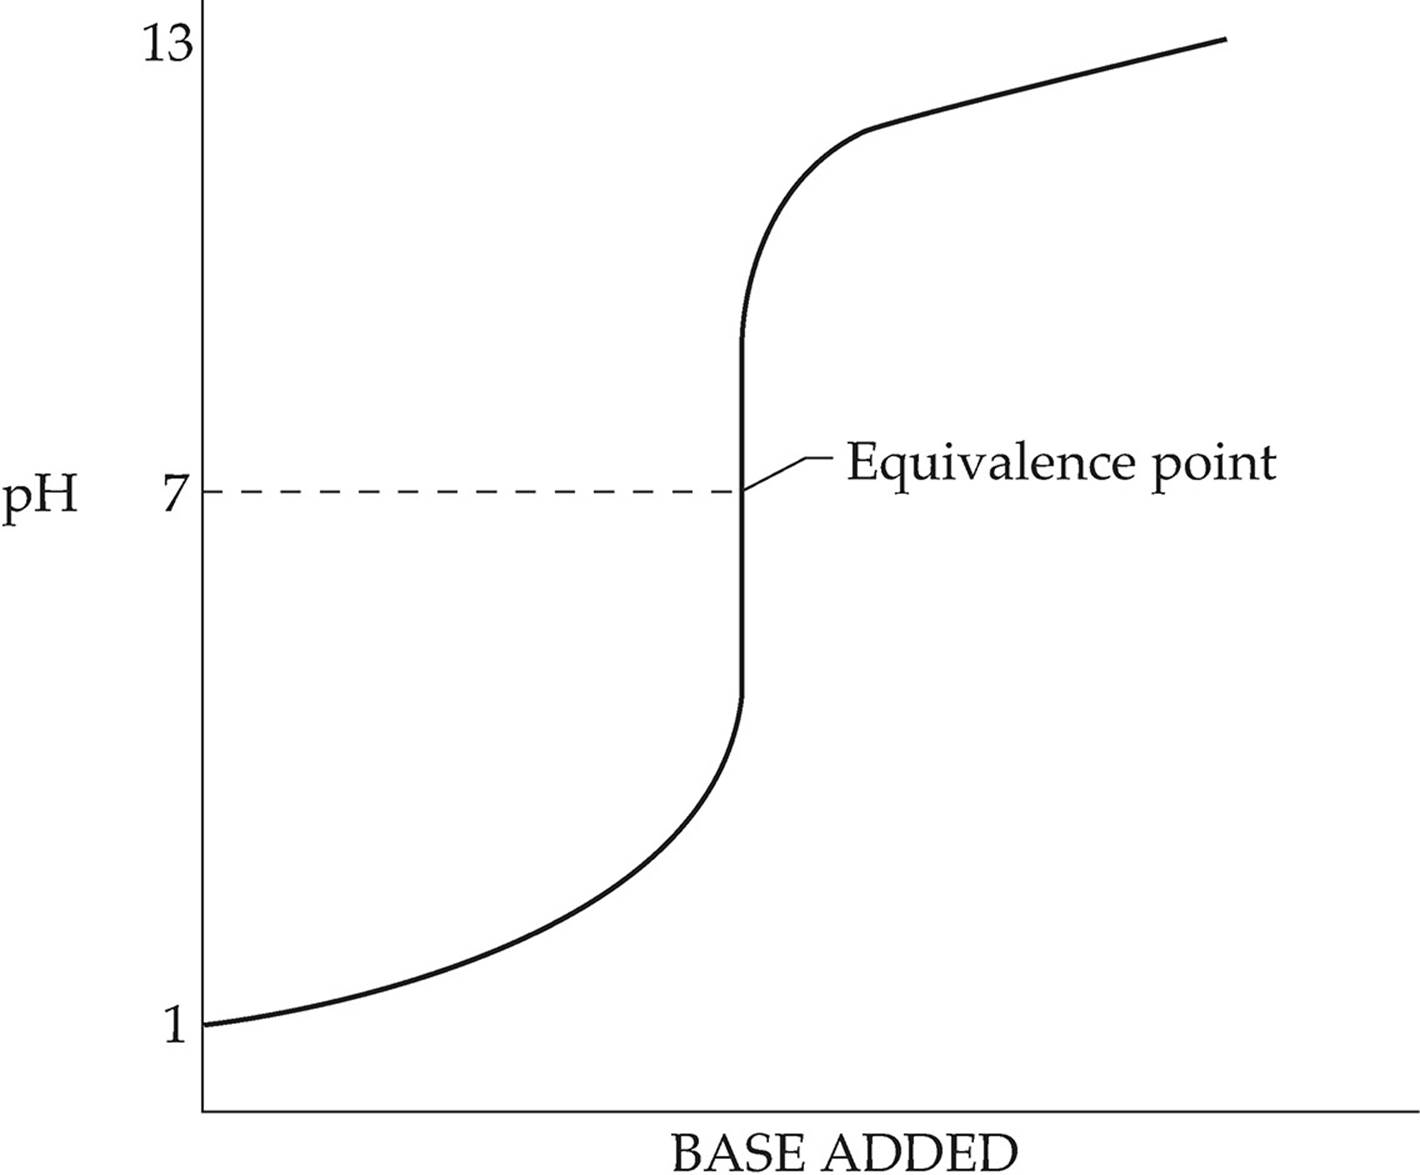
Neutralization reactions are generally performed by titration, where a base of known concentration is slowly added to an acid (or vice versa). The progress of a neutralization reaction can be shown in a titration curve. The following diagram shows the titration of a strong acid by a strong base.

For this titration, the pH
at the equivalence point
is exactly 7 because the
titration of a strong acid
by a strong base produces
a neutral salt solution.
In the diagram above, the pH increases slowly but steadily from the beginning of the titration until just before the equivalence point. The equivalence point is the point in the titration when exactly enough base has been added to neutralize all the acid that was initially present. Just before the equivalence point, the pH increases sharply as the last of the acid is neutralized. The equivalence point of a titration can be recognized through the use of an indicator. An indicator is a substance that changes color over a specific pH range. When choosing an indicator, it’s important to make sure the equivalence point falls within the pH range for the color change.
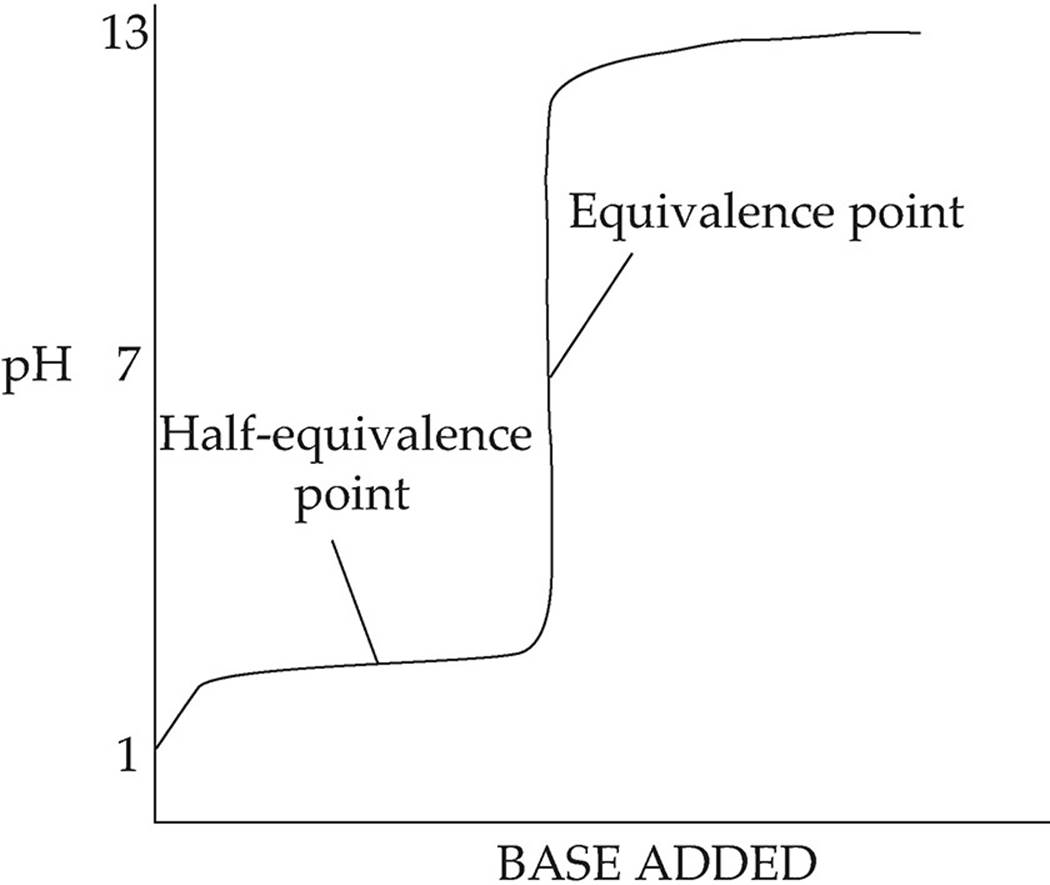
The following diagram shows the titration of a weak acid by a strong base:

In this diagram, the pH increases more quickly at first, then levels out into a buffer region. At the center of the buffer region is the half-equivalence point. At this point, enough base has been added to convert exactly half of the acid into conjugate base; here the concentration of acid is equal to the concentration of conjugate base (pH=pKa). The curve remains fairly flat until just before the equivalence point, when the pH increases sharply. For this titration, the pH at the equivalence point is greater than 7 because the only ion present in significant amounts at equilibrium is the conjugate base of the weak acid. Likewise, if you titrate a weak base with a strong acid, the solution will be acidic at equilibrium because the only ion present in significant amounts will be the conjugate acid of the weak base.
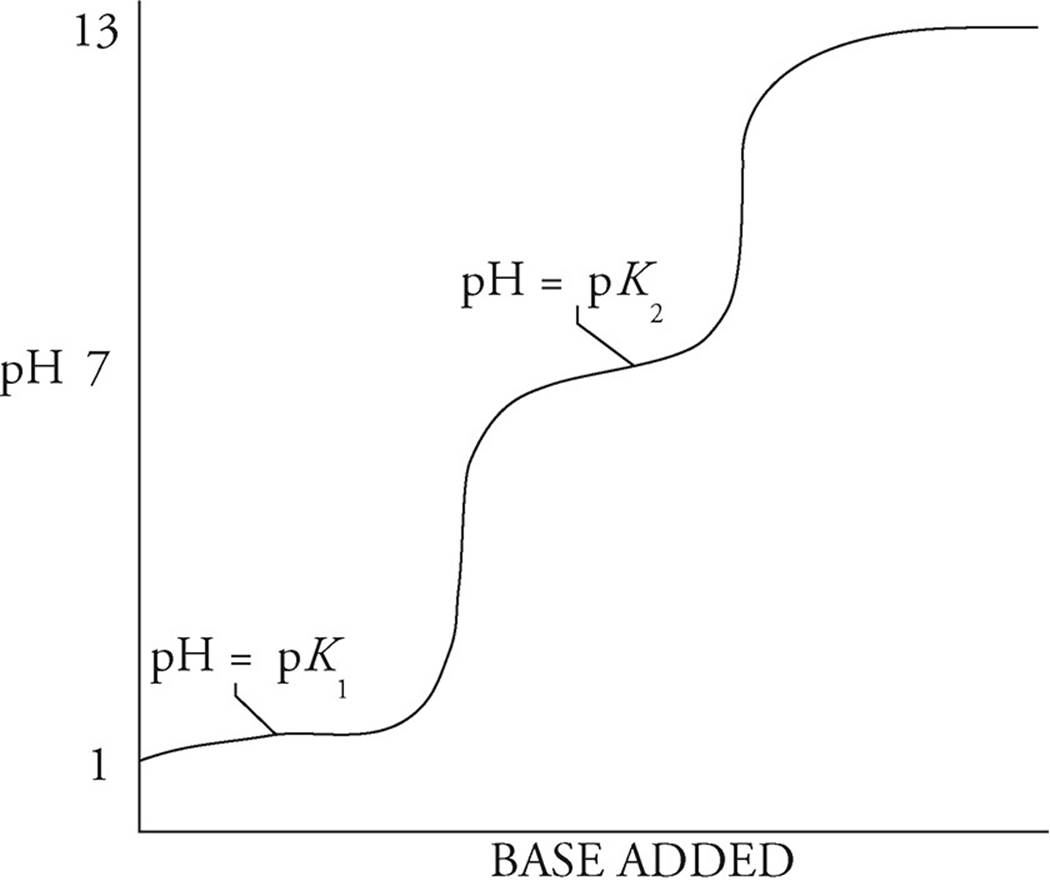
The following diagram shows the titration curve of a polyprotic acid:

For a polyprotic acid, the titration curve will have as many bumps as there are hydrogen ions to give up. The curve above has two bumps, so it represents the titration of a diprotic acid. There are also two half-equivalence points for a diprotic acid. At the first one, the pH will be equal to the negative log of the first dissociation constant for the polyprotic acid (pK1). At the second half-equivalence point, the pH will be equal to the negative log of the second dissociation constant (pK2).