The Handy Chemistry Answer Book (2014)
ANALYTICAL CHEMISTRY
A LITTLE MATH
What is the difference between a qualitative and a quantitative observation?
Quantitative observations are, as the name suggests, observations that attempt to quantify how much of something there is. Chemists are often interested in measuring concentrations of chemical species, the amount of energy released in a reaction, the lengths of chemical bonds, and numerical values associated with a multitude of other chemical properties. A few examples of measurements an analytical chemist might make are determining how much fat is in a cookie (about 10 grams), how much CO2 is in the air (about 390 ppm), or how much lead is in your drinking water (hopefully very little!).
Qualitative observations are observations that tell about a general property of an object, but don’t quantify exactly how much of something there is. Typically this means the observation isn’t giving a number of something, but rather it is describing a quality of an object. Examples might be that a piece of candy tastes sweet, that the sky is blue, or that a circle is round.

Chemists use quantitative measurements to discover, for example, the concentration of lead or other substances in our drinking water.
Some observations can be tough to classify as strictly qualitative or strictly quantitative. For example, a judge at the Olympic games may assign a score of 9.5 to a gymnastics performance, indicating that she really liked it. Quantitatively this allows for a comparison among the different competitors, but it still feels somewhat qualitative since it reflects a judge’s opinion and could be influenced by factors like how carefully the judge observed the performance, what elements of a gymnastics routine the judge values the most, or even just by the judge’s mood.
What is an analyte?
An analyte is simply the chemical species whose properties we are trying to measure in an analytical chemistry experiment. Most often, analytical chemists are interested in measuring the concentration of an analyte present in a sample. The measurement of an analyte concentration is a quantitative observation.
What are interferences?
Interferences are substances that interfere with the measurement of the analyte we are interested in. They give a similar response to our analyte in whatever analytical measurement we are making. Typically analytical chemists want to remove any interferences from a sample prior to making a measurement, or, alternatively, choose the method of analysis carefully, so as to avoid any signals caused by interferences.
What is experimental error?
Experimental error describes the uncertainty or variation in a measurement that is repeated several times. This variation could come from many sources, such as limitations in the quality of the device being used to make the measurement, the ability of the experimenter to accurately repeat the experiment or measurement, or something intrinsic about the quantity being measured.
What are some examples of experimental error?
Say, for example, we use a stopwatch to record the lap times for a racecar driving several laps around a track. Our measurements of the lap times will be affected by the quality of the stopwatch, our ability to accurately operate the stopwatch during each lap, as well as variations in the ability of the racecar driver and car to maneuver around the track.
What is standard deviation?
One common way of reporting the error in a measurement is to report the standard deviation for the set of measurements. Standard deviation is calculated from the formula:
![]()
where N is the number of trials, xi is the value of the measurement of the ith trial, and μ is the arithmetic mean value of the N measurements.
What is the smallest quantity of lead that can be detected in drinking water?
Lead is something we definitely don’t want in our drinking water. The maximum contaminant level goal set by the U.S. Environmental Protection Agency (as of 2011) is zero, indicating that there is no amount of “safe” exposure to lead in drinking water. The EPA’s maximum contaminant level, which is based on more practical considerations, is 15 parts per billion. So how little can we detect? Thankfully, way less than that. Even in the 1990s it was possible to detect lead concentrations as low as 0.1 parts per billion. So analytical chemists are on top of keeping us safe from lead in our drinking water (as long as someone is checking on it regularly).
What is the signal-to-noise ratio in a measurement?
The signal-to-noise ratio is a comparison between the strength of a measured signal to the background variation naturally present in the experiment. There are different ways of reporting the signal-to-noise ratio, but one commonly used measure is to compare the mean value of a measurement to the standard deviation of the background region.
For example, we might want to measure the intensity of a laser beam using a detector. The signal would be the measured intensity when we shine the laser beam on the detector. The noise would be measured as the standard deviation of the intensity measured due to the ambient light when the laser was not shined onto the detector.
Such a definition is commonly used when looking at weak signals in imaging or microscopy. Choosing an appropriate way of reporting the signal-to-noise ratio can depend on details of the situation in question, such as whether the data can take on both positive and negative values, or whether the data can only have positive values.
What is a detection limit?
The detection limit for a measurement is the lowest amount of signal that can be distinguished from the background level of noise. The detection limit is commonly reported with a confidence level describing the percent confidence with which the measured signal at the detection limit can be stated to be above the noise intrinsic to the experiment.
What is random error?
Random errors are variations that increase the standard deviation of a measurement randomly about its mean value. Since random errors should be distributed in a random fashion, both above and below the true value of the quantity being measured, taking repeated measurements can reduce their effect on the measured experimental value. Random errors could be caused by things like noise in an electrical circuit or random fluctuations in the temperature or humidity of the laboratory environment. Random errors are characterized by their Gaussian distribution of values about the mean measured value.
What is a Gaussian distribution?
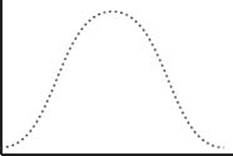
A Gaussian distribution is a type of probability distribution that characterizes the distribution of a randomly distributed variable about a single mean (average) value. This is the most commonly encountered type of distribution in statistical analysis, so it is good to be at least a little familiar with it. Provided one knows that the probability distribution for a variable is Gaussian, the distribution for that variable can be completely characterized by its mean and standard deviation, which has the shape of a bell curve:
What is the area under the curve for a normalized Gaussian distribution?
As should be the case for any normalized probability distribution, the area under the curve of a Gaussian distribution totals to 1. This is necessary for the probability of a set of events to have a physically meaningful value since the sum of the probabilities of all possible outcomes must total to 1 (or 100%). Probability distributions that satisfy this property are said to be normalized, and the Gaussian distribution is actually also commonly referred to as the normal distribution. With any Gaussian distribution, 68% of the possible outcomes will lie within 1 standard deviation of the mean value, 95% within two standard deviations, and 99.7% within three standard deviations.
What is systematic error?
Systematic errors are unlike random errors in that they change the observed value from the true value in a consistent direction. One example would be if you read a thermometer from the wrong angle; you might consistently read the level of the liquid inside to be a few degrees higher than it actually reads. This would systematically bias the observed value toward a higher temperature than the true value. Another example would be if a scale were calibrated incorrectly, such that it read 5 grams even when no weight was placed on it. This could result in an observed mass that is systematically higher than the actual mass.