Liquid-State Physical Chemistry: Fundamentals, Modeling, and Applications (2013)
12. Mixing Liquids: Ionic Solutions
12.3. Hydration Structure
Several methods exist to study solvation. We first address gas-phase hydration. After introducing a basic model for the liquid hydration structure, we then discuss some results from nuclear magnetic resonance, ion movement, and diffraction methods.
12.3.1 Gas-Phase Hydration
One experimental method of assessing the hydration of ions is based on the generation of ions M± by thermionic emission, from a suitable salt for a positive ion, or by reactive electron transfer by ![]() for negative ions, in a water vapor-containing vessel. Equilibrium between the ions and the water molecules is established according to
for negative ions, in a water vapor-containing vessel. Equilibrium between the ions and the water molecules is established according to
(12.10) ![]()
The concentrations are measured using mass spectroscopy, and by varying the temperature the enthalpy and entropy of the reactions can be determined. In this way, clusters containing up to six water molecules have been detected. One can then calculate the total enthalpy for the reaction
(12.11) ![]()
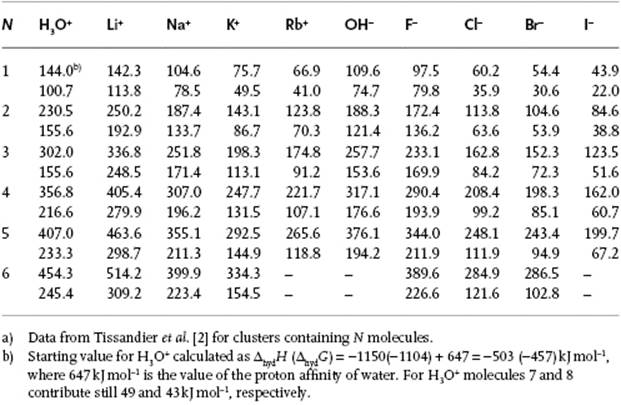
where, if necessary, extrapolation of the data to n = 6 is done. Table 12.2 provides data for several ions using this technique. The proton was also studied in this way. Adding all partial enthalpies for the H+ ion results in ΔhydH = −1192 kJ mol−1, which is in reasonable agreement with liquid-phase data. For higher values of n, the contribution to ΔhydH is ∼40 kJ mol−1, to be compared with the evaporation enthalpy for H2O, ΔevaH = 44 kJ mol−1. Note that ΔhydH for the H+ ion is much larger than for any other ion.
Table 12.2 Enthalpy of hydration −ΔhydH (upper row) and −ΔhydG (lower row) in kJ mol−1 for several ions in the gas phase at 300 K.a)
Problem 12.8
Indicate why the proton behaves so differently from all other ions.
12.3.2 Liquid-Phase Hydration
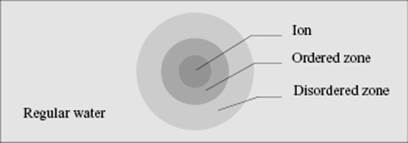
The structure of water changes in the neighborhood of ions. It appears that ions are solvated and a general model, due to Frank [13], is sketched in Figure 12.2. In the first zone around an ion, the inner hydration shell (or ordered zone), the water molecules are more or less immobilized by the high field of the ion. This is sometimes described as an “iceberg,” as the structure has some ice-like characteristics. Occasionally, the ordered zone is divided in a primary shell in direct contact with the ion, as well as a secondary region that is not in direct contact but is still influenced by the proximity of the central ion. In the second zone, the structure-breaking zone (or disordered zone), the structure is more disordered than in ordinary water, where there is considerable order due to hydrogen bonding. In this zone the structure is due to the competing effect of the orientating influence of the ion or dipoles and the normal structural effect of the neighboring molecules. The third zone comprises normal water.
Figure 12.2 Frank model for the structure of water around an ion.
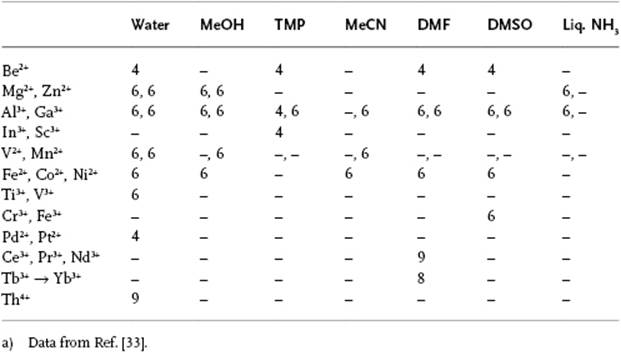
When using proton nuclear magnetic resonance (NMR) spectroscopy, a proton must remain for at least 10−4 s in a certain environment in order to be distinguished as a distinct entity, but this is generally a long time when compared to molecular diffusion times. If the residence time is less, only one resonance line will be observed for each type of proton, for example, one for H2O and two for CH3OH. If the resonance time is longer, because bonding of the solvent to the central ion is strong, then two lines may be observed for a given proton – one for the solvent molecules in the primary solvation shell, and one for the bulk including the secondary ordered region and disordered zone (Figure 12.3). The solvation number can be calculated from the peak areas if the overall composition is known. For example, a 1 M aqueous solution of Mg2+ ions with density ρ = 1.115 g cm−3 will contain 985 g or 985/18 = 54.7 moles of H2O. For a coordination number of six, of these 54.7 moles, six can be attributed to the primary hydration shell and 48.7 to “bulk” water. The ratio of the two peaks thus will be 6 : 48.7 or 1 : 8.1. Although these measurements can sometimes be made done at room temperature, it is often necessary to cool the solution in order to obtain sufficient “bonding” and thus produce two separate signals (Figure 12.3). This also provides the possibility of studying the solvent exchange rate and the associated activation energy. Table 12.3 provides a summary of solvation numbers obtained in this way; the data show that the solvation number for positive ions is mostly six, in both aqueous and nonaqueous solutions. Only for very small ions (Be2+), for square-planar coordination (Pt2+ and Pd2+) and for very voluminous solvents, will a lower solvation number be observed. For the larger ions (lanthanides, actinides) a solvation number greater than six will result.
Figure 12.3 1H NMR spectra of magnesium perchlorate in aqueous acetone.
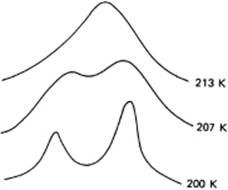
Table 12.3 Solvation numbers as determined from NMR data in various solvents.a)
Overall, this is a simplified picture of the primary solvation of ions. It should be noted that the general applicability of this NMR method is somewhat limited, as only diamagnetic and some paramagnetic ions can be studied in this way.
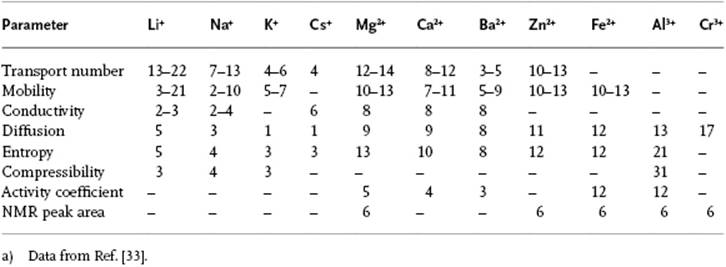
Another approach to estimating solvation numbers is to use information from the motion of ions through the solvent, be it due to spontaneous motion (diffusion), mechanically stimulated motion (viscosity), or electrically stimulated motion (conductivity). The resistance of ions and their associated solvation shell reflects their effective size. For example, conductivity measurements indicate that conductivity is dependent on charge and size of the ion involved. From the conductivity, it is possible to estimate the mobility, and from the mobility the diffusivity. The latter then yields an estimate for the hydrodynamic radius or volume. Subtracting the volume of the ion results in the volume of the solvent molecules in the solvation shell, from which the number of molecules can be easily calculated. We refrain from further details of the measurements, and simply list some hydration results in Table 12.4. These data show that the solvation numbers so obtained are significantly larger than those obtained via NMR experiments. This is due to the fact that these methods include the primary as well as secondary solvation shell. Moreover, the results differ widely for different techniques. It is expected that similar trends occur for other solvents than water.
Table 12.4 Hydration numbers as determined by several methods.a)
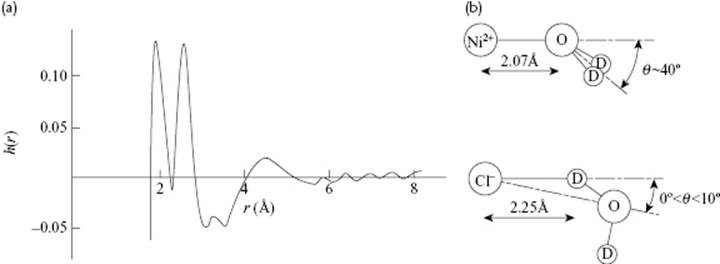
With scattering and diffraction experiments using X-rays and neutrons, research groups have also studied ionic solutions, a typical example being NiCl2 in D2O3). In this case, the total correlation function h(r) = g(r) − 1, as measured with neutron ray diffraction (NRD), shows two peaks. If the area r2g(r) is calculated, the ratio of the first peak to the second peak is one-half. The first peak is due to the metal–oxygen distances of the (heavy) water surrounding the Ni2+ ion, while the second peak is due to the metal–deuterium distances, which explains the observed ratio. From the correlation function it can be inferred that the Ni–O distance is about 0.207 nm, and that the Ni–O axis makes an angle of about 40° with the D2O plane (Figure 12.4). Calculating the coordination number using
(12.12) ![]()
where M1 denotes the first minimum in g(r), one obtains N1 ≅ 5.8. This suggests a more or less octahedral arrangement of the D2O molecules around the Ni2+ ion. In any case, the coordination is tight as the relevant distances are all below 0.4 nm. A similar result is shown for the Cl− ion from NaCl and CaCl2 solutions with N1 ≅ 6, but now with the Cl–D distance smaller than the Cl–O distance (Figure 12.4).
Figure 12.4 (a) Total-correlation function h(r) = g(r) − 1 of Ni2+ surrounded by D2O; (b) The configuration of a D2O molecule with respect to a Ni2+ and Cl− ion as calculated from g(r) data. Data from Ref. [34].
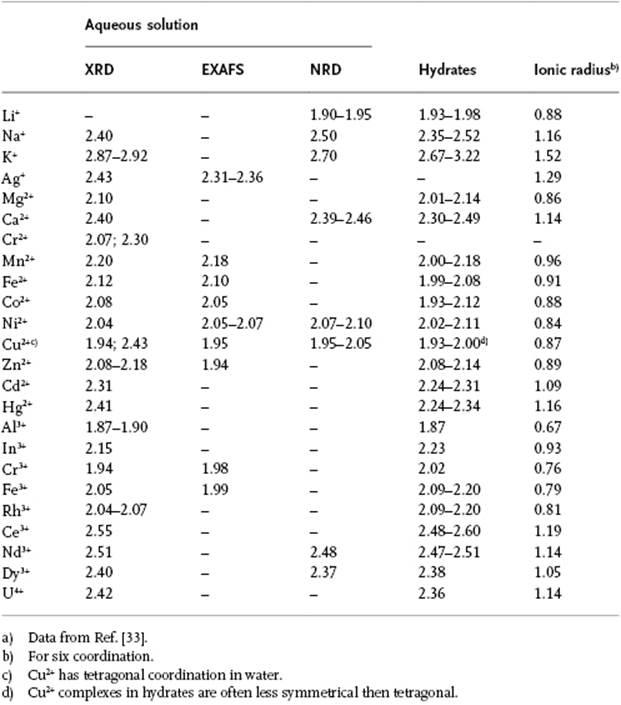
So, the most prominent feature in the pair-correlation function is the nearest-neighbor distance of metal ions to solvent. Table 12.5 shows an overview of the metal–oxygen distances as determined with X-ray and neutron techniques. Both, XRD and EXAFS4) are capable of probing more complex geometries. The coordination of Cu2+ ions provides an example, and in this case a metal–oxygen distance at 0.194 nm and 0.240 nm is generally recognized. These distances correspond to the four equatorial and two axial water molecules in a (distorted) octahedral coordination (Figure 12.5). A similar result has been obtained for [Cr(OH2)]2+ with equatorial and axial distances of 0.207 nm and 0.230 nm, respectively.
Figure 12.5 The structure of (a) [Cu(OH2)6]2+; (b) [Fe(OH2)6]2+; and (c) [FeCl4]−. Distances are indicated in Å.
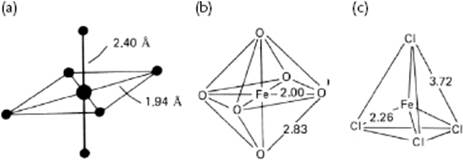
Table 12.5 Metal to oxygen distances (Å) in metal–water complexes.a)
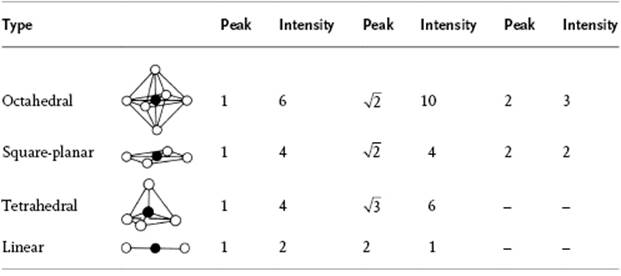
A more complete picture can be obtained if the O–O distances can also be determined. For example, in octahedral [Fe(OH2)6]2+ the O–O distance ![]() times the Fe–O distance, while in tetrahedral [FeCl4]− the Cl–Cl distance is
times the Fe–O distance, while in tetrahedral [FeCl4]− the Cl–Cl distance is ![]() times the Fe–Cl distance (Figure 12.5). In general, the location and intensity of the peaks varies with the type of coordination, as summarized in Table 12.6. In principle, the secondary shell can also be studied in this way. The results of these studies suggest that about 14 to 18 water molecules are present in the complete hydration shell for such ions as Mg2+, Al3+, Cr3+ and Fe3+, within a distance of 0.41 to 0.42 nm. Altogether, this is not an unreasonable estimate, although it should be borne in mind that these experiments are usually performed using rather concentrated solutions.
times the Fe–Cl distance (Figure 12.5). In general, the location and intensity of the peaks varies with the type of coordination, as summarized in Table 12.6. In principle, the secondary shell can also be studied in this way. The results of these studies suggest that about 14 to 18 water molecules are present in the complete hydration shell for such ions as Mg2+, Al3+, Cr3+ and Fe3+, within a distance of 0.41 to 0.42 nm. Altogether, this is not an unreasonable estimate, although it should be borne in mind that these experiments are usually performed using rather concentrated solutions.
Table 12.6 Peaks expected in the pair correlation function for various geometries.
Due to its small size, the H+ ion associates itself strongly with a water molecule, H+ + H2O ↔ H3O+, and forms the oxonium ion H3O+. This (first) water molecule is tightly bound to the proton. It has been shown that the angle between the O–H bonds in H3O+ is about 115°, so that the molecule is almost, but not completely, flat. It is believed that three more water molecules are attracted by the H3O+-ion, forming a hydrogen-bonded structure in which the oxygen atoms of the surrounding water molecules are oriented to the hydrogen atoms of the oxonium ion. This structure has thus to be written as H3O+–3H2O or ![]() . Alternatively, it has been suggested that the H+ ion is tetrahedrally surrounded by four water molecules. The hydrated oxonium ion is referred to as the hydronium ion, and the precise structure of this is still the subject of debate, but in any case the proton is strongly hydrated. A similar situation arises for the OH− ion; in this case, we have three hydrating H2O molecules, so that one writes
. Alternatively, it has been suggested that the H+ ion is tetrahedrally surrounded by four water molecules. The hydrated oxonium ion is referred to as the hydronium ion, and the precise structure of this is still the subject of debate, but in any case the proton is strongly hydrated. A similar situation arises for the OH− ion; in this case, we have three hydrating H2O molecules, so that one writes ![]() . The hydrogen atoms of the surrounding water molecules are closest to the O-atom of the central ion. The hydration enthalpy for the OH− ion is large, but smaller than that for the H+ ion.
. The hydrogen atoms of the surrounding water molecules are closest to the O-atom of the central ion. The hydration enthalpy for the OH− ion is large, but smaller than that for the H+ ion.
Summarizing in one sentence – an ion in solution is far from being alone!
Problem 12.9
Calculate the angle between the water plane and the Li–O direction for a Li–D2O complex, given that r(Li–O) = 0.195 nm and that r(Li–D) = 0.255 nm.